1 Starting to know your apps
This chapter establishes troubleshooting as a foundational skill for Java developers, emphasizing that effective work depends more on understanding existing behavior than writing new code. Troubleshooting is framed as the disciplined process of comparing how a system actually behaves to how it should, then locating the differences. The author distinguishes this broader investigation mindset from the narrower notion of “debugging,” argues that modern applications and dependencies demand multiple complementary techniques, and highlights how AI can accelerate learning and inquiry without replacing the developer’s contextual judgment.
Through common scenarios, the chapter surveys key techniques and when to apply them. Debuggers help step through logic for unexpected outputs or hard-to-read code, while profilers surface what executes and where time is spent—vital when you don’t know where to start or when diagnosing slowness (often tied to I/O). Multithreaded issues can become Heisenbugs, where pausing changes behavior, so logging and careful setup are preferred. When interacting with external systems, stubs can isolate and control integrations. Not all investigations are live: postmortem work relies on outputs, logs, heap dumps, and thread dumps to explain crashes or hangs. Along the way, the chapter encourages learning frameworks (like Spring Security or Hibernate) by stepping into their internals and using AI to brainstorm next steps, craft better prompts, and analyze large artifacts—always with caution about sensitive data and verification.
Finally, the chapter previews the skills the book develops: choosing the right investigation approach; using debuggers beyond basics; profiling to reveal hidden flows and performance hot spots; leveraging logging for behavior and security insights; analyzing heap and thread dumps for memory and liveness problems; and incorporating AI to speed up triage, summarize logs, and guide exploration. The overarching message is to cultivate an investigator’s mindset—systematic, curious, and tool-savvy—so you can confidently understand unfamiliar code, pinpoint root causes, and make targeted, efficient fixes.

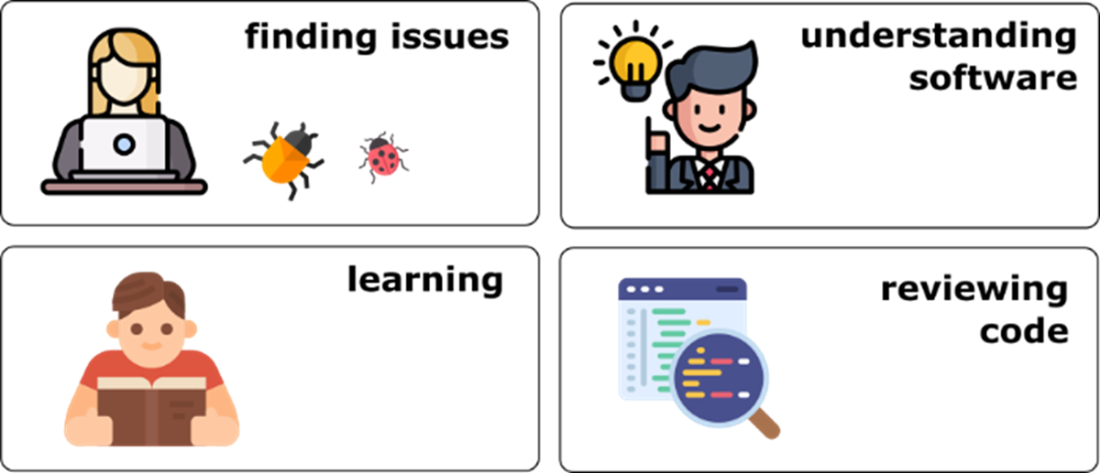
Code investigation is not only about finding problems in software. Today, apps are complex. We often use investigation techniques to understand an app’s behavior or simply to learn new technologies.
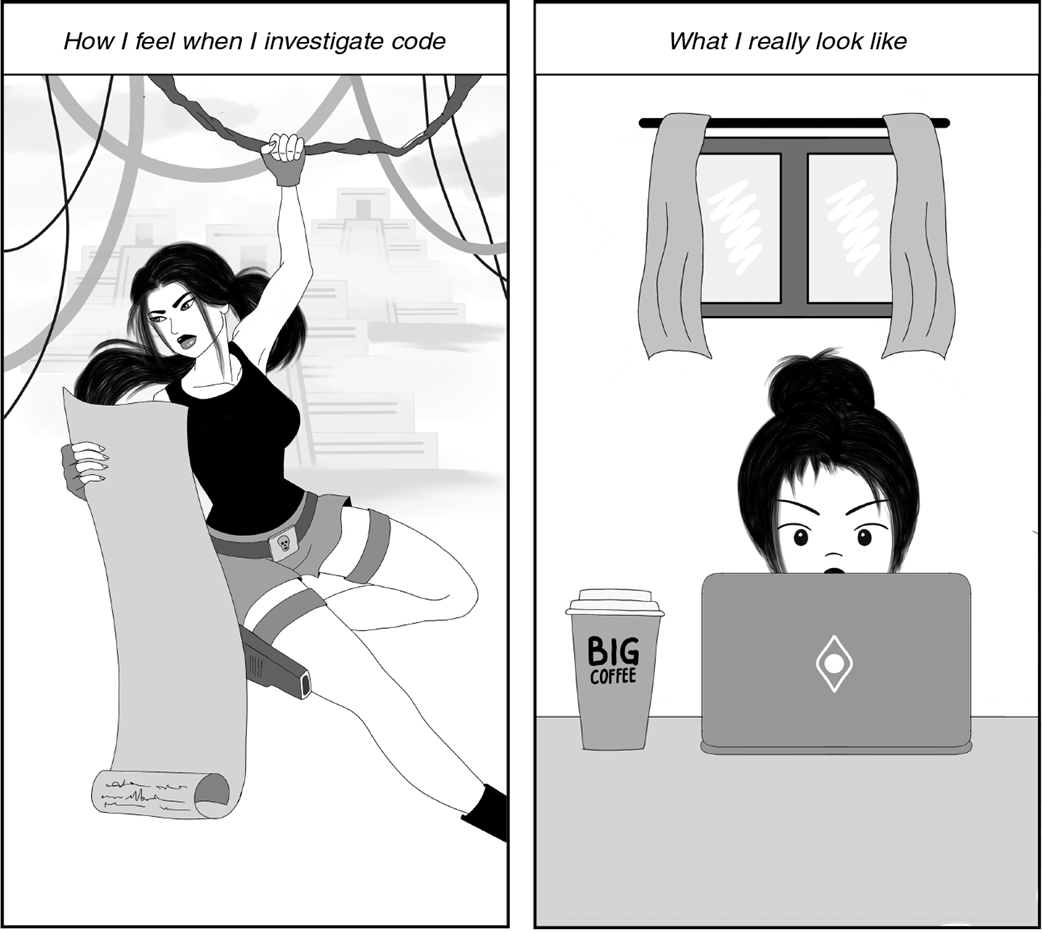
Investigating code doesn’t require much physical effort, but debugging sometimes makes you feel like Lara Croft or Indiana Jones. Many developers enjoy the unique sensation of solving the puzzle of a software issue.
Code investigation techniques. Depending on the case, a developer can choose from one or more of these techniques to understand how a certain capability works.
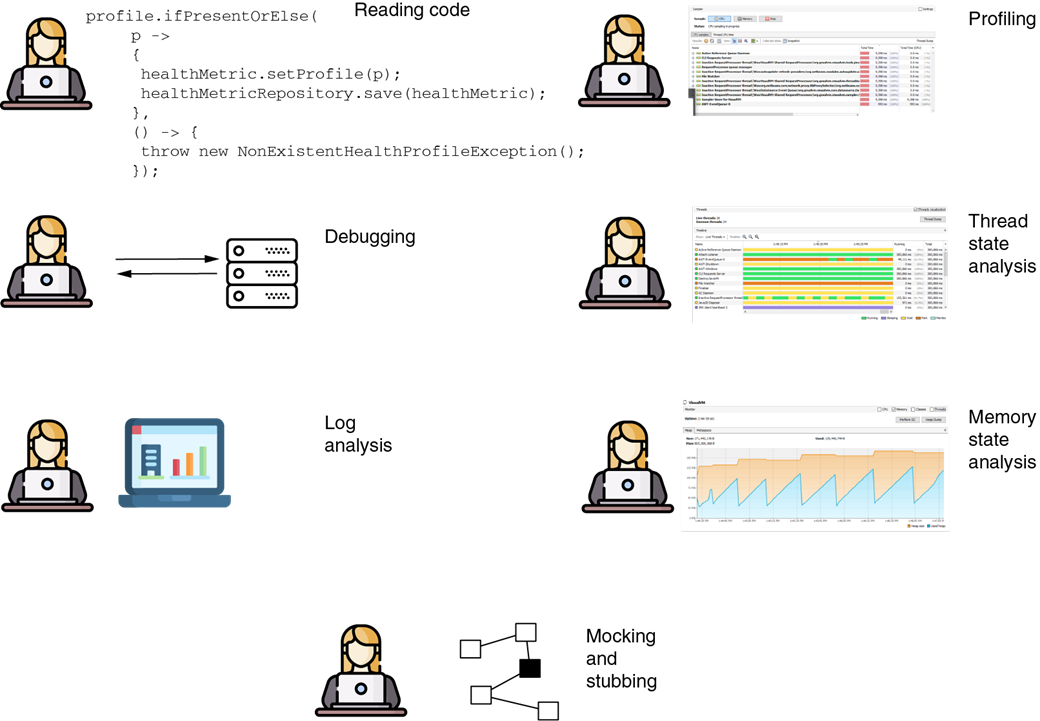
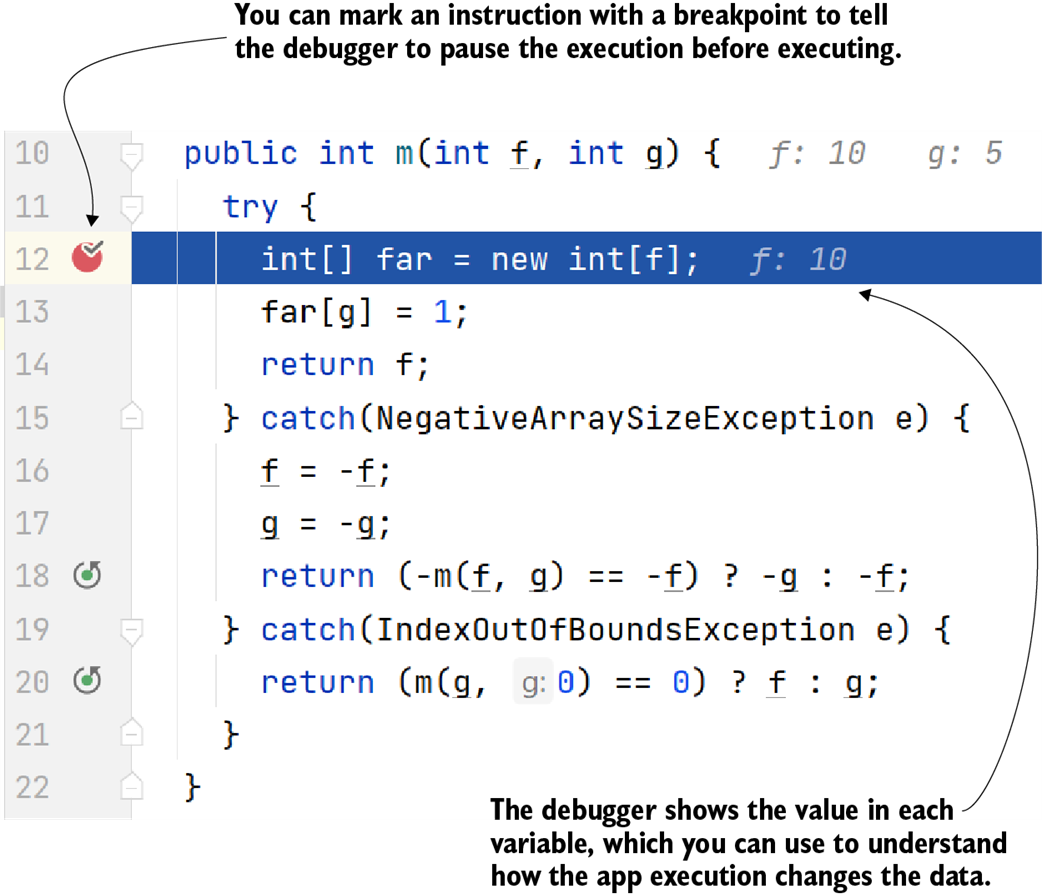
Using a debugger, you can pause the execution before a particular instruction and then observe how the app’s logic changes the data by manually running the instructions step by step.

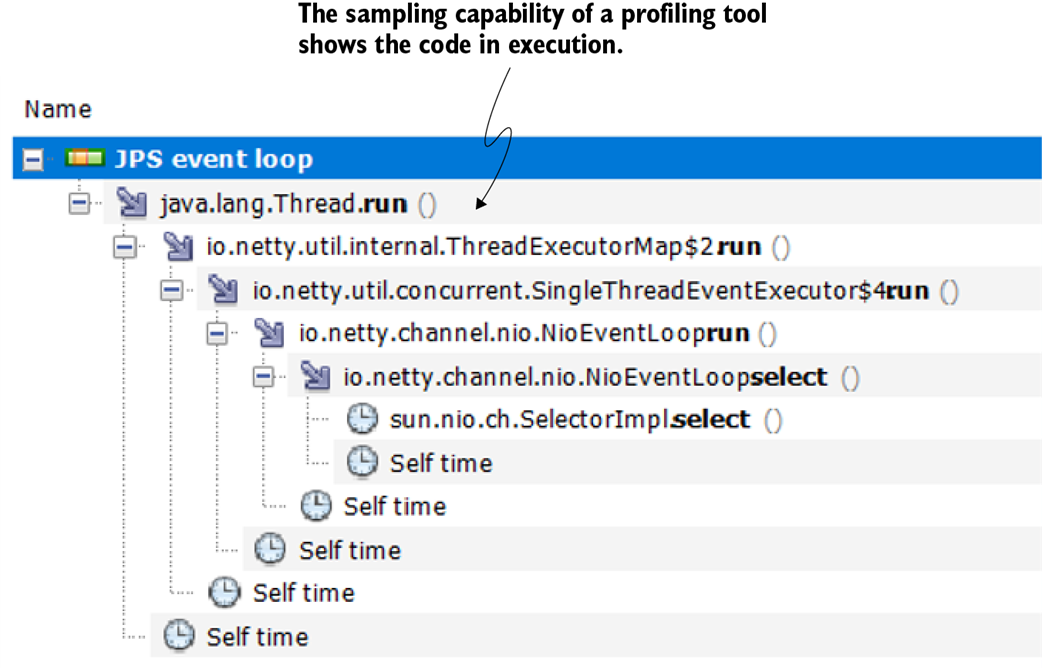
Identifying code in execution with a profiler. If you don’t know where to start debugging, the profiler can help you to identify the code that is running and give you an idea of where you can use the debugger.
A Heisenberg execution. In a multithreaded app, when a debugger interferes with the app’s execution, it might change how the app behaves. This change doesn’t allow you to correctly investigate the initial app behavior that you wanted to research.

A wrong output can be your app sending erroneous requests to another system component. You may be asked to investigate such a behavior and find its root cause.

You can replace the system component your app calls with a stub. You control the stub to determine where your app sends the request from quickly. You can also use the stub to test your solution after you correct the issue.


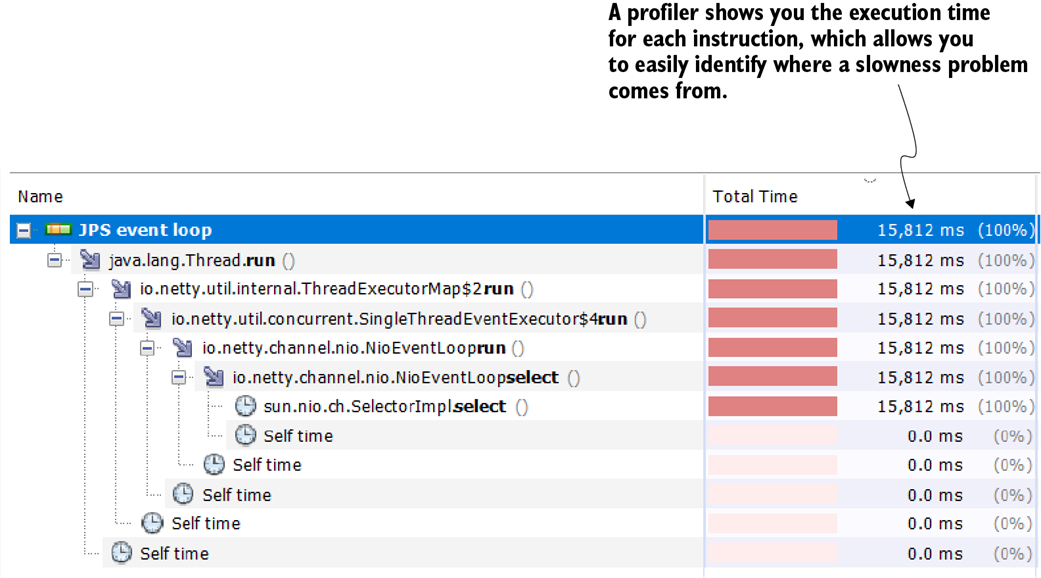
Investigating slowness problems with a profiler. The profiler shows you the time spent on each instruction during code execution. This profiler feature is excellent for identifying the root causes of performance problems.
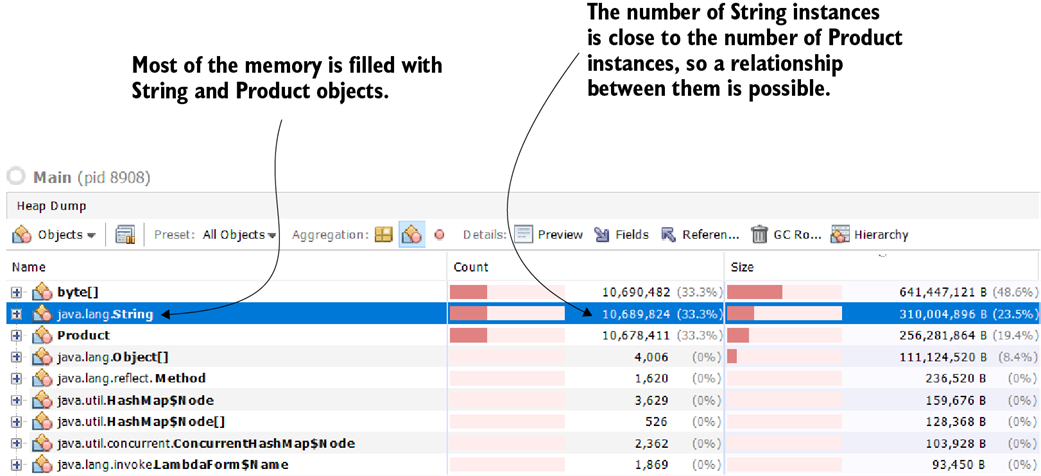
A heap dump is like a map of the heap memory. If you learn how to read it, it gives you invaluable clues about how the app internally processes data. A heap dump helps you investigate memory problems or performance issues. In this example, you can easily find which object fills most of the app’s memory and that the Product and String instances are related.
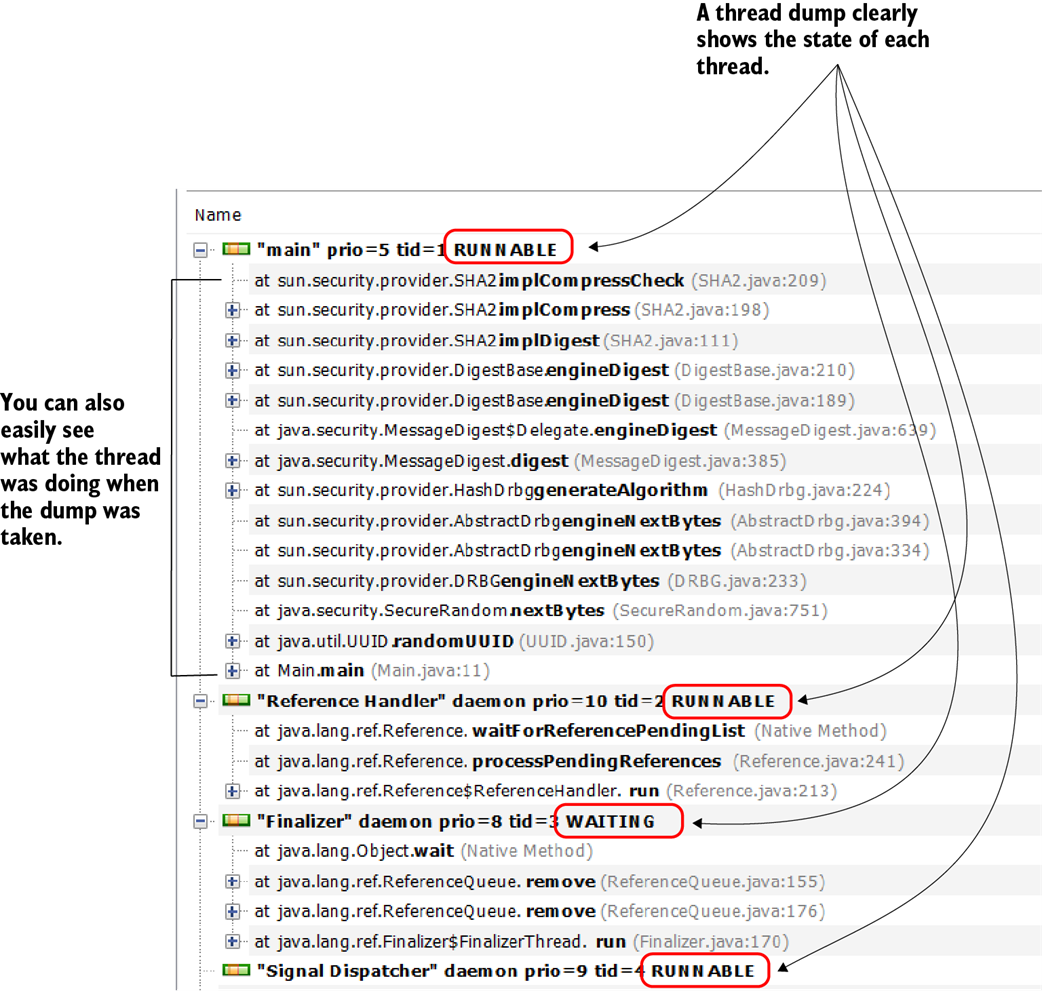
A thread dump provides details about the threads that were running when the dump was taken. It includes thread states and the stack traces, which tell you what the threads were executing or what blocked them. These details are valuable for investigating why an app is stuck or is having performance problems.
Summary
- You can use various investigation techniques to analyze software behavior.
- Depending on your situation, one investigation technique may work better than another. You need to know how to choose the correct approach to make your investigation more efficient. AI tools may prove extremely helpful to help you determine where to start from and what troubleshooting techniques to apply.
- For some scenarios, using a combination of techniques helps you to identify a problem faster. Learning how each analyzing technique works gives you an excellent advantage in dealing with complex problems.
- In many cases, developers use investigation techniques to learn new things rather than to solve problems. When learning complex frameworks such as Spring Security or Hibernate, simply reading books or the documentation isn’t enough. An excellent way to accelerate your learning is to debug examples that use a technology you want to better understand.
- A situation is easier to investigate if you can reproduce it in an environment where you can study it. Reproducing a problem not only helps you find its root cause more easily, but it also helps you to confirm that a solution works when it is applied.
FAQ
What is troubleshooting and why is it valuable?
Troubleshooting is the process of understanding how a system actually behaves, comparing it to how it should behave, and identifying the differences. It’s investigation, not guesswork. Mastering it makes you faster, more confident, and more independent—able to navigate unfamiliar codebases, resolve production issues, and spot design flaws early.How is code investigation different from “debugging,” and from using a debugger?
Code investigation is analyzing a capability’s behavior to understand it, improve it, or fix it. “Debugging” originally meant removing bugs (“de-bug”), but today it’s often used loosely. A debugger (breakpoints, step-through, watches) is just one investigation tool—it’s powerful, but not always the right choice, especially with complex or timing‑sensitive systems.What are the most common reasons to investigate code?
- Find a specific issue or root cause
- Understand a capability to extend or change it
- Review code for correctness
- Learn a framework or library
- Optimize performance
- Improve security and eliminate vulnerabilities
- Enhance maintainability
What counts as “output” when diagnosing unexpected behavior?
Output is any observable result of executing logic—console text, database changes, files, network calls (HTTP requests/responses), or messages sent to other systems. Choose your technique (debugger, profiler, logs, dumps) based on the kind of output you’re validating.How do I approach a simple case of unexpected output?
Use a debugger. Set a breakpoint near the suspected code, step through line by line, watch variable values and evaluate expressions to see where behavior diverges from expectations. This works well when you know the code path and the logic is single‑threaded.What if I don’t know where to start, or the logic is hidden in frameworks/libraries?
- Use a profiler to see which code paths actually execute and narrow where to place breakpoints.
- Add targeted logging to surface control flow and data.
- For external calls, replace the dependency with a controllable stub; e.g., have the stub block responses so you can locate the calling code in the profiler.
- Be prepared to step into library/framework code when needed.
How should I troubleshoot multithreaded issues and “Heisenbugs”?
Multithreaded apps may change behavior when you interfere (e.g., with a debugger). Prefer non‑intrusive techniques: add logs, capture thread dumps, reduce concurrency (e.g., run with one thread) to simplify reproduction, and use profilers cautiously. This minimizes timing shifts that mask the real problem.What is postmortem investigation, and what data should I collect?
Postmortem investigation happens after an app has crashed or become unresponsive. Since it’s no longer running, rely on artifacts such as:- Output and logs up to the failure
- Heap dumps (memory snapshots) for memory issues like OutOfMemoryError
- Thread dumps to see thread states and stack traces when the app is stuck
How do I investigate performance and slowness problems?
- Use a profiler to see time spent per method and identify hotspots.
- Suspect I/O (database, files, network) first—measure before optimizing.
- Remember performance isn’t only latency: battery drain, bandwidth overuse, and zombie threads are performance issues too.
- Once hotspots are known, focus fixes and re‑measure.
How can AI assist troubleshooting, and what are best practices for prompts and safety?
AI can suggest starting points, summarize logs, explain stack traces, and propose avenues to investigate. Best practices:- Be descriptive in prompts; include relevant context.
- Do not share sensitive data (company names, keys, passwords).
- Treat responses as guidance; verify to avoid “hallucinations.”
- Iterate with follow‑up prompts.
- Use AI as a partner—be the puppeteer, not the puppet.
 Troubleshooting Java, Second Edition ebook for free