This opening chapter frames the book as a pragmatic guide for making sound, data-driven decisions under uncertainty. It motivates statistics and quantitative techniques through real-world, high-stakes scenarios and positions the material as both a conceptual foundation and a practical toolkit. Rather than offering either abstract math or cookbook code alone, it emphasizes a dual promise: learn powerful methods such as regression, Monte Carlo simulations, decision trees, optimization, and Markov chains, and understand the assumptions and reasoning that make them work.
Python is presented as the computational backbone because of its clarity, rich ecosystem, and broad industry adoption. The chapter highlights how libraries like Pandas, NumPy/SciPy, Matplotlib/Seaborn, scikit-learn, and Statsmodels streamline everything from data wrangling to modeling and visualization, supported by an active global community. It also surveys IDE options to match project scale and style—IDLE for quick experiments, PyCharm (used throughout the book) for full-featured development, and popular alternatives like Jupyter, Spyder, and PyDev—so readers can choose an environment that keeps the focus on analysis rather than tooling.
The learning approach balances theory and practice: concepts are introduced carefully, then reinforced with annotated, reusable Python code and exploratory workflows that test assumptions, assess fit, and validate results. Early chapters solidify probability and distributions before advancing to models and methods used across finance, operations, and analytics. Readers are taught to go beyond visual checks to formal tests (e.g., normality), to derive and interpret metrics like R-squared, and to communicate findings clearly to stakeholders. The chapter closes by clarifying scope: this is not a Python tutorial or installation guide, but a structured, adaptable path for novices and practitioners to build a transferable, industry-aligned quantitative toolkit.
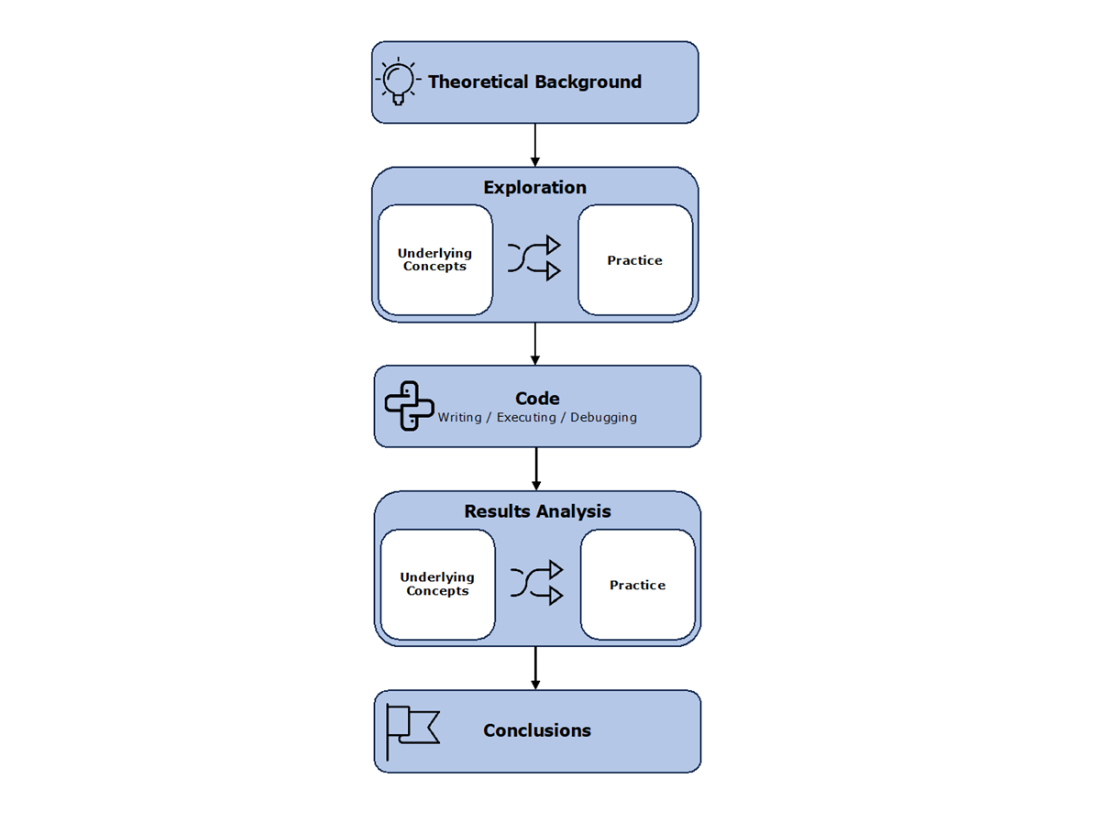
A process map that depicts how you should expect most of the subsequent chapters to flow. The linear component closely aligns with a typical statistical or quantitative problem at work or in the classroom, especially if we were to change out the theoretical background in favor of an opening problem definition. But there is also some non-linearity due to mixing the underlying concepts with practice, where and when it makes sense.
Summary
This book combines statistical and quantitative theory with hands-on Python implementation, empowering readers to solve real-world problems with confidence. It emphasizes both the "how" and the "why," ensuring a deep understanding of each method.
Through the use of Python’s robust ecosystem—including Pandas, NumPy, Matplotlib, Scikit-learn, and Statsmodels libraries—this book demonstrates how to execute techniques efficiently while providing reusable and annotated code for practical applications.
Whether you're a novice seeking foundational knowledge or an experienced practitioner looking to expand your skill set, the book’s clear structure and progression make it accessible and rewarding for all.
Each chapter is dedicated to a single technique, progressing from foundational concepts to advanced applications. Chapters 2 and 3 serve as foundational pillars, providing essential knowledge in basic and conditional probabilities, common probability distributions, counting rules, and combinations and permutations.
Real-world examples, such as optimizing staffing levels, forecasting stock prices, and analyzing Markov chains, illustrate the applicability of these techniques across industries. Readers gain not only technical expertise but also the critical thinking skills needed to apply these methods effectively in diverse scenarios.
FAQ
What is the purpose of this book and who is it for?This book equips programmers, students, and practitioners to make data-driven decisions in high-stakes settings by blending solid statistical theory with hands-on Python implementations. It’s designed for both beginners building foundations and experienced professionals expanding their quantitative toolkit.Why does the book use Python for stats and quant?Python offers a rare mix of simplicity, power, and versatility. Its rich ecosystem (Pandas, NumPy/SciPy, Matplotlib/Seaborn, scikit-learn, Statsmodels), ease of learning, strong community support, and broad industry adoption make it ideal for bridging theory and practice across analysis, modeling, optimization, and simulation.Which Python libraries will I use most?The core toolkit includes Pandas for data manipulation, NumPy and SciPy for numerical computing, Matplotlib and Seaborn for visualization, and scikit-learn and Statsmodels for machine learning and statistical models. These libraries streamline end-to-end workflows from exploration to modeling and presentation.Do I need to already know Python?Yes—basic familiarity is assumed. This is not a Python tutorial; the focus is applying Python to statistical and quantitative methods. The book does not cover installing Python or IDEs, but provides reusable, well-annotated code so you can implement techniques effectively.Which IDE is used for the examples?All examples were developed in PyCharm 2023.3.3 (Community Edition) on macOS Sonoma 14.2.1 using Python 3.12.12, with libraries installed via pip. While PyCharm is the book’s primary IDE, you can follow along on other platforms with similar setups.Can I use IDLE or other IDEs instead of PyCharm?Yes. IDLE is fine for quick experiments but lacks advanced debugging, version control, and project management. Jupyter Notebook excels at interactive, exploratory work; Spyder suits scientific computing with its variable explorer; PyDev (Eclipse) fits multi-language, large projects. Choose based on your workflow and project scale.How are chapters structured?Each chapter is self-contained and follows a practical flow: establish theory and assumptions, explore data, implement solutions in Python, and interpret results. You can read sequentially for a full journey or jump to specific topics as needed.How does the book balance theory and practice?Concepts come first (e.g., regression assumptions, randomness in Monte Carlo, Markov state transitions), followed by annotated Python code that shows how and why each step works. This dual approach builds both conceptual understanding and implementation skills.What topics will I learn?You’ll cover regression (linear and logistic), decision trees and random forests, time series analysis, Monte Carlo simulations, Markov chains, and optimization (e.g., linear programming). You’ll also learn to evaluate assumptions, decompose sums of squares, run formal tests (like Shapiro–Wilk), and communicate results effectively.What is out of scope for this book?The book does not teach general Python programming or provide step-by-step installation guides for Python or IDEs. It focuses on applying statistical and quantitative techniques with Python, assuming your development environment is already set up.
pro $24.99 per month
access to all Manning books, MEAPs, liveVideos, liveProjects, and audiobooks!
 Statistics Every Programmer Needs ebook for free