1 Why you should care about statistics
Statistics matters because data is now part of nearly every profession, product, and decision-making process. The chapter frames statistics as the practice of describing data and using samples to infer truths about larger populations or domains. Rather than treating statistics as a memorization-heavy classroom subject, the book emphasizes intuition, practical examples, and Python-supported calculations so readers can focus on concepts, uncertainty, and real-world usefulness.
The chapter explains that modern life produces massive streams of data through digital systems, businesses, devices, and online interactions, but data has value only when people can interpret it well. Statistical thinking helps professionals make better decisions under uncertainty, such as forecasting inventory, evaluating marketing campaigns, measuring system reliability, assessing product tolerances, or validating machine learning models. It is especially useful for analysts, researchers, data scientists, engineers, software developers, consultants, and AI practitioners who need to reason from incomplete or noisy evidence.
The chapter also stresses that statistics must be used carefully and ethically. Studies, business claims, and model results can be distorted by bad incentives, biased sampling, ignored confounding variables, selective reporting, or pressure to support a preferred conclusion. A strong statistical mindset helps people scrutinize claims, understand uncertainty, test models against new data, and recognize when machine learning or statistical methods are appropriate. The overall mental model is to form or discover a hypothesis, gather data, fit a model, and evaluate whether it generalizes beyond the data used to build it.
Instead of the classroom approach using lookup tables, we will use Python to simplify our statistics calculations.

Digital databases, the Internet, and portable electronic devices have enabled data gathering at a global scale.


An example of the four steps in statistics, studying whether temperature has an impact on sports drinks sales.

Summary
- Statistics is describing and inferring truths from data, which takes the form of analyzing a sample representing a larger population or domain.
- Statistics is relevant to any profession that involves data, from analysts to machine learning practitioners and software engineers.
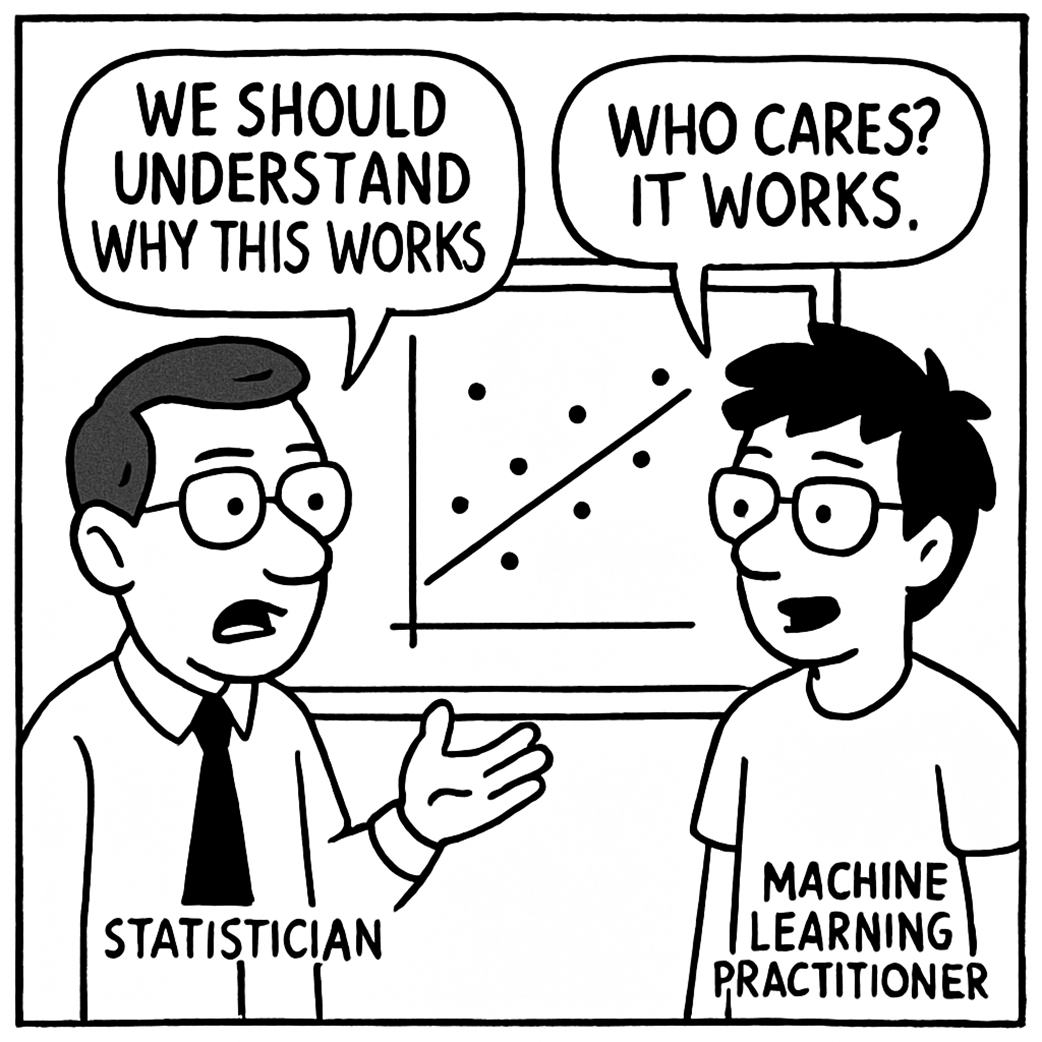
- Statistics and machine learning have a lot in common, sharing the same techniques but with different mindsets and approaches.
- Python is a practical and employable platform for practicing statistical concepts, and it can use readily available, stable libraries for tasks such as plotting (matplotlib), data wrangling (pandas), and numerical computing (NumPy).
- This book will cover a mix of theory, practical hands-on, and “real-world” advice, so you never miss the big picture but still be actionable in the implementation details.
- “Statistics.” Merriam-Webster.com Dictionary, Merriam-Webster, https://www.merriam-webster.com/dictionary/statistics. Accessed 28 Apr. 2025.
- https://www.youtube.com/watch?v=tm3lZJdEvCc
- https://hbr.org/2012/10/data-scientist-the-sexiest-job-of-the-21st-century
- https://www.thestreet.com/automotive/car-insurance-companies-quietly-use-these-apps-to-hike-your-rates
- https://www.statlearning.com/
 Grokking Statistics ebook for free