1 What does an analyst do?
This chapter introduces analytics as the practice of using data to uncover and communicate patterns, trends, and insights that inform decisions. It highlights the many paths into the field and the blend of mathematics, programming, and business context required to deliver value. Beyond technical capability, the chapter emphasizes communication, stakeholder alignment, and practical judgment as essential skills that are often under-taught but crucial to an analyst’s effectiveness and growth.
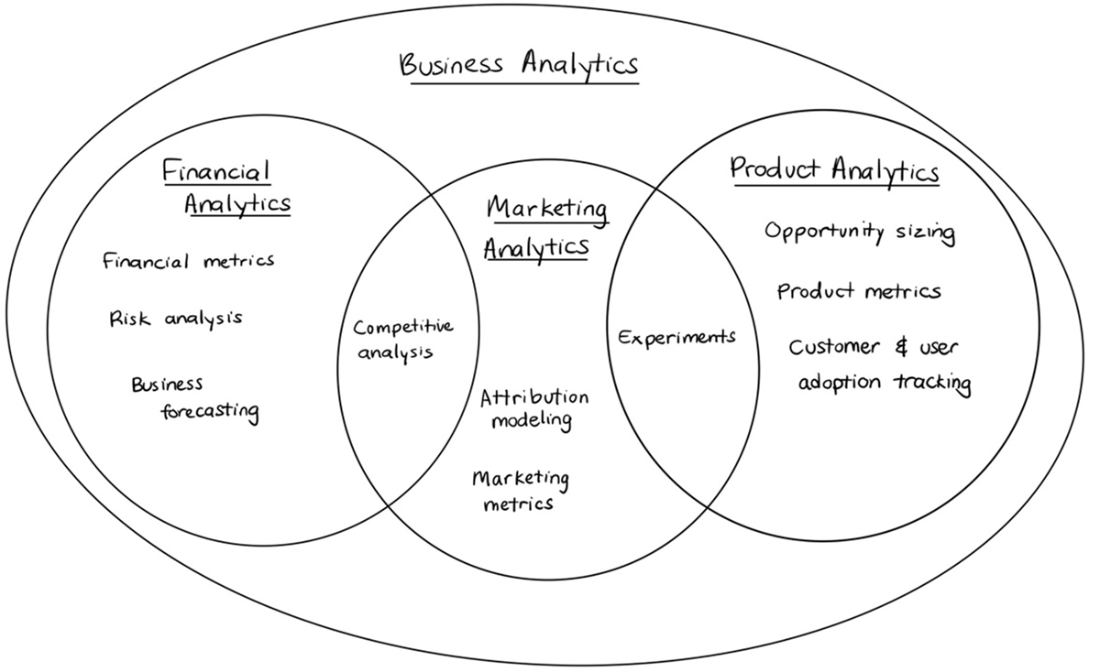
It surveys common analytics domains and their typical deliverables. Business intelligence focuses on defining metrics and KPIs, producing dashboards and reports, and tailoring communication for non-technical stakeholders. Marketing analytics applies experimentation (such as A/B testing), attribution modeling, and competitive analysis to optimize acquisition and engagement. Financial analytics tracks core financial metrics, quantifies risk, and builds forecasts to guide planning. Product analytics supports R&D and product teams with opportunity sizing and rigorous experimentation to improve user experience and business outcomes. The chapter underscores that these domains overlap and evolve, and individual roles often blend responsibilities.
The chapter also outlines an analyst’s core toolkit: spreadsheets for quick manipulation and sharing; SQL and data warehouses for accessing and shaping tabular data; a statistical programming language (commonly R or Python) for analysis and modeling; and visualization tools for creating static visuals and dynamic, self-serve dashboards. It encourages choosing tools that match team norms and stakeholder needs, and continuously augmenting the toolkit to reduce manual work. Finally, it prepares readers for real-world expectations—varied career trajectories, demonstrating value, managing ad-hoc demands, and avoiding the “analytics fallacy” where simple outputs mask complex effort—setting the stage for building both technical and interpersonal skills that drive impact.
Welcome, fellow data human! We have a lot of great topics to cover together, and we’ll do so in as light-hearted and fun a manner as possible.

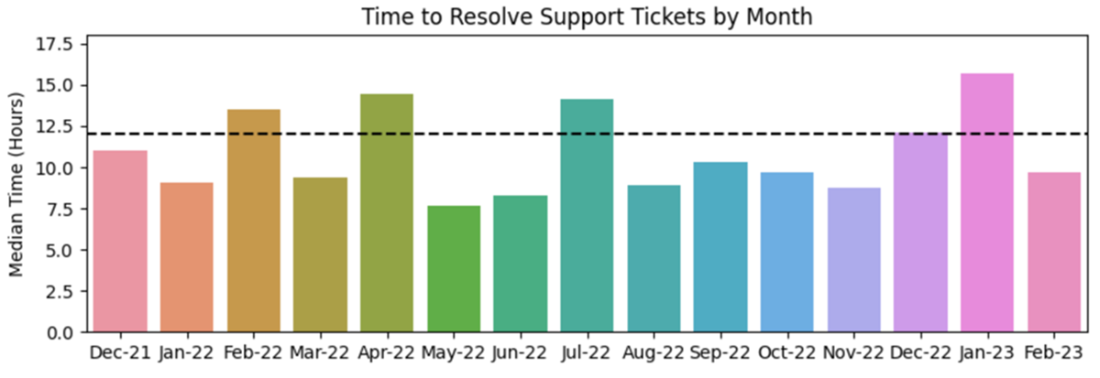
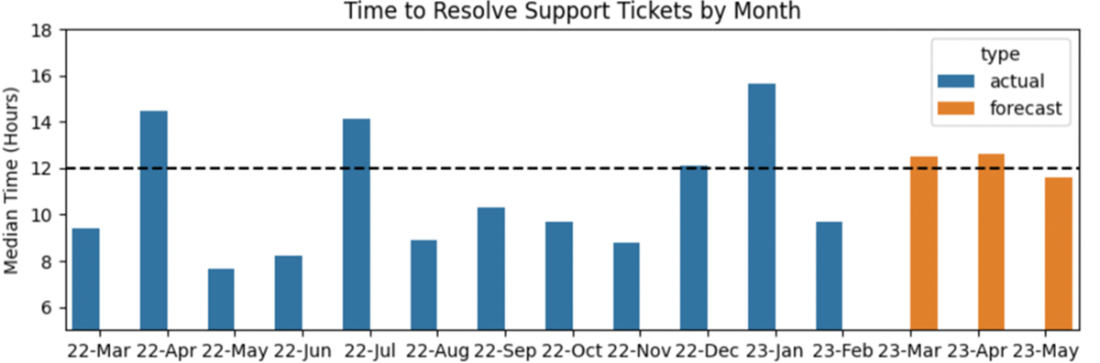
Line graph of a support team KPI with a threshold for the service level agreement (SLA) for resolving tickets in less than 12 hours. Metrics and KPIs generate value when tracked over time.
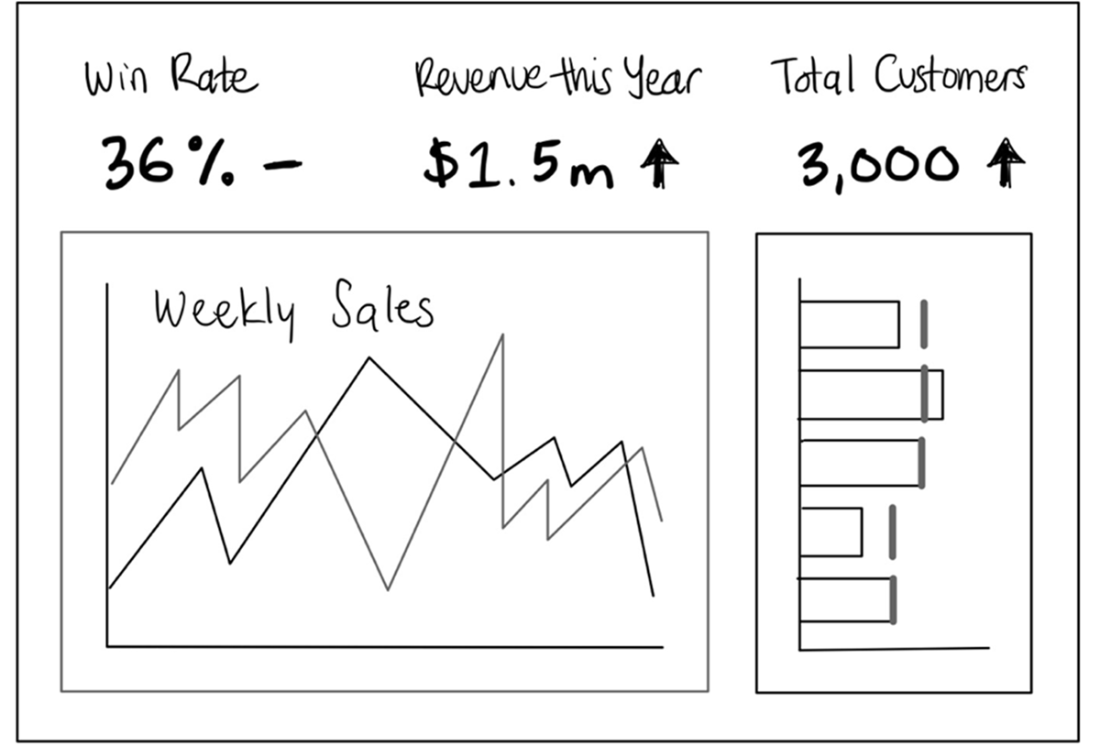
A dashboard typically contains summary information and the highest-value visualizations for quick interpretation.
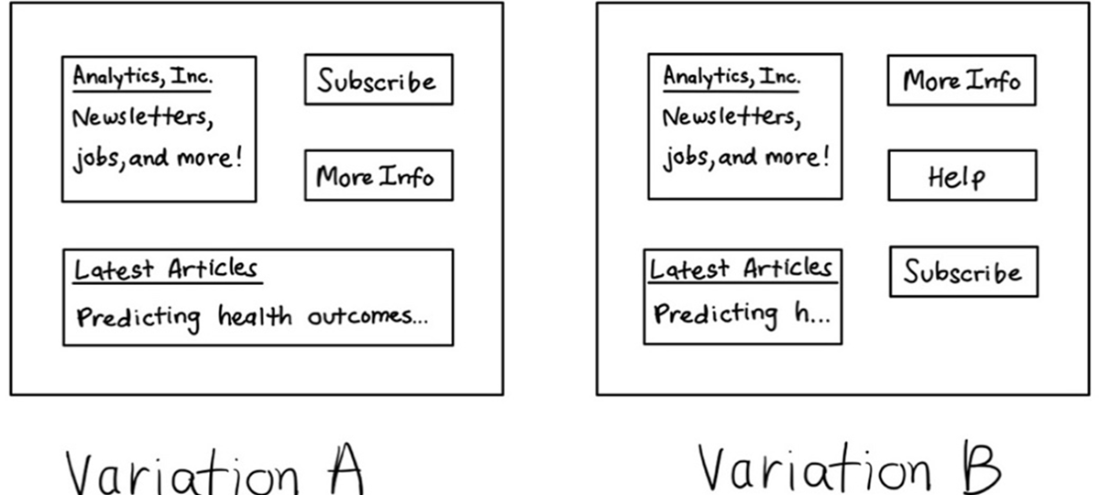
Example of two conditions in an A/B test varying the location of the Subscribe button. Small, iterative variations like this can significantly improve user engagement and revenue.
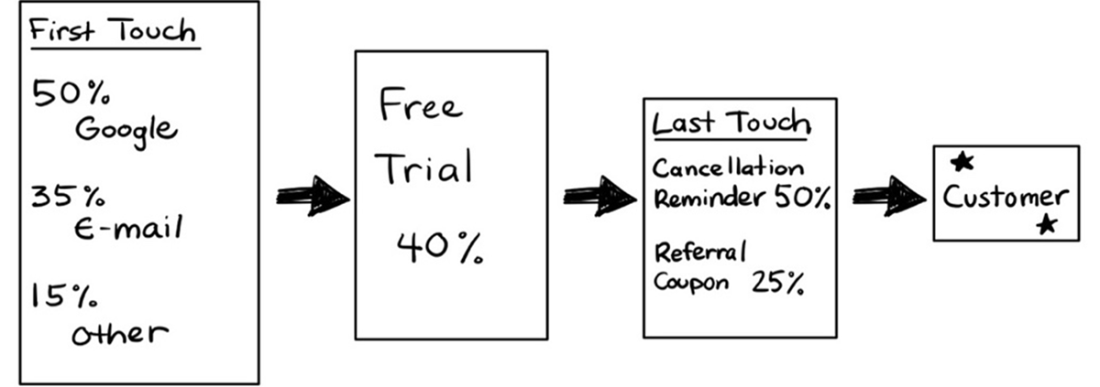
Attribution model showing first/last touch and example intermediary steps. Each model breaks down the sources at the touchpoint to understand which is most successful at generating new customers.
A revision of Figure 1.2, with a 3-month rolling average forecast. Forecasting methods range from simple calculations such as this one to more complex time series modeling approaches. A simple forecast like the above will typically have less variability than the actual data.
Concentric circles showing common areas of overlap according to categories of deliverables provided by different analytics teams.
Don’t underestimate the value of a spreadsheet for easy analysis and sharing!
Summary
- There is a wide range of analytics domains (e.g., marketing analytics, product analytics). Each has a standard set of workflows and deliverables and unique methods to solve problems within the function.
- Analysts typically use spreadsheet tools, querying languages, programming languages, and data visualization tools to complete their work and develop deliverables for stakeholders.
- Being successful as an analyst involves more than producing the output assigned to you; it involves strategic stakeholder communication and alignment to create value over time.
 Effective Data Analysis ebook for free