This chapter reframes DAX as the interactive calculation language behind Power BI and Fabric semantic models. Unlike SQL or Excel, DAX evaluates inside a live semantic model whose filter context changes with every user interaction. The same measure can show different results across visuals, slicers, and totals because the environment—filters injected by the report state—drives evaluation. Mastery comes from understanding this dynamic context rather than memorizing function lists.
The semantic model—its tables, relationships, and metadata that govern filter flow—continuously reshapes which rows are in scope, and DAX reevaluates measures each time, effectively as if wrapped in CALCULATE that merges all active filters. This interactivity enables responsive analytics: KPIs and time intelligence that adapt to selections, dynamic ranking and segmentation, scenario analysis via parameters and disconnected slicers, and cross-fact comparisons through shared dimensions. DAX exists to keep business logic correct under constant interaction, allowing authors to preserve, override, or selectively allow filters so totals, detail rows, and visuals remain consistent with intent.
The book targets Power BI practitioners and teaches DAX by building a mental model first, using visuals to reveal hidden filters, pseudo-DAX to surface context, and a progression from context to relationships to advanced patterns and scale. It distinguishes interactive DAX in reports from standard DAX in tools, shows how authors and consumers shape evaluation context, and equips readers with functions to manage it (for example, CALCULATE, ALL, REMOVEFILTERS, KEEPFILTERS, CROSSFILTER, TREATAS). In the age of LLMs and agentic systems that generate valid syntax but not behavior, this model-aware understanding is essential to diagnose, guide, and govern measures so they behave predictably as users explore.
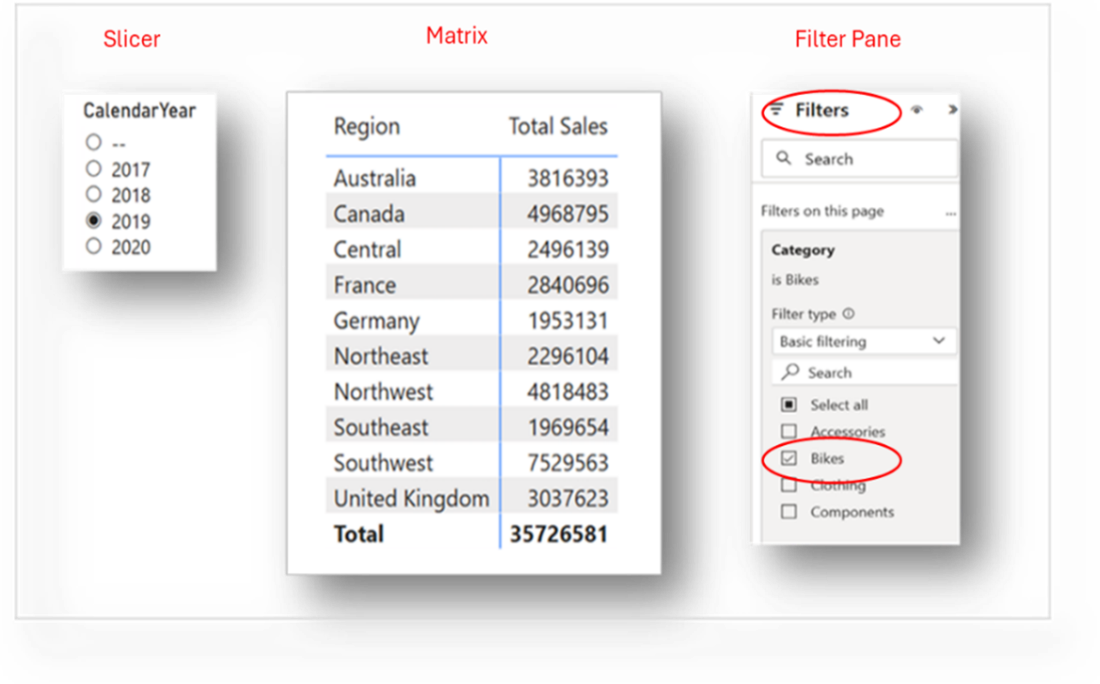
A Power BI report with matrix visual and slicer and filter panes
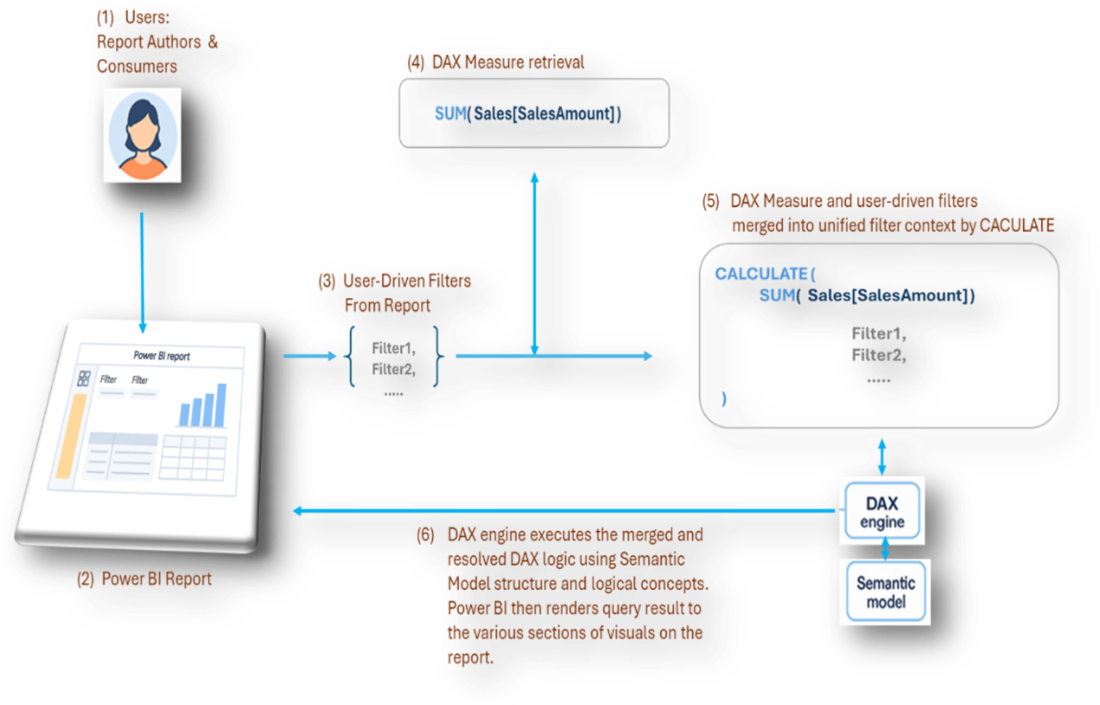
Visual flow, from user interaction to execution of DAX in a specific context
Summary
DAX evaluates formulas inside a dynamic semantic model, not a static dataset.
Power BI supplies much of the context through user interactions, visuals, slicers, and relationships.
Interactivity is the primary reason the same DAX expression can produce different results across visuals.
Understanding evaluation context is more important than memorizing functions.
In the age of LLMs, MCP servers, and agentic workflows, a solid grasp of interactive DAX is essential to validate and guide AI-generated logic.
This book teaches DAX through the lens of interactivity and model behavior, preparing you to design calculations that behave intentionally under real report usage.
FAQ
What is DAX and where does it run?DAX (Data Analysis Expressions) is the calculation language for Power BI, Analysis Services, Excel data models, and Microsoft Fabric semantic models. It evaluates formulas inside a live semantic model and recalculates as users interact with reports.How is DAX different from SQL or Python?SQL and Python typically run fixed logic against static datasets. DAX is functional and model-aware: relationships govern filtering, joins are implicit once relationships exist, and the evaluation context is dynamic—shaped by user actions like slicers, filters, and drill operations.What is the Power BI semantic model, and why does it matter?The semantic model consists of tables and relationships, metadata controlling filter flow, and measures. It determines which data is in scope for any calculation. Because DAX evaluates inside this model, every measure’s result depends on the model’s current visible rows.What does “interactive DAX” mean?Interactive DAX is DAX evaluated within Power BI reports where filter context changes continuously based on visuals, slicers, cross-highlighting, and drill actions. The same measure is reevaluated many times, each against the current filter state.How do user interactions create hidden filters in my measures?When users click slicers, set page filters, or expand a matrix, Power BI injects those filters into the measure’s context. Conceptually, the engine wraps your expression in a CALCULATE that accumulates these active filters before evaluation.Why can totals and subtotals differ from detail rows?Visuals evaluate your measure at multiple levels (row, subtotal, grand total), each with a different filter context. Correct totals require intentional control of filter context—sometimes preserving, overriding, or selectively allowing filters to align results with business logic.When should I use DAX vs. SQL or Power Query?Use DAX for live, context-aware calculations that must respond to report interactions. Use SQL or Power Query for row-by-row transformations, cleaning and reshaping source data, precomputing static rules, or reducing data volume at refresh time.What are the two modes of DAX execution?Interactive DAX runs in reports with constantly changing filter context; standard DAX runs in tools like DAX Studio where filter context is static and controlled—ideal for testing and debugging.Who influences DAX results: report authors or consumers?Both. Authors shape context by designing visuals and filters; consumers influence context by interacting with the report (slicers, drill, cross-filter). Either role can change the evaluation context without writing any DAX.Why aren’t AI tools (e.g., Copilot, ChatGPT, MCP) enough by themselves for DAX?AI can generate valid DAX syntax but cannot infer your report’s interactive behavior—slicer design, filter precedence, totals behavior, relationships, or disconnected tables. Even with MCP exposing metadata, you must apply a solid mental model of interactivity to ensure measures behave as intended.
pro $24.99 per month
access to all Manning books, MEAPs, liveVideos, liveProjects, and audiobooks!
 DAX Reimagined ebook for free