books & videos by Gary Sutton
Statistics Slam Dunk Video Edition
Is losing basketball games on purpose a rational strategy? Which hustle statistics have an impact on wins and losses? Does spending more on player salaries translate into a winning record? You’ll answer all these questions and more. Plus, R’s visualization capabilities shine through in the book’s 300 plots and charts, including Pareto charts, Sankey diagrams, Cleveland dot plots, and dendrograms.
Statistics Every Programmer Needs Video Edition
Statistics Every Programmer Needs teaches you how to apply statistics to the everyday problems you’ll face as a software developer. Each chapter is a new tutorial. You’ll predict ultramarathon times using linear regression, forecast stock prices with time series models, analyze system reliability using Markov chains, and much more. The book emphasizes a balance between theory and hands-on Python implementation, with annotated code and real-world examples to ensure practical understanding and adaptability across industries.
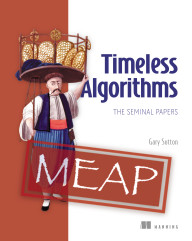
Timeless Algorithms: The Seminal Papers
Timeless Algorithms: The Seminal Papers uses the insights of AI pioneers to help you diagnose failures, recognize hidden assumptions, and reason across the layers of your models and applications. Each chapter connects a common data tool to its seminal mathematics paper, revealing the “hidden stack”—a unique framework that maps the layers of modern intelligence from data to philosophy. With a focus on judgement and ethics, you’ll learn to design trustworthy systems, think probabilistically, and use automation wisely to build intelligent models that are not just effective, but principled.
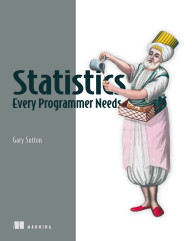
Statistics Every Programmer Needs
Statistics Every Programmer Needs teaches you how to apply statistics to the everyday problems you’ll face as a software developer. Each chapter is a new tutorial. You’ll predict ultramarathon times using linear regression, forecast stock prices with time series models, analyze system reliability using Markov chains, and much more. The book emphasizes a balance between theory and hands-on Python implementation, with annotated code and real-world examples to ensure practical understanding and adaptability across industries.
Statistics Slam Dunk
Is losing basketball games on purpose a rational strategy? Which hustle statistics have an impact on wins and losses? Does spending more on player salaries translate into a winning record? You’ll answer all these questions and more. Plus, R’s visualization capabilities shine through in the book’s 300 plots and charts, including Pareto charts, Sankey diagrams, Cleveland dot plots, and dendrograms.


