5 Identifying resource consumption problems using profiling techniques
This chapter introduces profiling as a practical way to illuminate resource-consumption problems in Java applications. It explains how a profiler inspects a running JVM to reveal CPU and memory usage, thread activity, and where time is spent in code, positioning the tool as a first-line compass for diagnosing strange behavior. Using VisualVM as the working example, the chapter outlines how to set up the tool and use its high-level views to quickly assess health before drilling into deeper diagnostics in later chapters.
Through concrete scenarios, the chapter shows where profiling delivers the most value: spotting abnormal resource usage (often rooted in thread-synchronization issues or memory leaks), discovering which code actually executes via sampling, and isolating performance bottlenecks. A faulty producer–consumer example illustrates classic concurrency symptoms: high CPU with little useful work, minimal memory activity, and continuously running “zombie” threads; after adding proper synchronization, CPU and memory patterns stabilize and thread behavior becomes orderly. The Monitor and Threads views provide fast, visual cues to distinguish healthy from unhealthy execution and guide next steps such as thread dumps.
For memory leak detection, the chapter demonstrates a simple program that accumulates objects without releasing references, leading to steadily rising heap usage and eventual OutOfMemoryError. It contrasts normal memory “peaks and valleys” (allocation followed by garbage collection) with the monotonic growth typical of leaks, and notes that metaspace can also be exhausted in certain misuse scenarios. While adjusting heap and metaspace sizes can buy time, true resolution requires identifying the root cause, typically via heap dumps; AI assistants can help brainstorm next steps from profiling evidence, but their suggestions must be validated with systematic analysis.

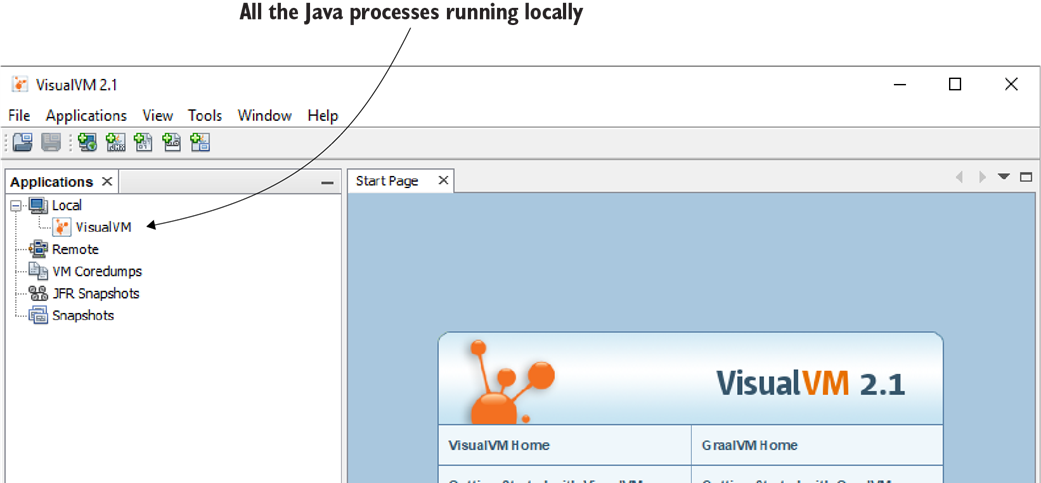
VisualVM welcome screen. Once you configure and start VisualVM, you find that the tool has a simple and easy-to-learn GUI. On the left of the welcome screen are the processes running locally that you can investigate with the tool.
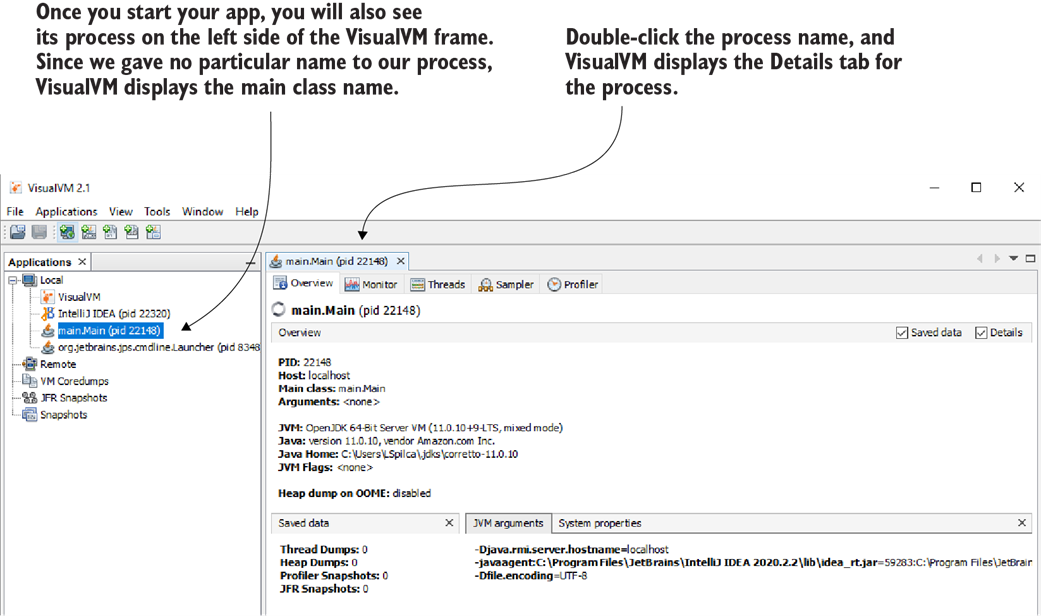
Double-click a process name to start using VisualVM to investigate that process, and a new tab will appear. In this tab are all the needed capabilities VisualVM provides for exploring that particular process.
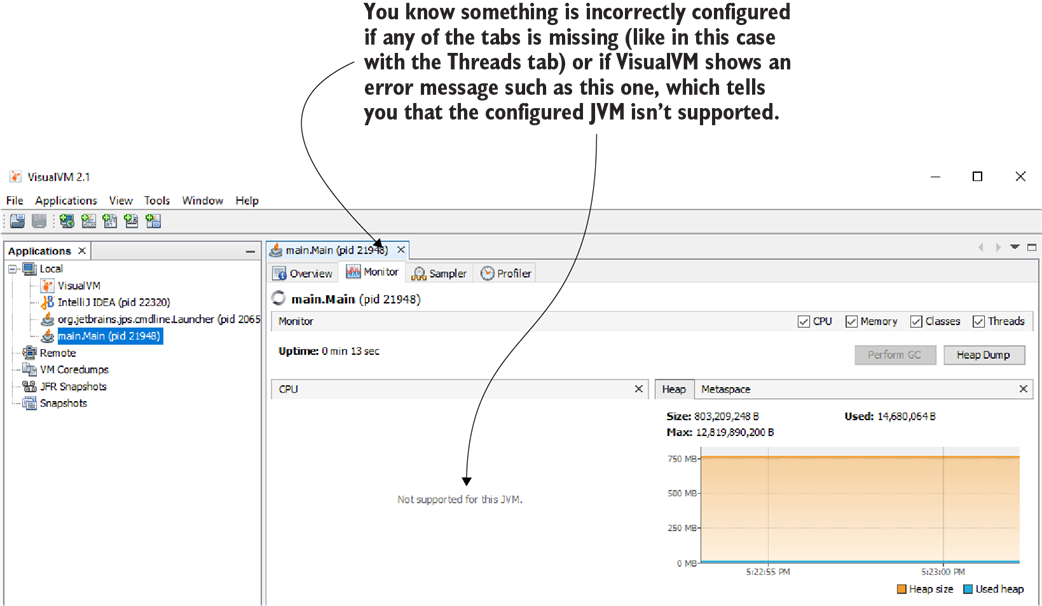
If the tool doesn’t seem to be working properly, you need to check how it is configured. Such problems can occur when the configured JVM distribution is not among those VisualVM supports. Sometimes, the tool can’t connect to the local process you want to investigate. In such cases, use a different JVM distribution that complies with the tool’s requirements or review how the process you want to investigate was started.

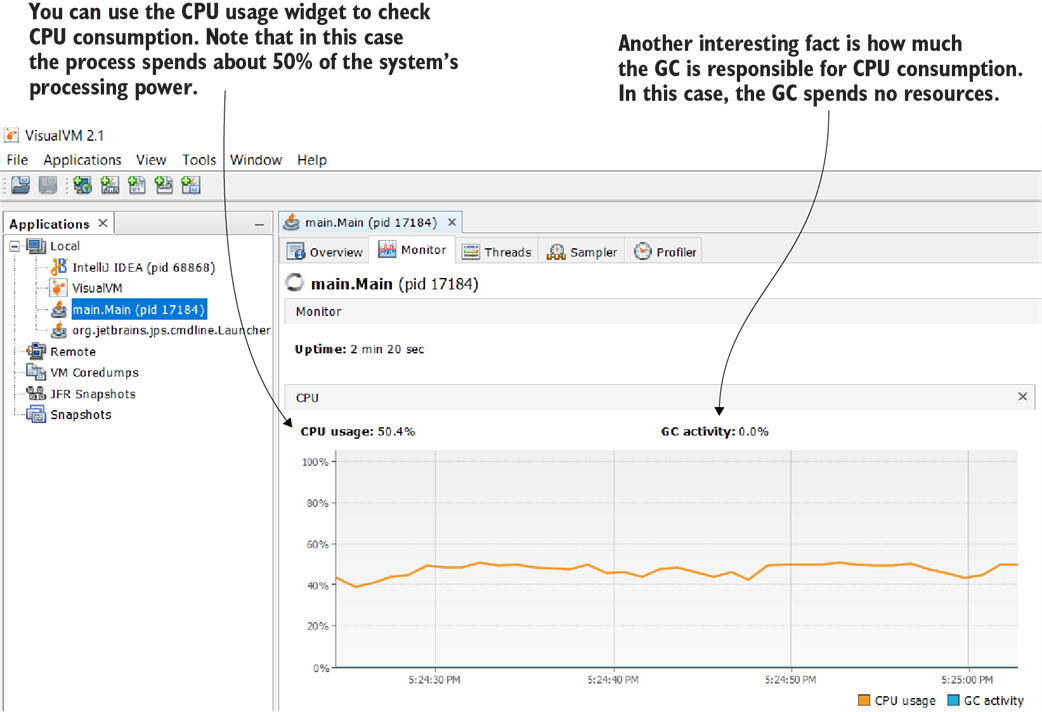
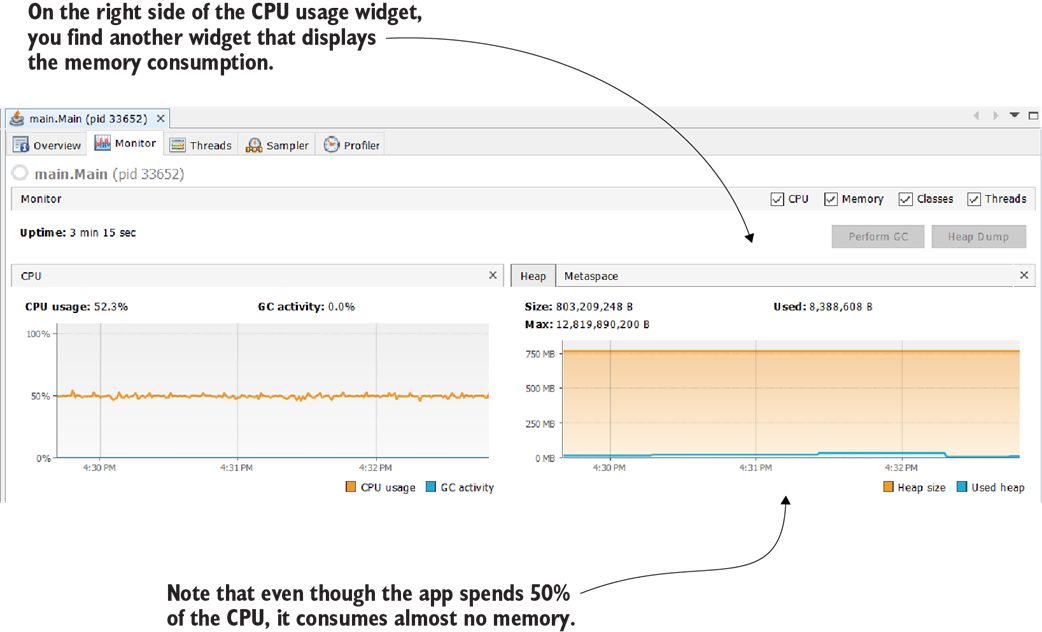
Using VisualVM to observe the use of CPU resources. The widget in the Monitor tab shows you how much CPU the process uses and how much of the usage is caused by the GC. This information helps you to understand whether the app has execution problems and is excellent guidance for the next steps in your investigation. In this particular example, the process spends about 50% CPU. The GC doesn’t influence this value. These signs are often indicators of zombie threads that are usually generated by concurrency problems.
On the right side of the CPU usage widget, you find the memory usage widget. In this example, the app uses almost no memory. This is also why the GC activity is zero. An app not consuming any memory means the app isn’t doing anything.

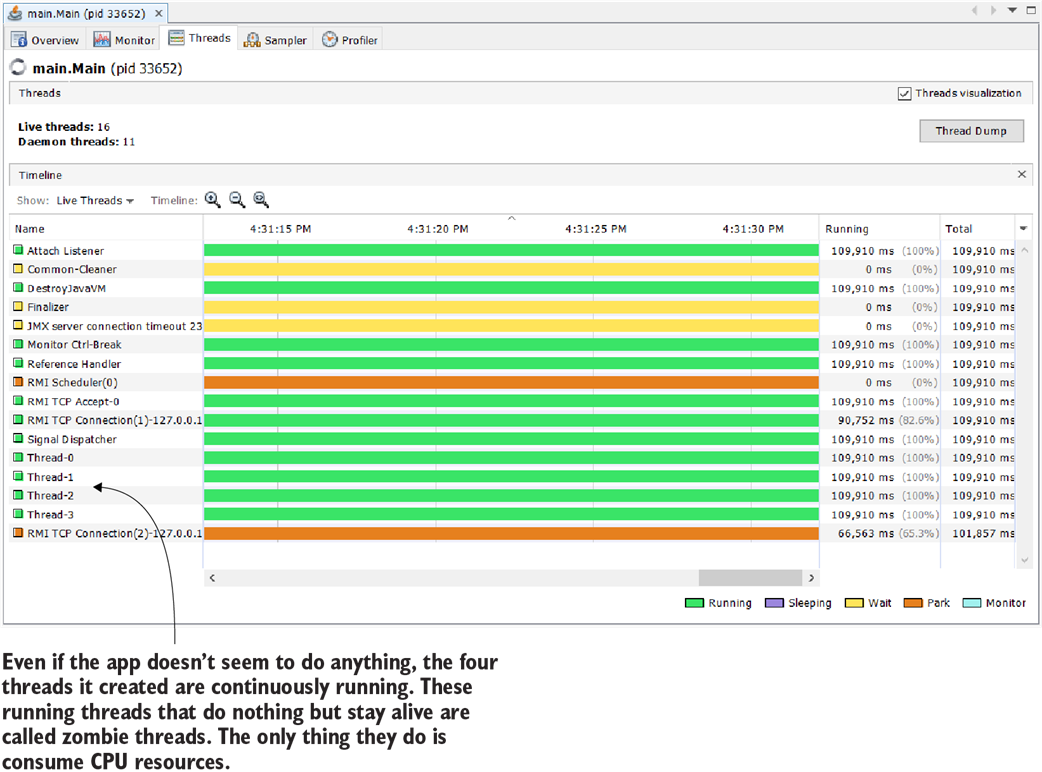
The Threads tab offers a visual representation of the threads that are alive and their status. The widget shows all the process threads, including those started by the JVM, which helps you to easily identify which threads you should pay attention to and eventually investigate deeper using a thread dump.
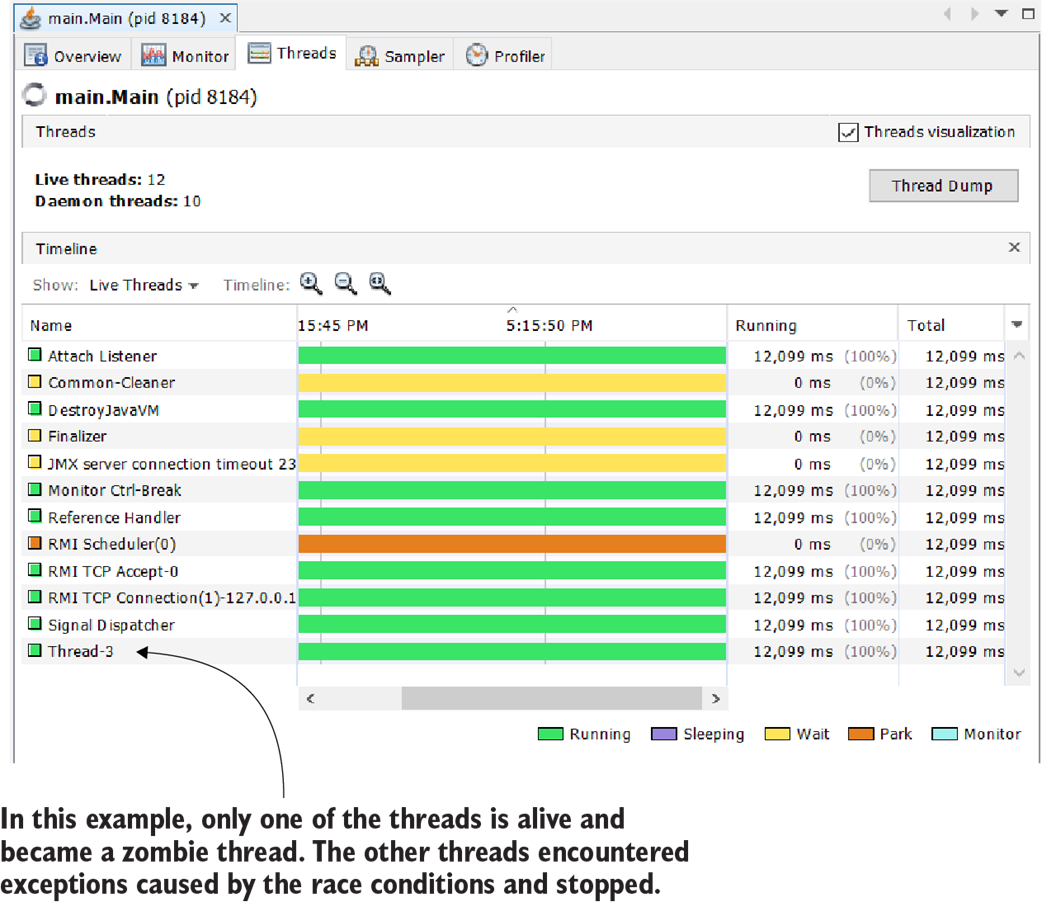
If exceptions occur during an app’s execution, some threads may be stopped. This figure shows a case in which the concurrent access caused exceptions in three threads and stopped them. Only one thread remained alive. Remember, concurrency problems in multithreaded apps can cause different unexpected results.
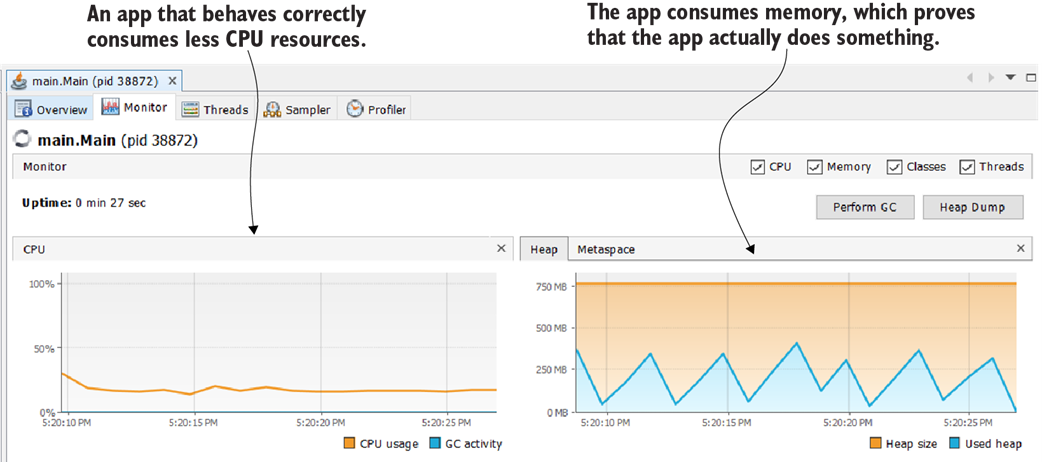
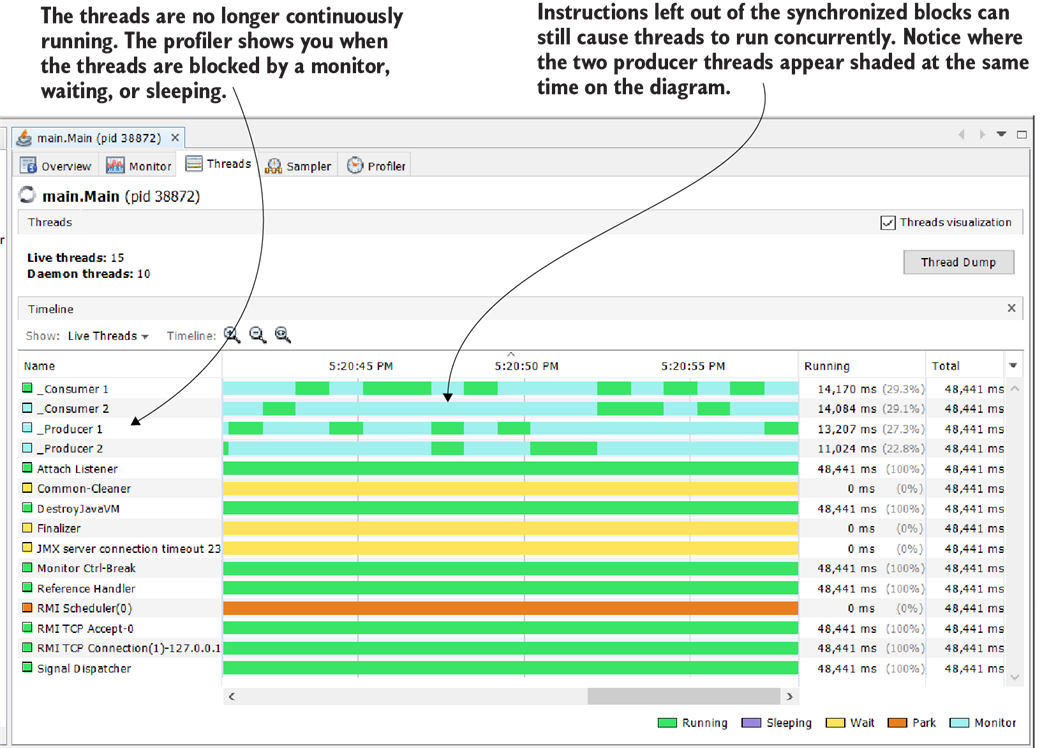
After correctly synchronizing the code, the resource consumption widgets look different. The CPU consumption is lower, and the app uses some memory.
The Threads tab helps you to visualize the execution of the threads in your app. Since the threads’ names start with an underline, you can simply sort them by name to see them grouped. Notice that their execution is interrupted from time to time by the monitor, which allows just one thread at a time through the synchronized blocks of code.
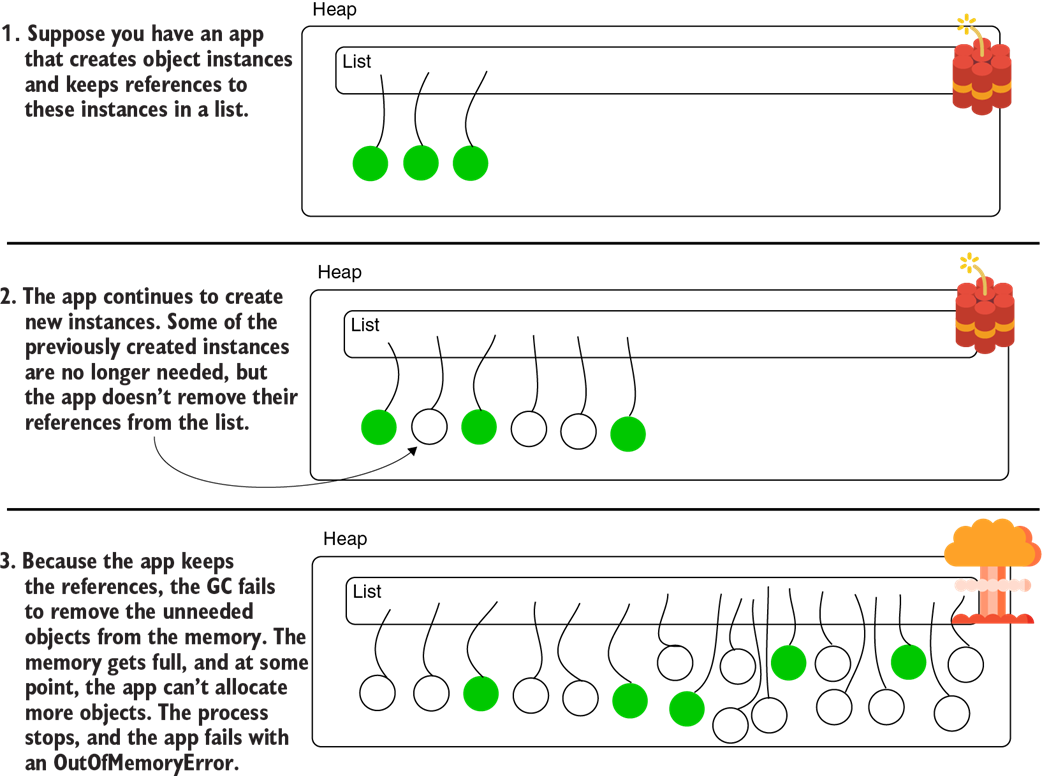
An OutOfMemoryError is like a ticking bomb. An app fails to remove references to objects it no longer uses. The GC can’t remove these instances from the memory because the app keeps their references. While more objects are created, the memory gets full. At some point, there’s no more space in the heap to allocate other objects, and the app fails with an OutOfMemoryError.
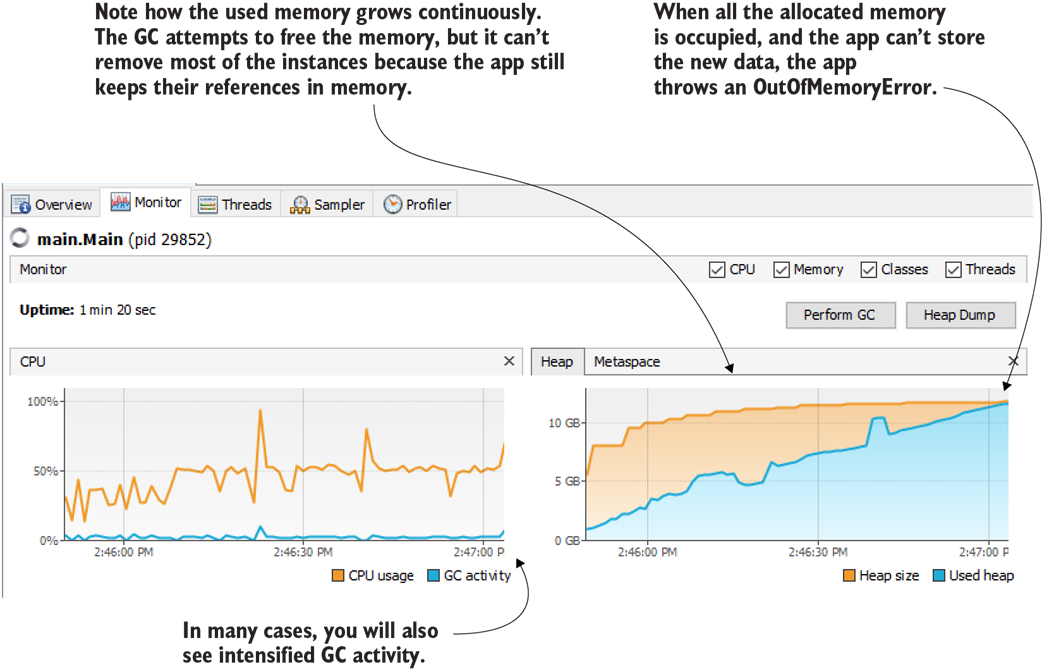
When a memory leak affects your app, the used memory grows continuously. GC attempts to free the memory but cannot remove enough data. The used memory increases until the app can’t allocate any more new data. At this point, the app throws an OutOfMemoryError and stops. In many cases, a memory leak also causes intensified GC activity, as seen in the CPU resource usage widget.
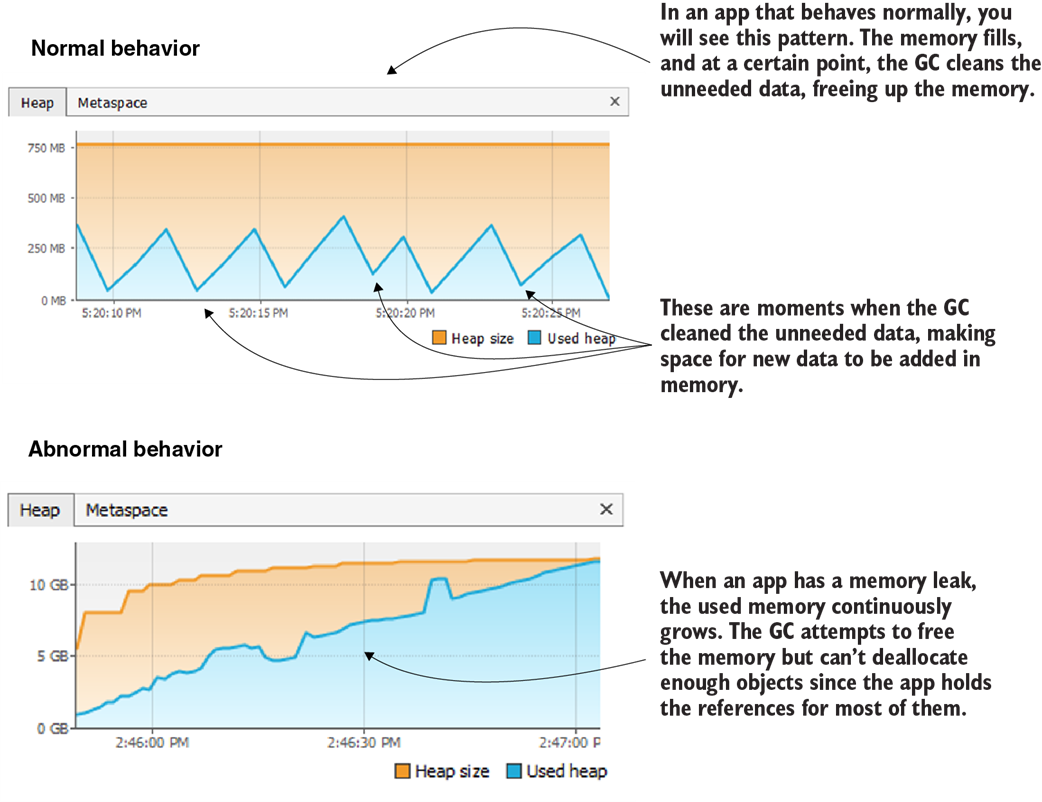
A comparison between the memory usage for a healthy app versus an app suffering from a memory leak. The GC frees unneeded data from memory for a healthy app, and the allocated space never fills up. An app with a memory leak prevents the GC from removing enough data. At some point, the memory fills up completely, generating an OutOfMemoryError.
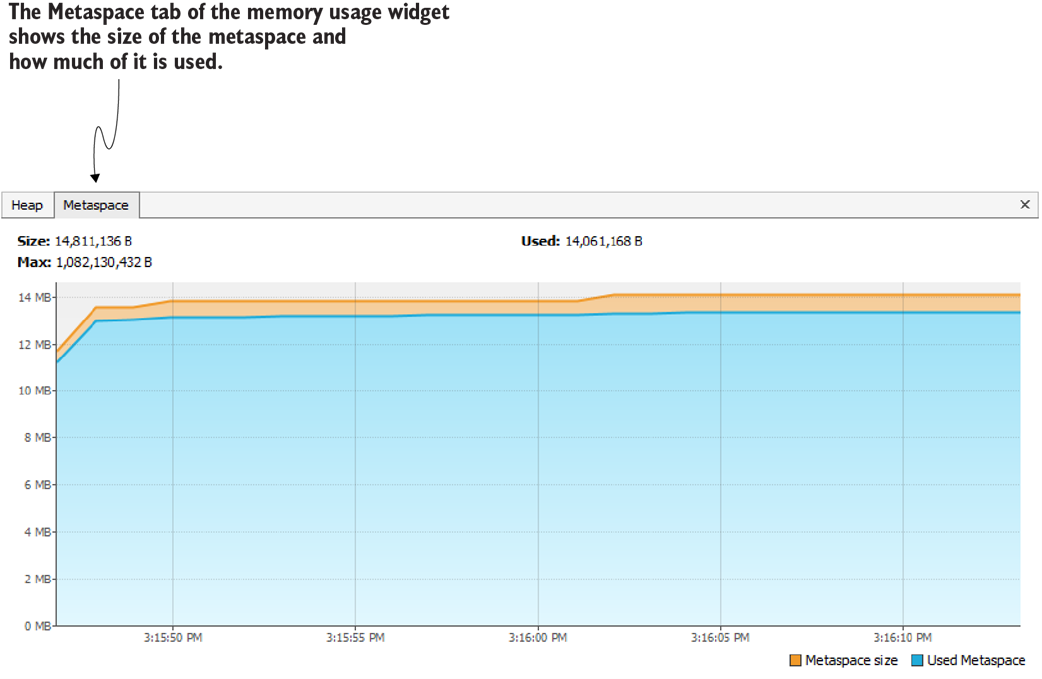
The metaspace is a part of the memory used to store class metadata. In particular cases, the metaspace can be overflowed. A VisualVM memory allocation widget also shows the usage of the metaspace.
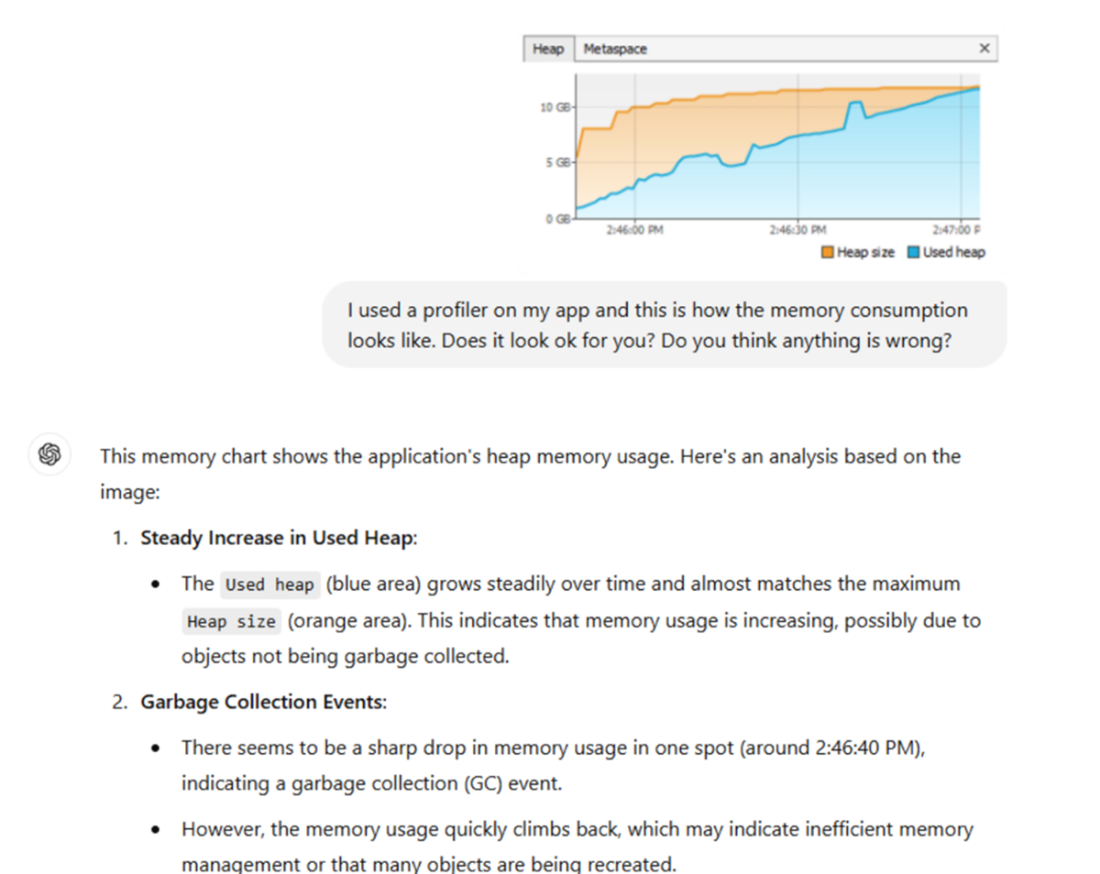
Consulting ChatGPT for insights on app execution profiling results. The AI assistant offers valuable suggestions for the next steps in your investigation and potential clues about the root cause of the issue (the answer in the image is truncated for brevity).
Summary
- A profiler is a tool that allows you to observe an app’s execution to identify the causes of certain problems that are more difficult to spot otherwise. A profiler shows you
- How an app spends system resources such as the CPU and memory
- What code executes and the duration of each method execution
- The execution stack of methods on different threads
- The executing threads and their status
- The profiler provides excellent visual widgets that help you to more quickly understand certain aspects.
- You can observe the GC’s execution using the profiler, which helps you to identify issues such as the app not correctly deallocating unused data from memory (memory leaks).
FAQ
What is a Java profiler and when should I use one?
A profiler attaches to a running JVM and surfaces live data about your app, including CPU and memory usage, threads and their states, and which code paths are executing (and how long they take). Use it to investigate resource consumption issues, concurrency problems (e.g., deadlocks or zombie threads), memory leaks, and general slowness or stalls.How do I install and configure VisualVM?
- Download VisualVM for your OS from https://visualvm.github.io/download.html- Edit etc/visualvm.config in the VisualVM folder and set visualvm_jdkhome to a JDK path (Java 8+), then uncomment the line.
- Start VisualVM from the bin folder. Your local Java processes should appear in the left panel; double-click one to begin profiling.
VisualVM can’t see or attach to my local Java process—what should I try?
- Start the target app with: -Djava.rmi.server.hostname=localhost- Verify the JDK you configured is supported by the VisualVM version you installed.
- Recheck how the process was started (e.g., security settings, container constraints) or try a different supported JVM distribution.
What profiler signals suggest thread-related issues like zombie threads?
- Monitor tab shows sustained high CPU usage while GC activity is near zero and memory usage barely changes.- Threads tab shows application threads stuck in a continuous running state, even though the app appears idle or unresponsive.
- Some runs may show threads dying with exceptions; other runs leave threads alive but doing no useful work. Take a thread dump to investigate further.
How can a profiler help me figure out which code is actually running?
Use the profiler’s sampling/profiling views to see hot methods and call stacks that are executing at runtime. This is invaluable in large or messy codebases where static reading is hard. Once you identify the active code path, switch to a debugger to step through the relevant logic.What is a memory leak, and how do I spot one in VisualVM?
A memory leak happens when your app retains references to objects it no longer needs, preventing GC from reclaiming them. In VisualVM’s memory graph, look for steadily rising used heap with only small or ineffective GC “valleys.” Over time this often ends with an OutOfMemoryError. Compare against a healthy pattern, which shows recurring peaks (allocations) followed by valleys (GC reclaiming space).Why doesn’t the OutOfMemoryError stack trace show the true leak source?
The heap is shared by all threads. The thread that triggers the final allocation may crash with OutOfMemoryError even if another thread caused the growth. Use a heap dump to find the real retaining references and leak roots; the stack trace alone is usually insufficient.How can I mitigate memory issues with JVM options, and what are their limits?
- Heap sizing: -Xms (initial) and -Xmx (max), e.g., -Xms512m -Xmx1g.- Metaspace sizing: -XX:MaxMetaspaceSize=100m.
These can buy time in production, but they do not fix leaks or misuse. The long-term solution is to remove the retaining references or refactor the offending logic (e.g., limit data loaded at once).
 Troubleshooting Java, Second Edition ebook for free