3 Finding problem root causes using advanced debugging techniques
This chapter expands beyond basic step-into/over/out navigation to show how modern debuggers can drastically reduce investigation time and help you reach root causes faster. It emphasizes using the right tool for the right scenario, balancing speed with accuracy, and being mindful of trade-offs and IDE differences. Through practical examples, it demonstrates when advanced techniques accelerate understanding and when they can mislead or slow you down, especially in complex or long-running flows.
The first set of techniques centers on conditional breakpoints and non-suspending (log-only) breakpoints. Conditional breakpoints pause execution only when a boolean condition is met, letting you jump straight to interesting states (for example, when a variable equals an unexpected value), though they can slow execution due to constant condition evaluation. Non-suspending breakpoints log values and stack traces without halting the program, giving you lightweight, code-free observability you can combine with conventional logging. The chapter also highlights tool support differences (some IDEs lack log-only breakpoints) and shows how AI assistants can suggest breakpoint placement or conditions and help analyze large logs—useful for speed—but advises relying on your own judgment rather than outsourcing reasoning to AI.
The second set of techniques enables you to shape the scenario mid-flight. Modifying in-memory variables while paused helps simulate hard-to-reproduce cases or avoid waiting on lengthy processes, with caveats around immutability (for example, final fields and records). The chapter then explains “dropping frames,” which rewinds one call-stack layer so you can re-run a method—distinct from stepping out, which fast-forwards to the caller after completion. This is powerful for rechecking a sequence but is not an undo: any external side effects (database writes, filesystem changes, messages sent, calls to other services) persist and can make repetitions diverge or fail. The guidance is to use these tools deliberately, repeat small blocks when safe, and remain alert to external effects that can invalidate a replayed path.

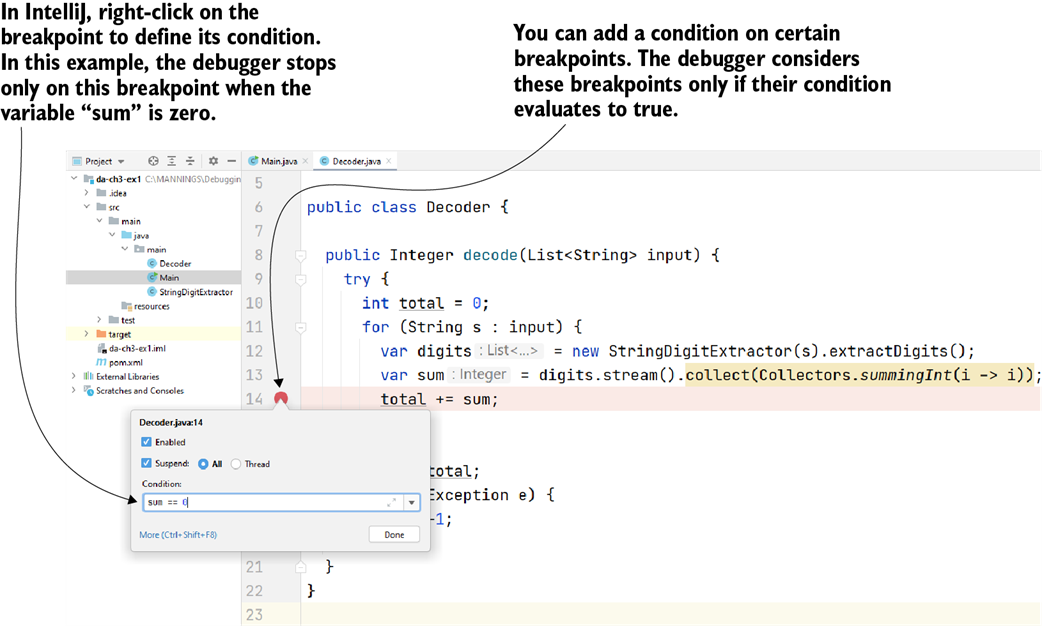
Using a conditional breakpoint to pause the execution just for specific cases. In this figure, we want to pause the execution on line 14 only if sum is zero. We can apply a condition on the breakpoint that instructs the debugger to consider that breakpoint only if the given state is true. This helps you more quickly get to a scenario you want to investigate.
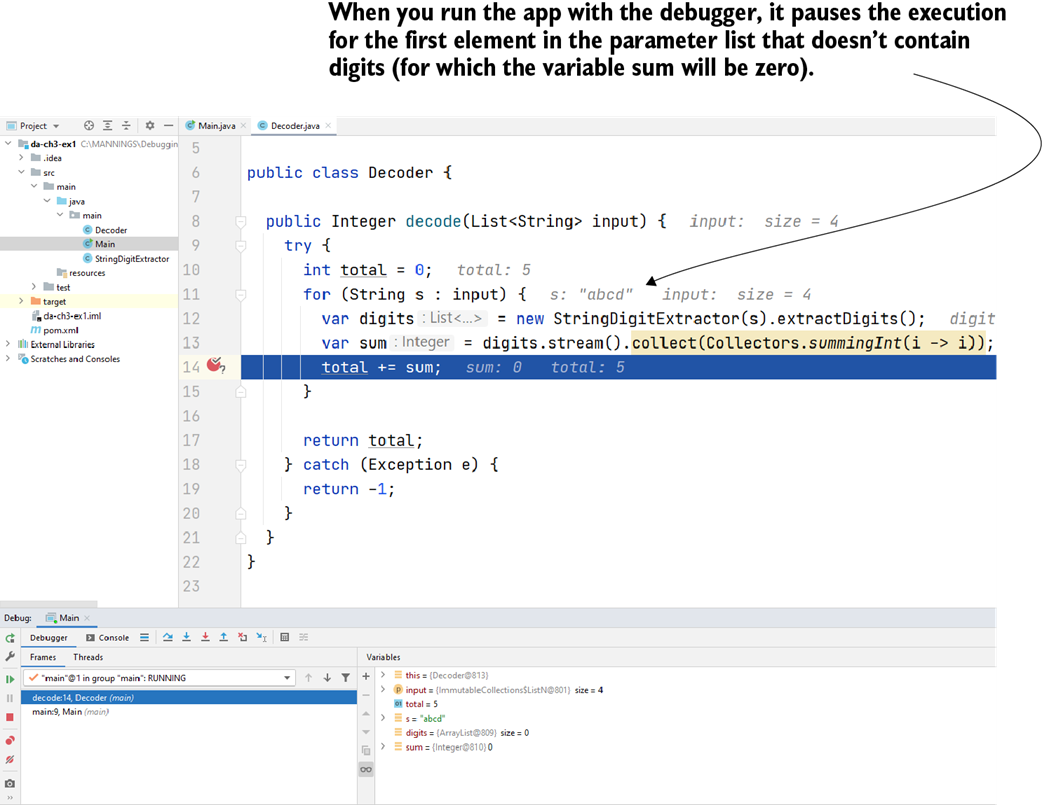
A conditional breakpoint. Line 14 in the figure was executed multiple times, but the debugger only paused the execution when the variable sum was zero. This way, we skipped over all the cases we were not interested in so that we can start with the conditions relevant to our investigation.
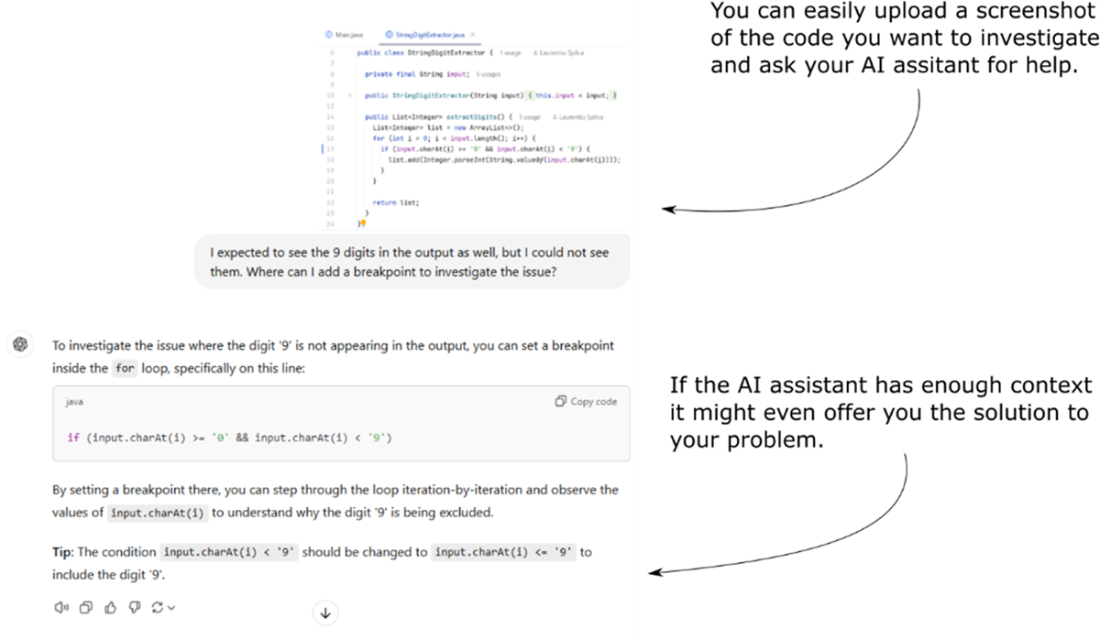
AI assistants like GitHub Copilot can help you better understand a code snippet or assist in selecting the appropriate troubleshooting technique. In this example, I asked Copilot for guidance on where to place breakpoints to easily identify the source of the issue in my code.
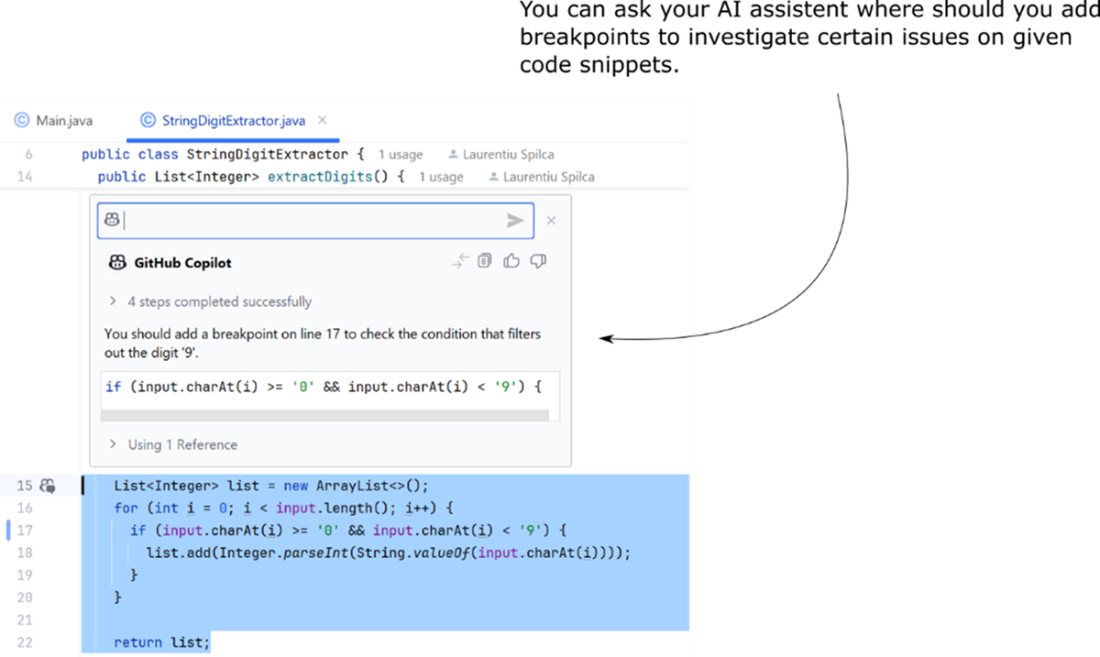
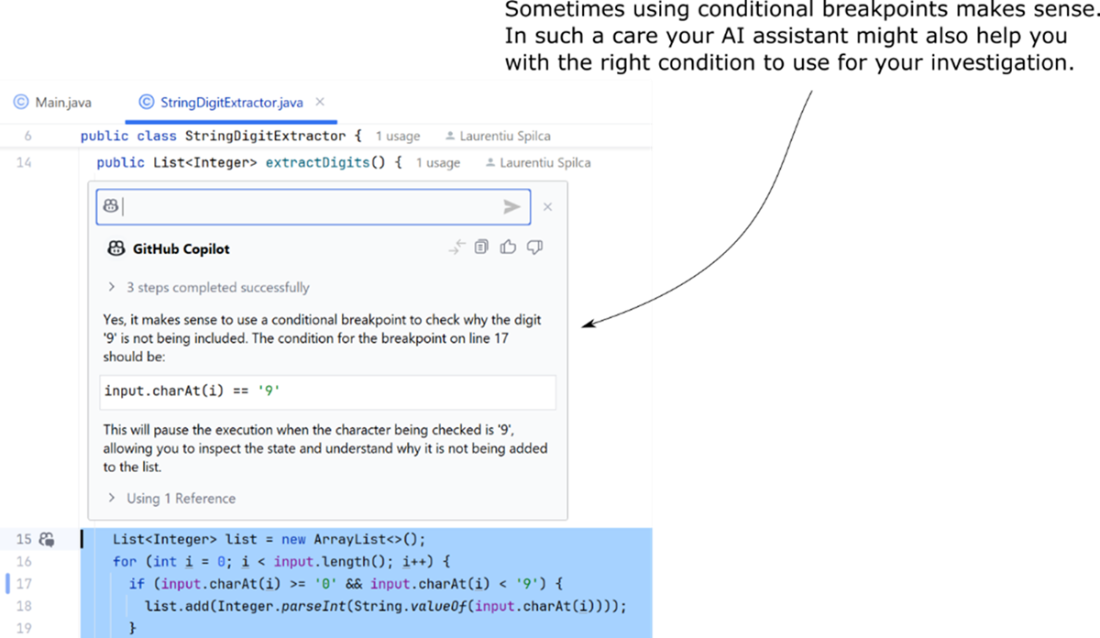
You can speed up your investigation by asking your AI assistant to suggest the lines of code for adding conditional breakpoints and the right condition to use for them.
Tools like ChatGPT, Gemini, or similar AI-powered chatbots can also assist with your code investigation. In some cases, if they have enough context, they may even provide a complete solution.

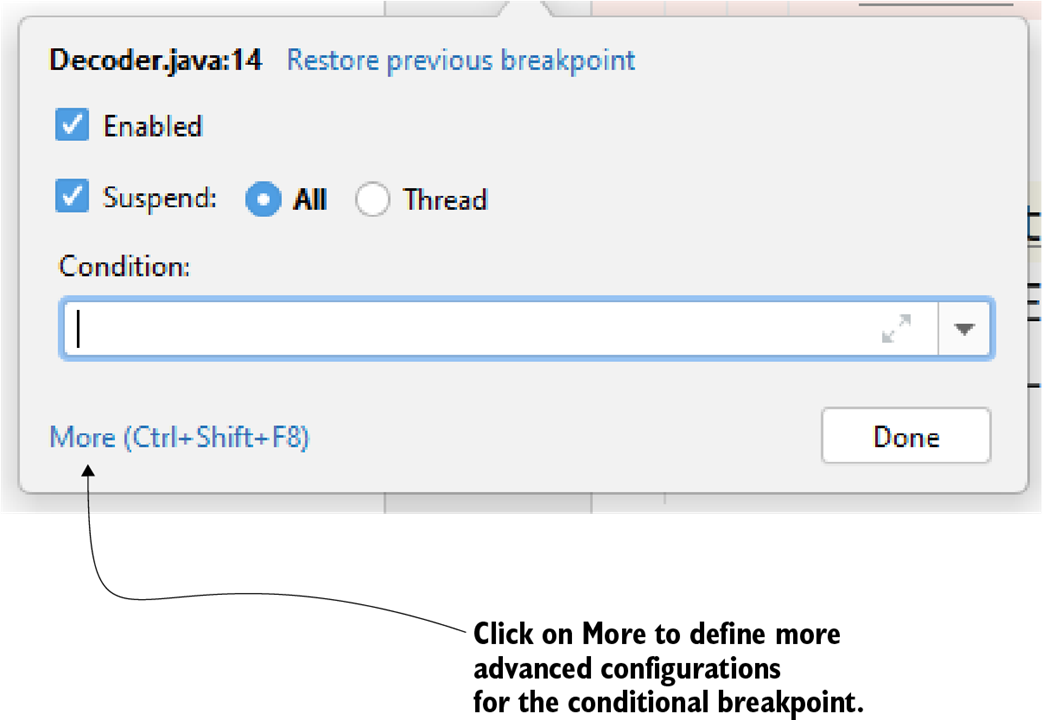
To apply advanced configuration on the breakpoint in IntelliJ, you can click the More button.
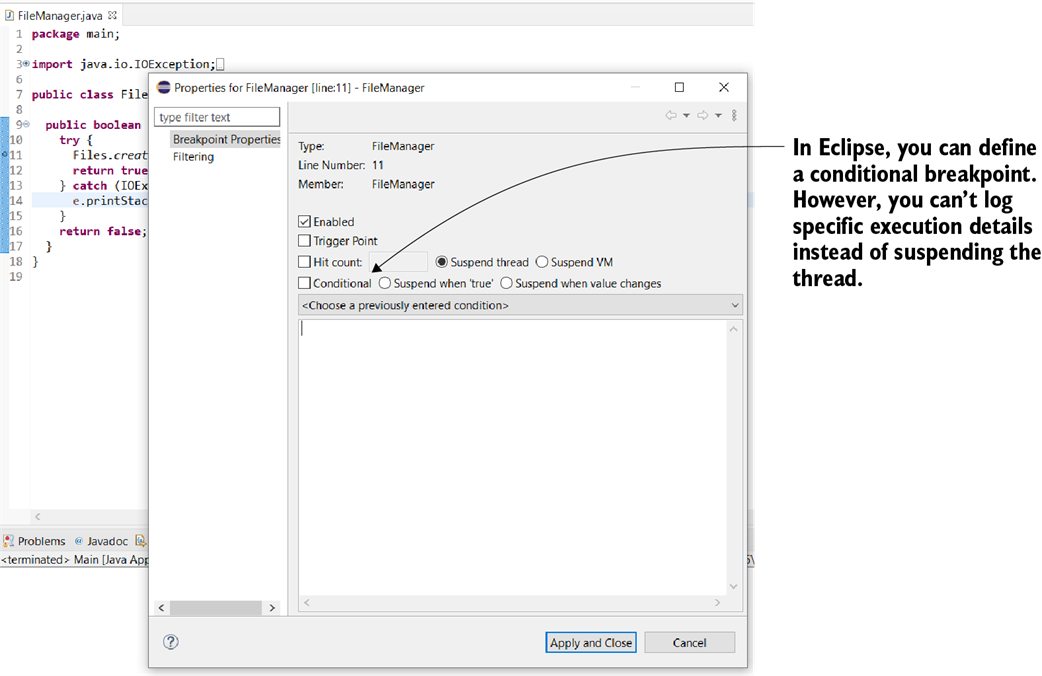
Not all IDEs offer the same debugging tools. All IDEs give you the basic operations, but some features, such as logging the execution details instead of pausing the execution, may be missing. In Eclipse, you can define conditional breakpoints, but you can’t use the logging feature.
Conditional breakpoint advanced configuration. In addition to specifying a condition for the breakpoint, you can instruct the debugger to not suspend the execution for the given breakpoint. Instead, you can simply log the data you need to understand your case.
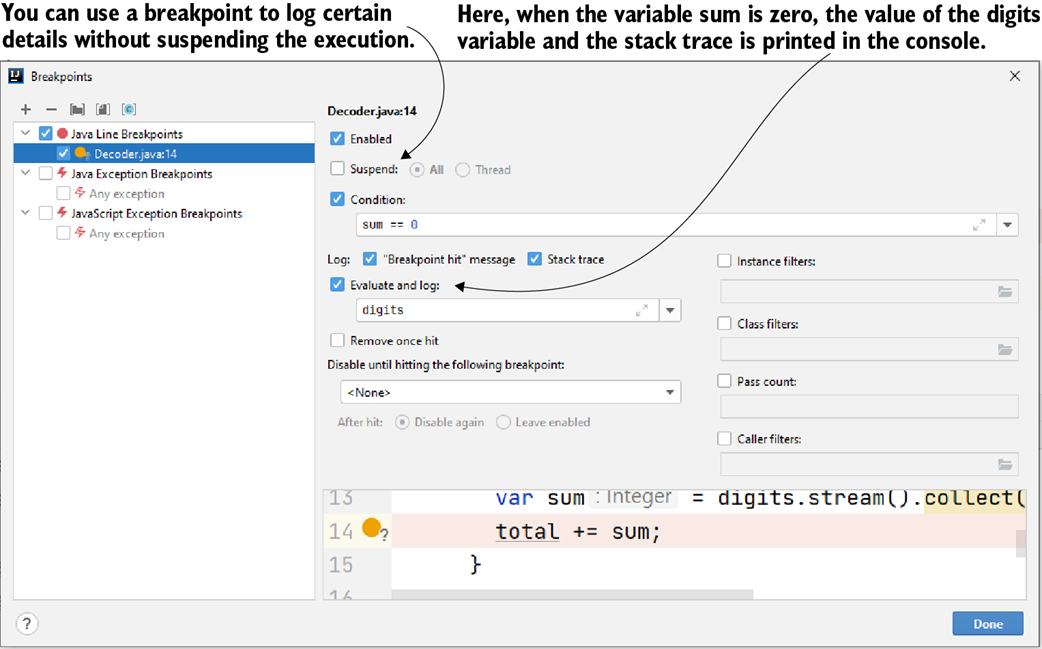
Using breakpoints without pausing the execution. Instead, the debugger logs a message when the line has been reached. The debugger also logs the value of the digits variable and the execution stack trace.
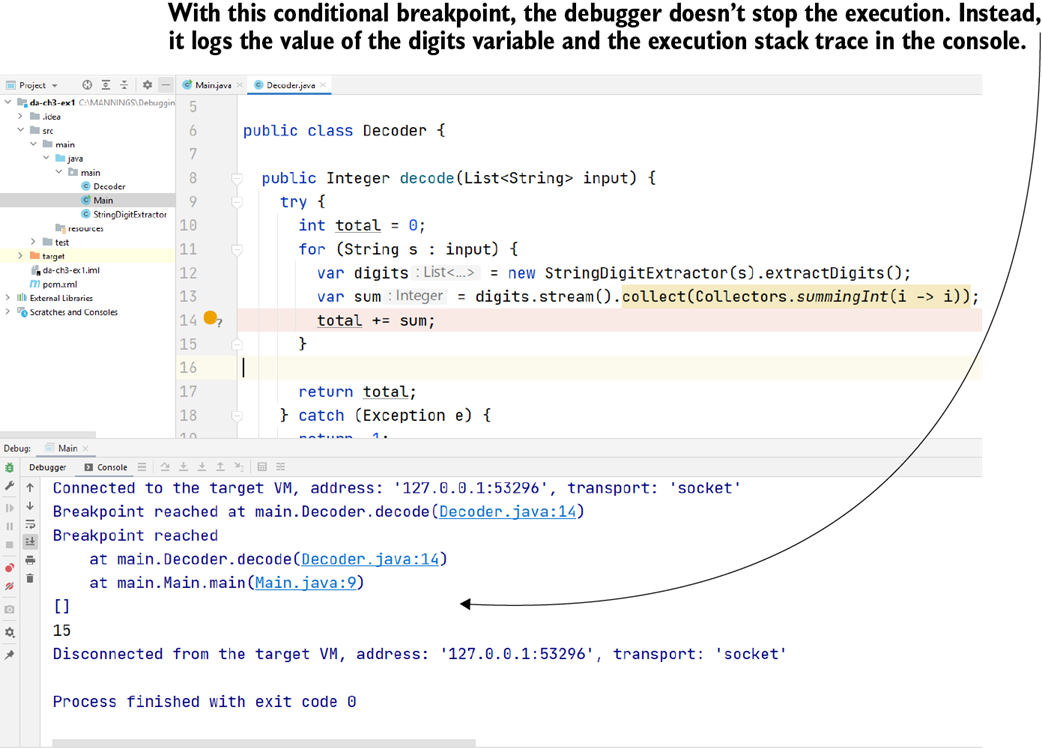
Usually, when investigating issues in a long-running process, using breakpoints is not really an option. It can take a long time for the execution to reach the part of code you are investigating, and if you have to rerun the process several times, you will definitely spend too much time on it.

Setting a new value in a variable in scope. The debugger shows you the values for the variables in scope when it pauses the execution on a given line. You can also change the values to create a new investigation case. In some cases, this approach can help you to validate your suspicions about what the code does.
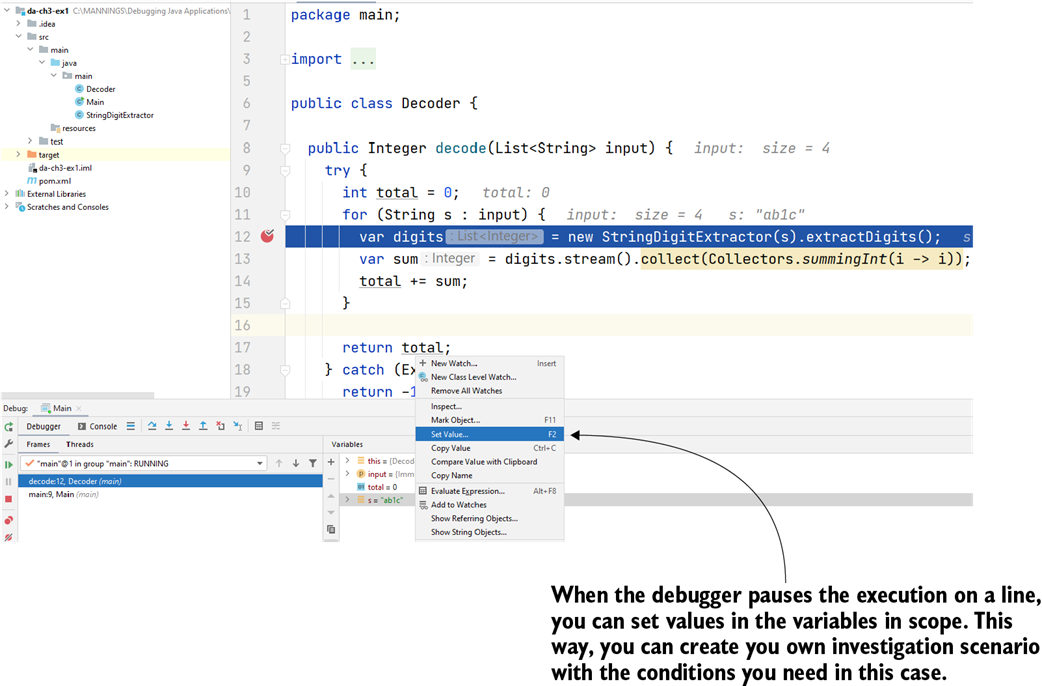
Change the variable's value to observe how the app’s execution behaves in different conditions.
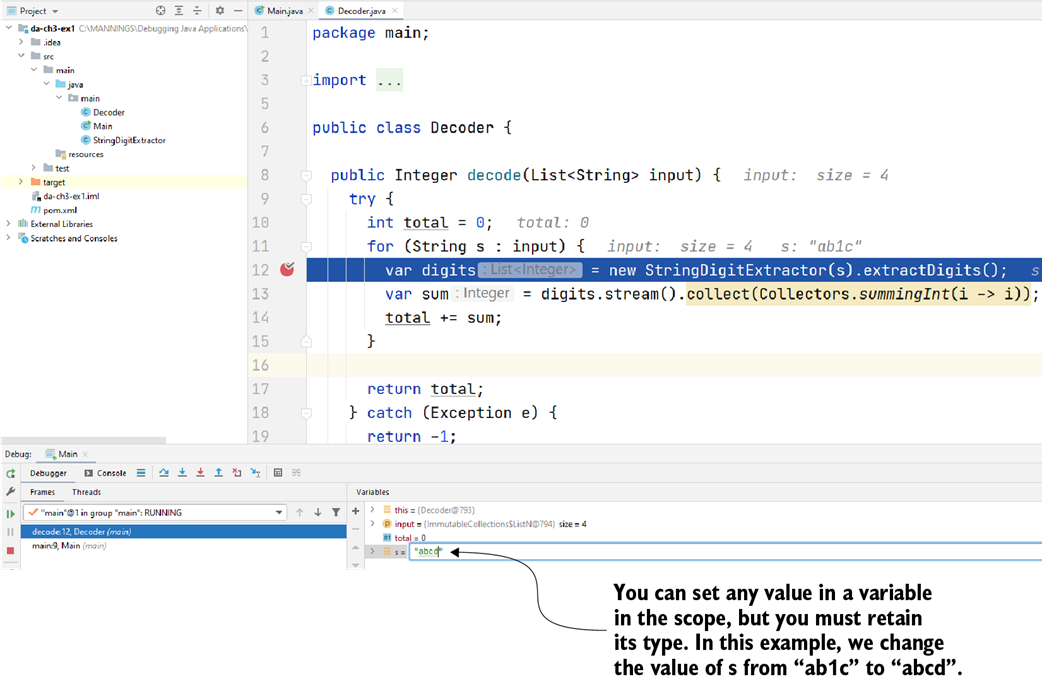
When using the step over operation, the app uses the new value you set to the s variable. extractDigits() returns an empty list because string "abcd" doesn’t contain digits. Setting values in variables on the fly allows you to test different scenarios even if you don’t have the input data you need.
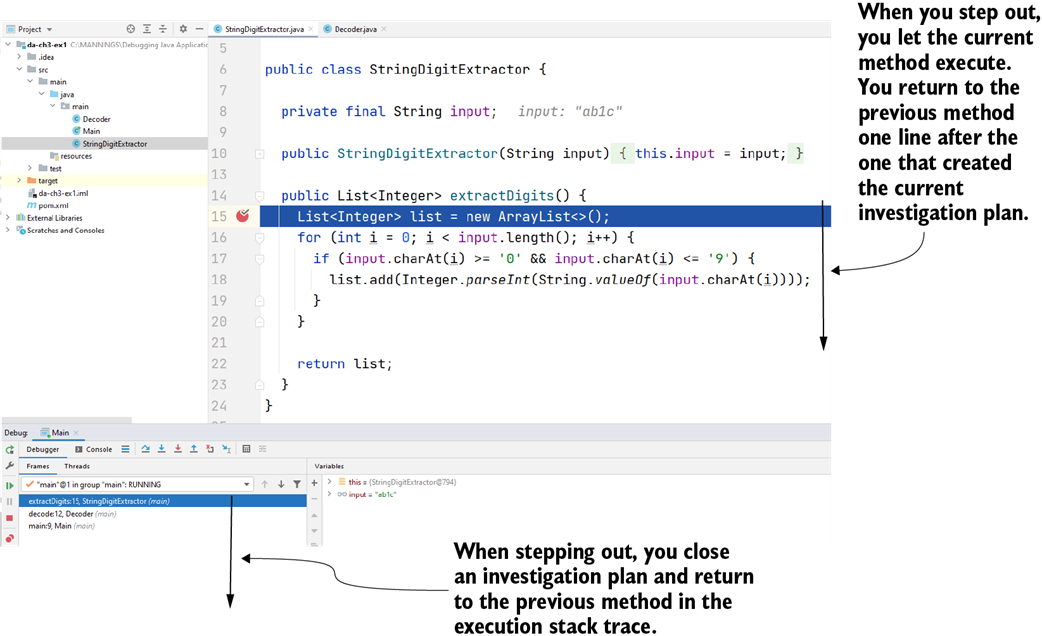
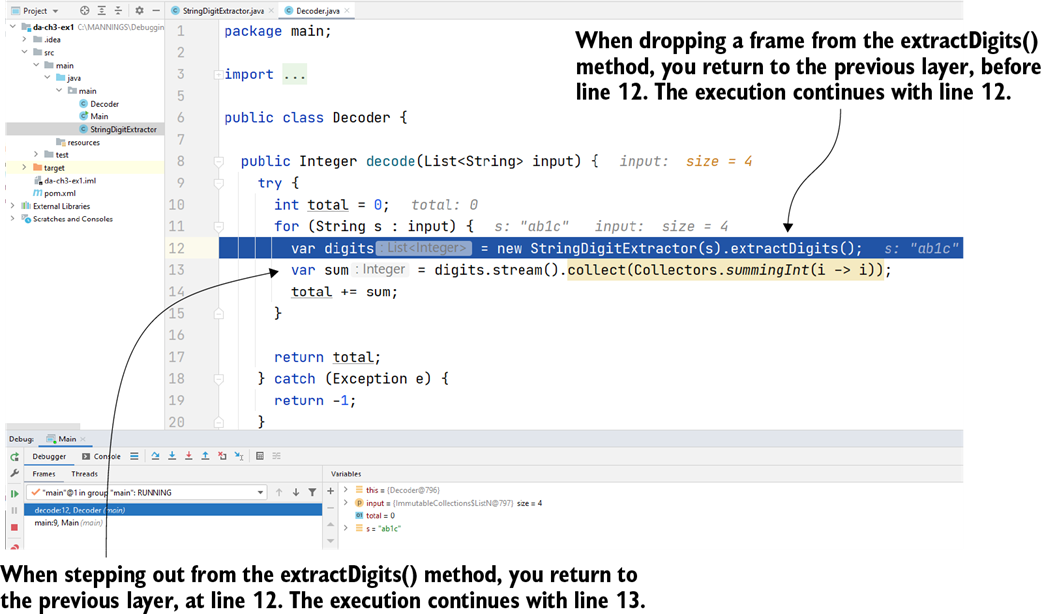
Stepping out closes the current investigation plan by executing the method and then pausing the execution right after the method call. This operation allows you to continue the execution and return one layer in the execution stack.
When you drop a frame, you return to the previous layer in the execution stack trace before the method call. This way, you can replay the method execution either by stepping into it again or stepping over it.
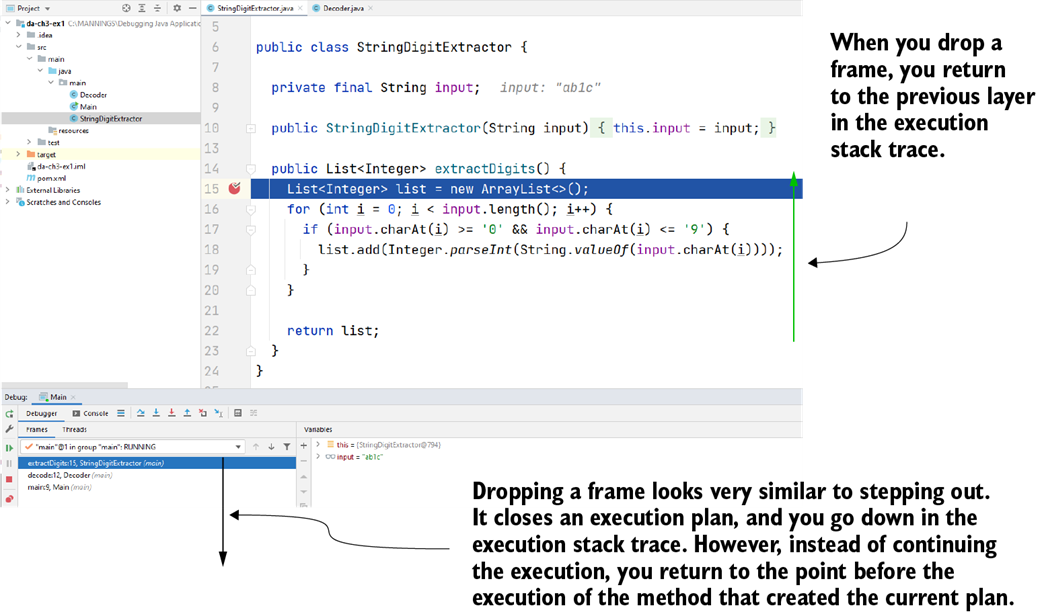
Dropping a frame versus stepping out. When you drop a frame, you return to the line before the method’s execution. When you step out, you continue the execution but close the current investigation plan (represented by the current layer in the execution stack).
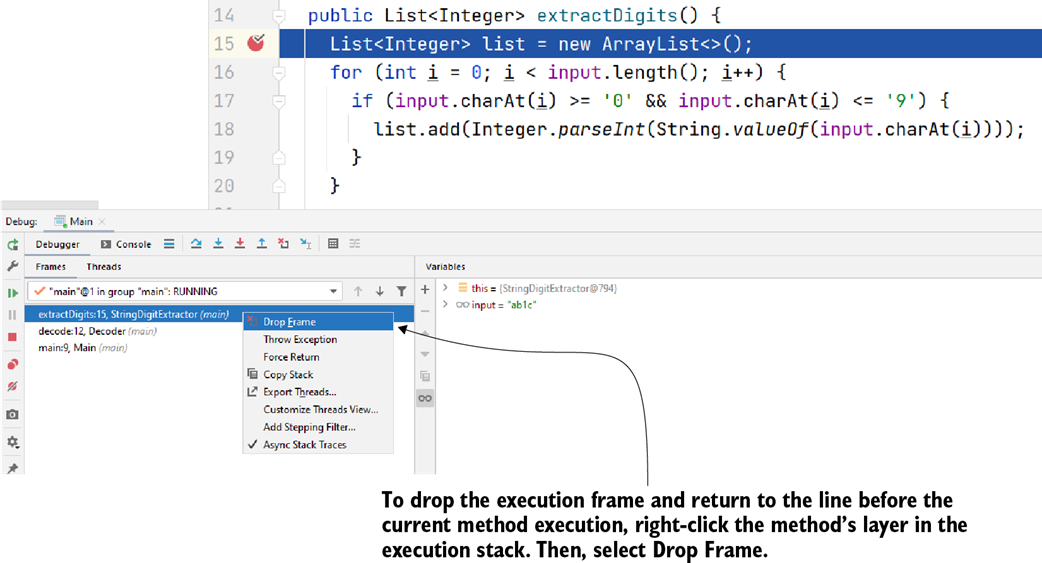
When using IntelliJ IDEA, you can drop a frame by right-clicking the method’s layer in the execution stack trace and then selecting Drop Frame.
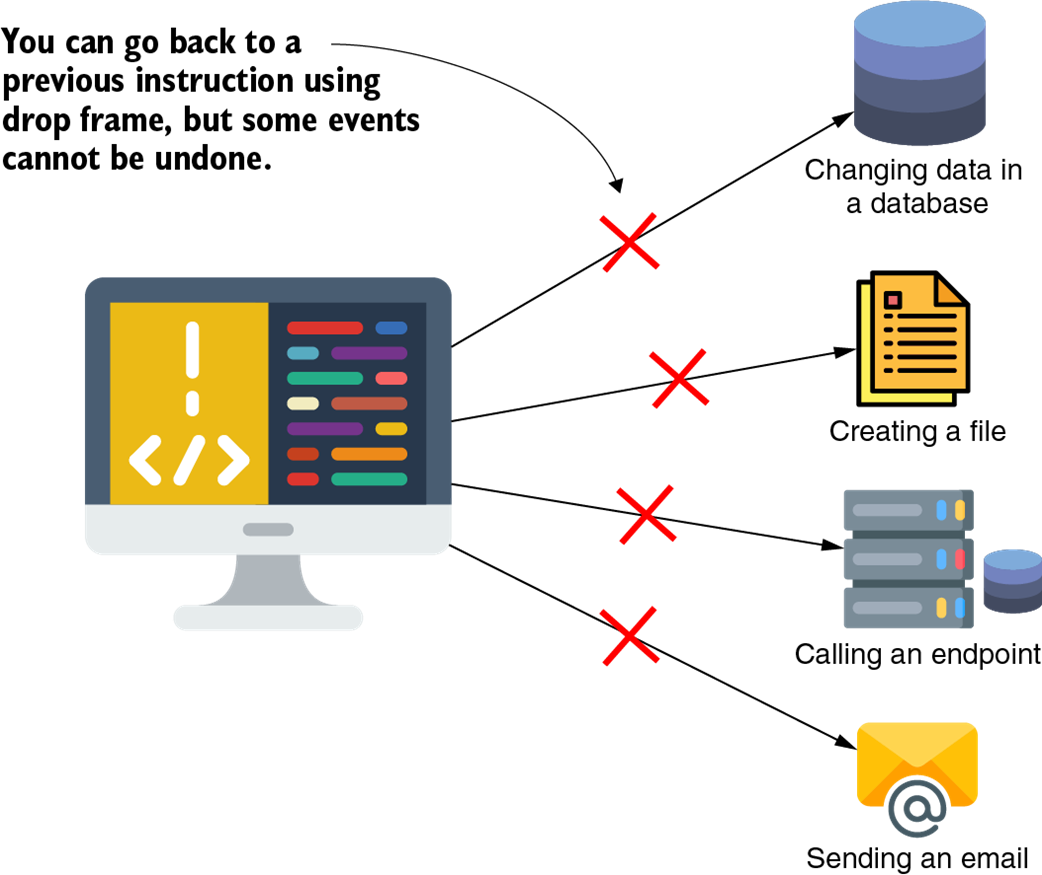
Using the drop frame operation can result in some events that can’t be undone. Examples include changing data in the database, changing data in the filesystem, calling another app, or sending an email message.
Summary
- A conditional breakpoint is a breakpoint associated with a Boolean condition. The debugger pauses the execution only if the provided condition is true—that is, only when particular conditions apply. This way, you save the time of navigating through code until you get to the desired point to begin your investigation.
- You can use breakpoints to log the values of certain variables in the console that don’t suspend the app’s execution. This approach is quite helpful because you can add log messages without changing the code.
- Moreover, you can use AI assistants to analyze large amounts of log messages to discover anomalies and guide your next steps in the troubleshooting process.
- When the debugger pauses the execution on specific lines of code, you can alter the data on the fly to create custom scenarios according to what you want to investigate. This way, you don’t have to wait until the execution gets to a conditional breakpoint. In some cases, when you don’t have an appropriate environment, changing data while debugging saves you time you would have needed to prepare the data in the environment.
- Changing variables’ values to create a custom investigation scenario can be an efficient technique when trying to understand just a piece of the logic of a long-running process or when you don’t have the desired data in the environment where you run the app. However, changing more than one or two variable values at a time may add considerable complexity and make your investigation more challenging.
- You can step out of an investigation plan and return to the point before the method was called. This is called dropping a frame, but it can sometimes introduce an unwanted side effect. If the app changed anything externally (e.g., committed a transaction and changed some database records, changed a file in the filesystem, or made a RESTful call to another app), returning to a previous execution step won’t undo these changes.
 Troubleshooting Java, Second Edition ebook for free