2 Understanding your app’s logic through debugging techniques
This chapter explains how to use debugging to truly understand what your Java application does at runtime. Reading code is not linear like reading prose; you hop across methods and abstractions, which increases cognitive load and invites wrong assumptions. A debugger acts like a map that anchors you in the execution, letting you observe real data and control flow instead of guessing. All major IDEs provide equivalent capabilities, and the text also shows how AI assistants can complement your reasoning by offering summaries, surfacing assumptions, and helping you form and test hypotheses faster—provided you supply the necessary context.
Practically, you begin by reading the code and only then place breakpoints on the first lines you don’t fully understand, avoiding unnecessary pauses on obvious statements. When execution stops, you use two key views: variables in scope to see the current data state, and the execution stack trace as a breadcrumb trail showing how you arrived there. Navigation revolves around three core actions—step over, step into, and step out—with a strong bias toward stepping over to keep “investigation plans” (mental and stack-depth) to a minimum. You step into only when outputs don’t suffice to infer behavior, and step out to return quickly. The stack trace is crucial for revealing hidden framework behaviors (for example, aspects/interceptors that change parameters or alter the call chain), and you must remember that the “next execution line” can skip due to exceptions or control flow.
The chapter also clarifies when a debugger isn’t the right tool or isn’t enough: when the faulty output’s origin is unknown, in performance slowdowns and freezes, after crashes (no live process to attach), with multithreaded code affected by observation timing, and in time-sensitive paths like expiring tokens or timers. In these cases, you combine logging, profiling, thread/heap dumps, mocking and stubbing, or simulation to avoid distorting behavior. AI tools—especially those integrated in the IDE—can analyze snippets, variables, and stack traces or screenshots to spot inconsistencies and reduce noise (for example, focusing on relevant variables), but they may rely on assumptions you must validate. The overall method is disciplined: read first, break where unclear, navigate deliberately, use the stack trace as your map, and augment with profiling, diagnostics, and AI when appropriate.


When reading a piece of code, you often need to figure out what happens behind the scenes in some of the instructions composing that logic. The method names are not always suggestive enough, and you can’t totally rely on them. Instead, you need to go deeper into what these methods do.

Compare how you read poetry with how you read code. You read poetry line by line, but when you read code, you jump around.

Reading code is different from reading poetry and is much more complex. You can imagine reading code as reading in two dimensions. One dimension is reading a piece of code top to bottom. The second dimension is going into a specific instruction to understand it in detail. Trying to remember how things work for each plan and how it assembles makes understanding code just by reading it very difficult.
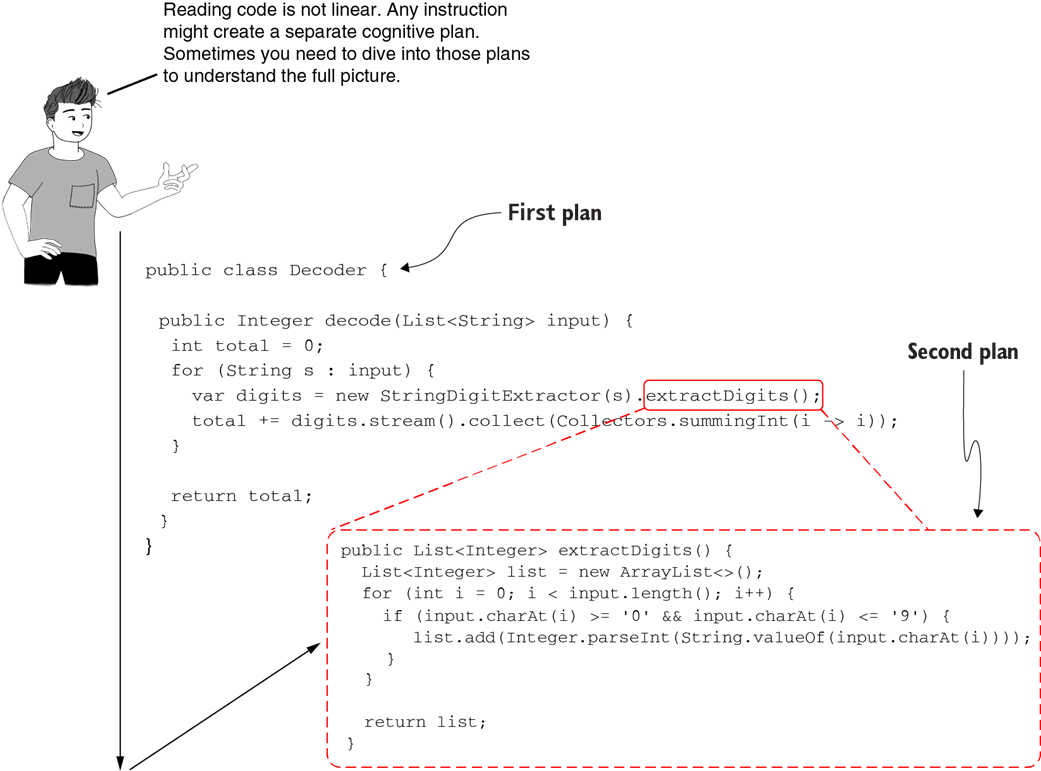


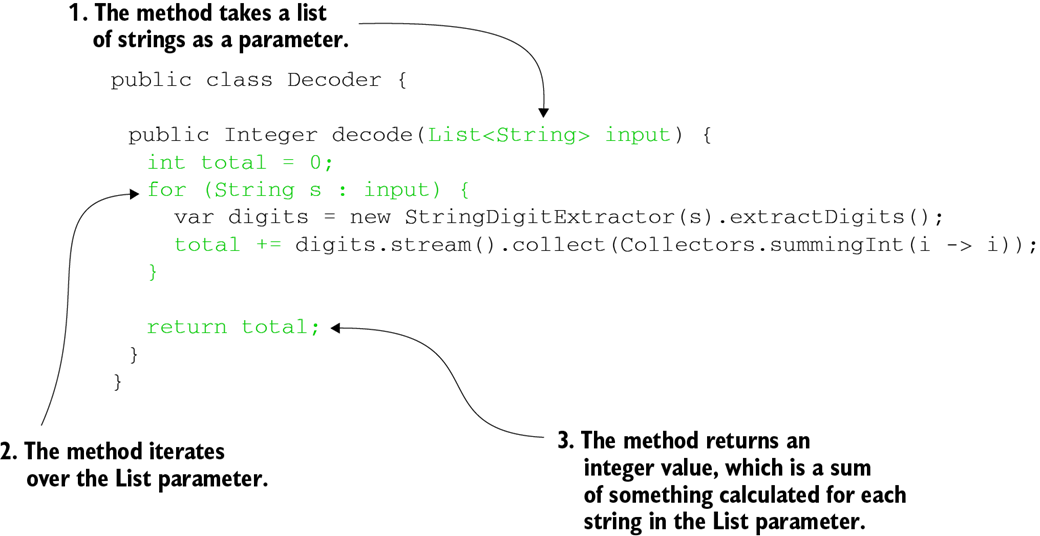
Assuming you know the language fundamentals, you can easily see that this code takes a collection as an input and parses the collection to calculate an integer.

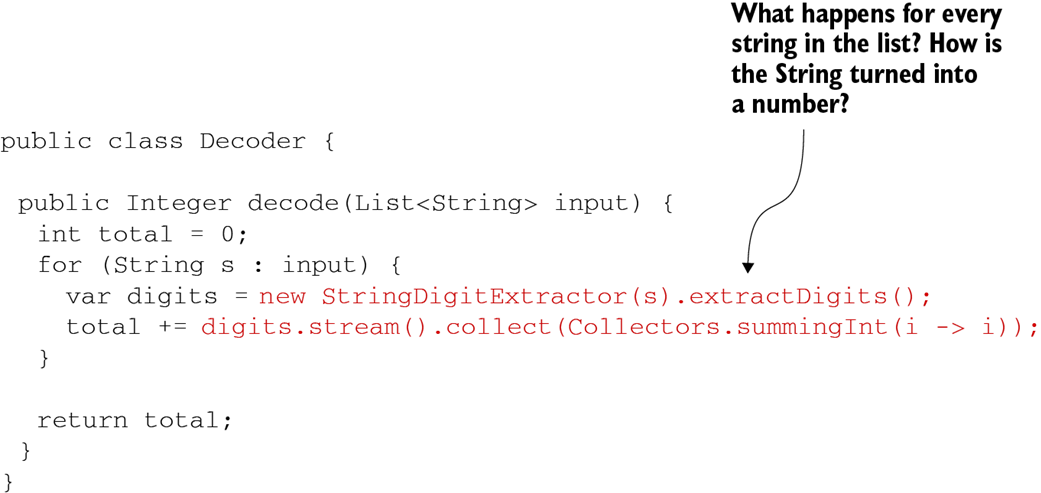
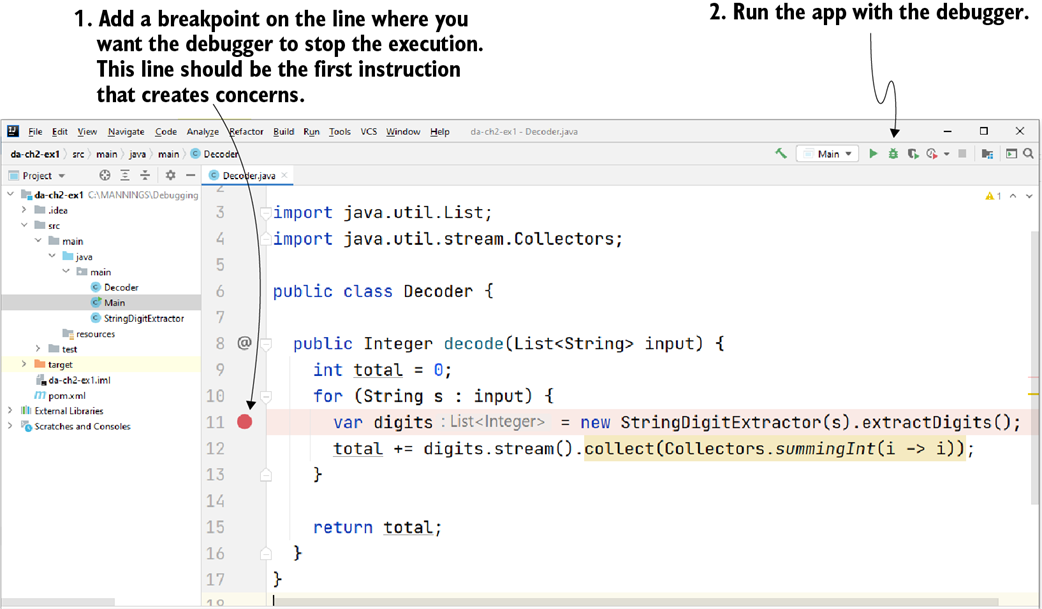
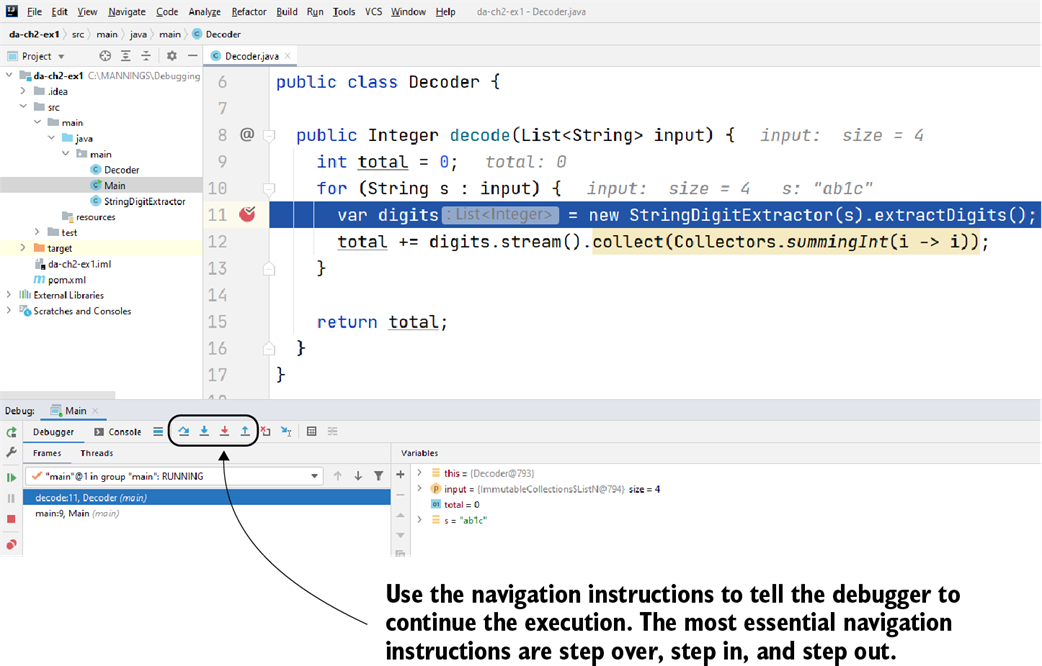
In this piece of code, I shaded the lines of code that are more difficult to understand. When you use a debugger, add the first breakpoint on the first line that makes the code more challenging to understand.
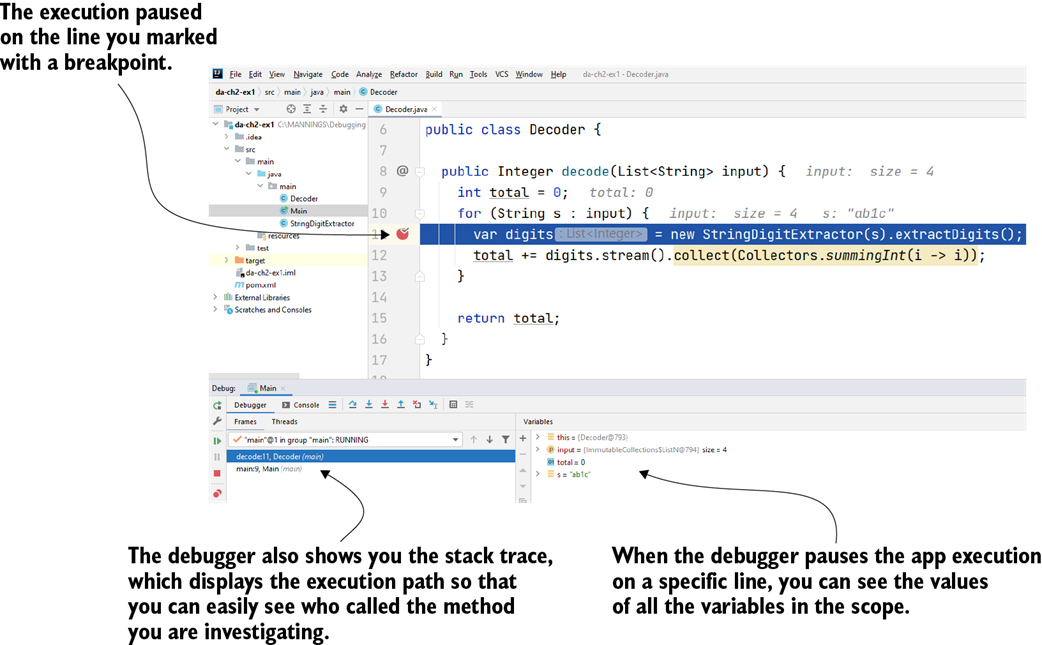
Click near the line number to add a breakpoint on a specific line. The area where the IDE displays the breakpoint is also named the “gutter”. Then, run the app with the debugger. The execution pauses on the line you marked with a breakpoint and allows you to control it manually.

When the execution is paused on a given line of code, you can see all the variables in scope and their values. You can also use the execution stack trace to remember where you are as you navigate through the lines of code.
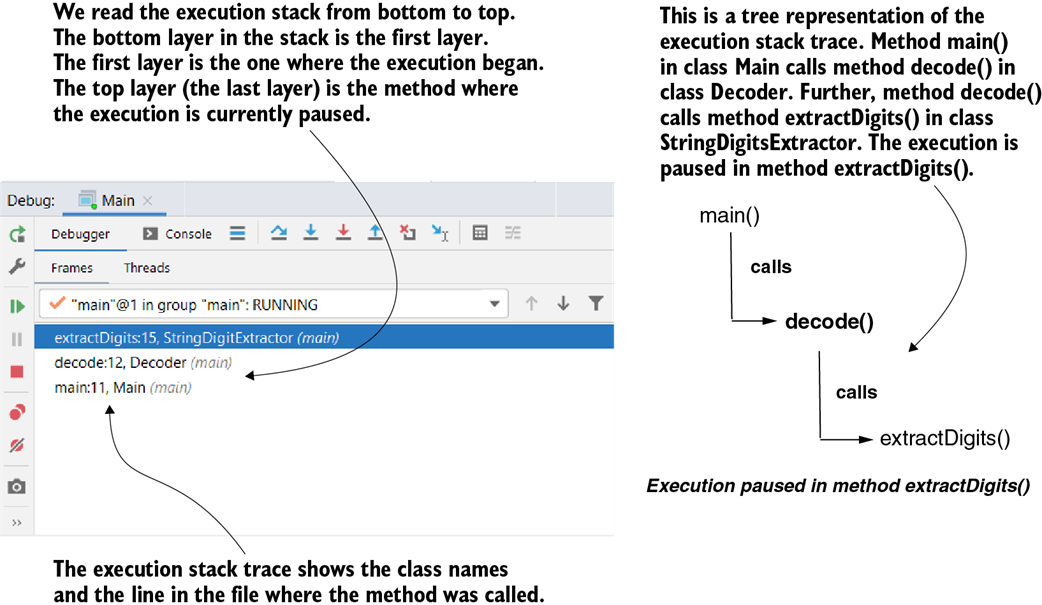
The top layer of the execution stack trace is where the debugger paused the execution. All other layers in the execution stack trace are where the methods represented by the above layers were called. The bottom layer of the stack trace (the first layer) is where the execution of the current thread began.
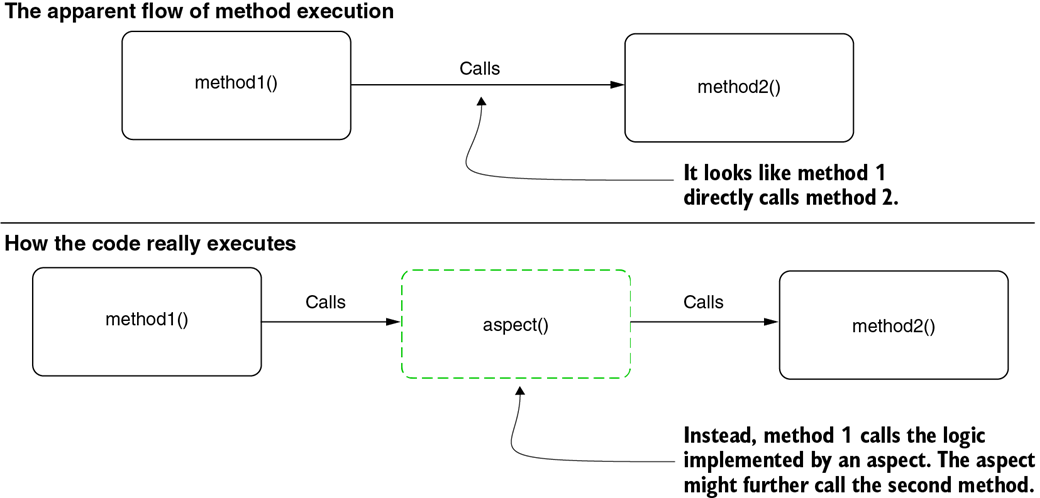
An aspect logic is completely decoupled from the code. For this reason, when reading the code, it is difficult to see that there’s more logic that will execute. Such cases of hidden logic executing can be confusing when investigating a certain capability.
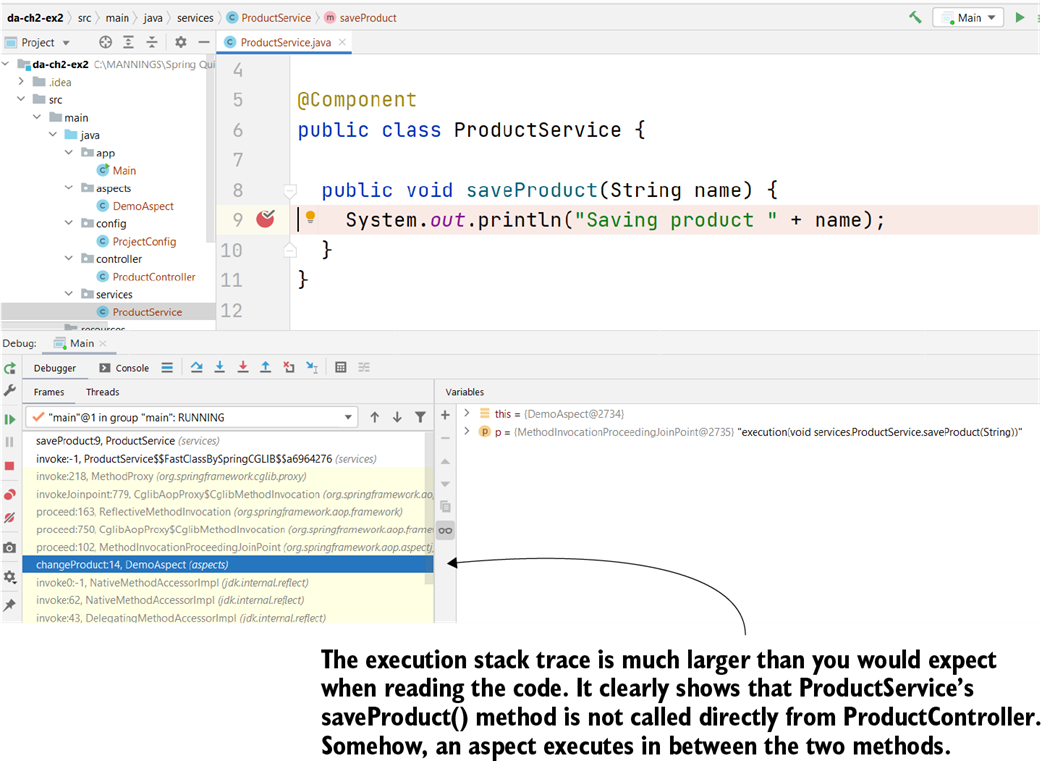
Method main() calls saveProduct() of bean ProductController, sending the value "Beer" as the parameter value. The ProductController’s saveProduct() method calls the ProductService bean, sending the same parameter value as the one it receives. The Product-Service bean prints the parameter value in the console. The expectation is that "Beer" will be printed in the console.

The execution stack trace shows that an aspect has altered the execution. This aspect is the reason that the value of the parameter changes. Without using the stack trace, finding why the app has a different behavior than expected would be more difficult.
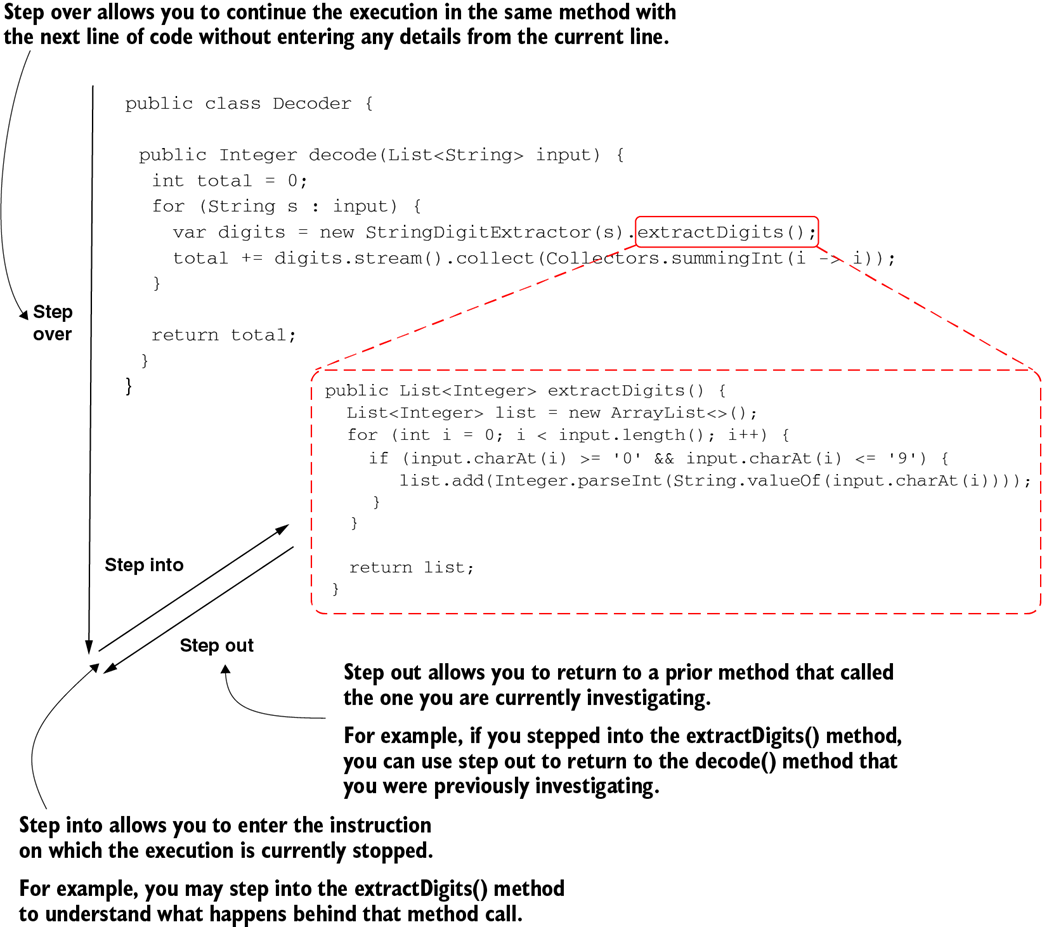
The navigation operations help you “walk” through the app logic in a controlled way to identify how the code works. To navigate through code, you can use the buttons on the IDE’s GUI or use the keyboard shortcuts associated with these operations.

Navigation operations. Stepping over allows you to go to the next instruction in the same method. When you want to start a new investigation plan and go into detail in a specific instruction, you can use the step into operation. You can go back to the previous investigation plan with the step out operation.
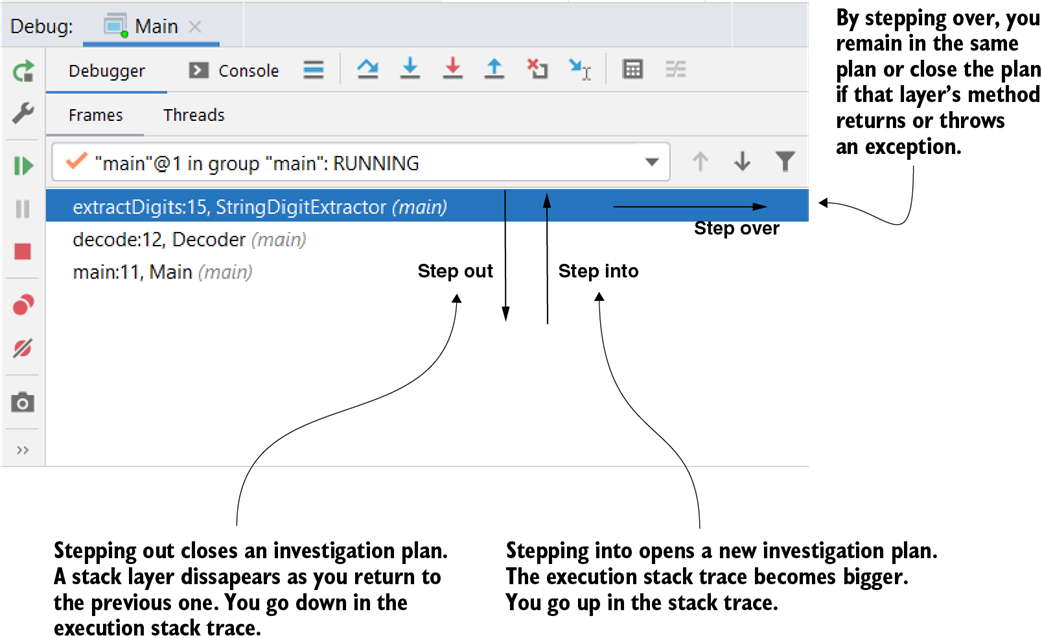
The navigation operation as seen from the execution stack trace point of view. When you step out, you go down in the stack trace and close an investigation plan. When you step into, you open a new investigation plan, so you go up in the stack trace and it becomes bigger. When stepping over, you remain in the same investigation plan. If the method ends (returns or throws an exception), stepping over closes the investigation plan, and you go down in the stack trace just as you did when you stepped out.
The movie Inception (2010) portrays the idea of dreaming in a dream. The more layers deep you dream, the longer you stay there. You can compare this idea with stepping into a method and opening a new investigation layer. The deeper you step in, the more time you’ll spend investigating the code.
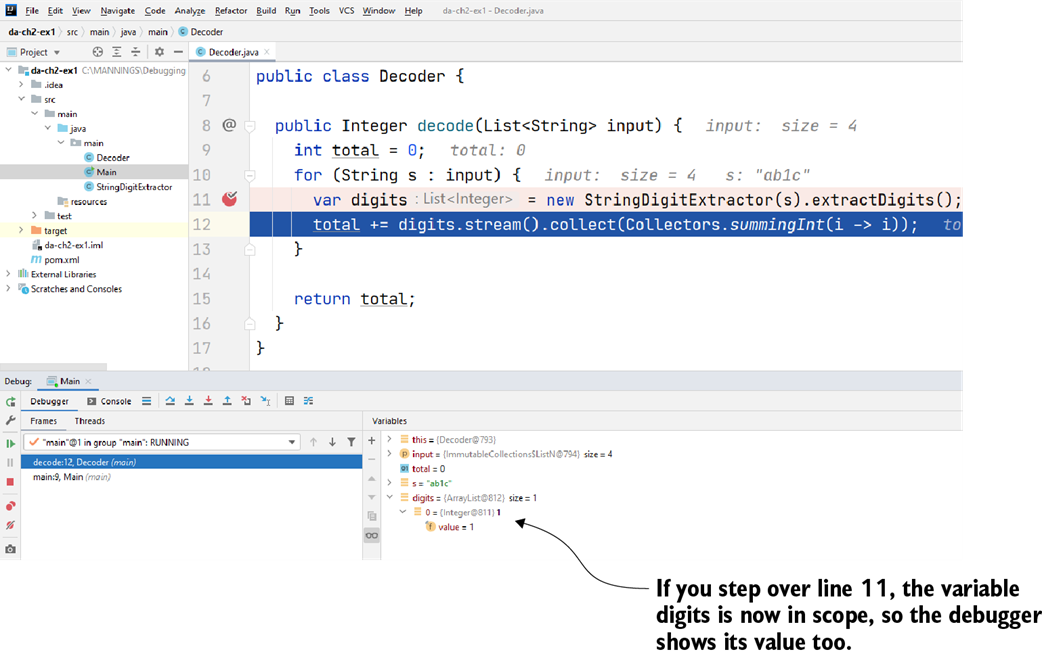
When you step over a line, the execution continues in the same method. In our case, the execution paused on line 12, and you can see the value of the digits variable that was initialized by line 11. You can use this value to deduce what line 11 does without having to go into more detail.
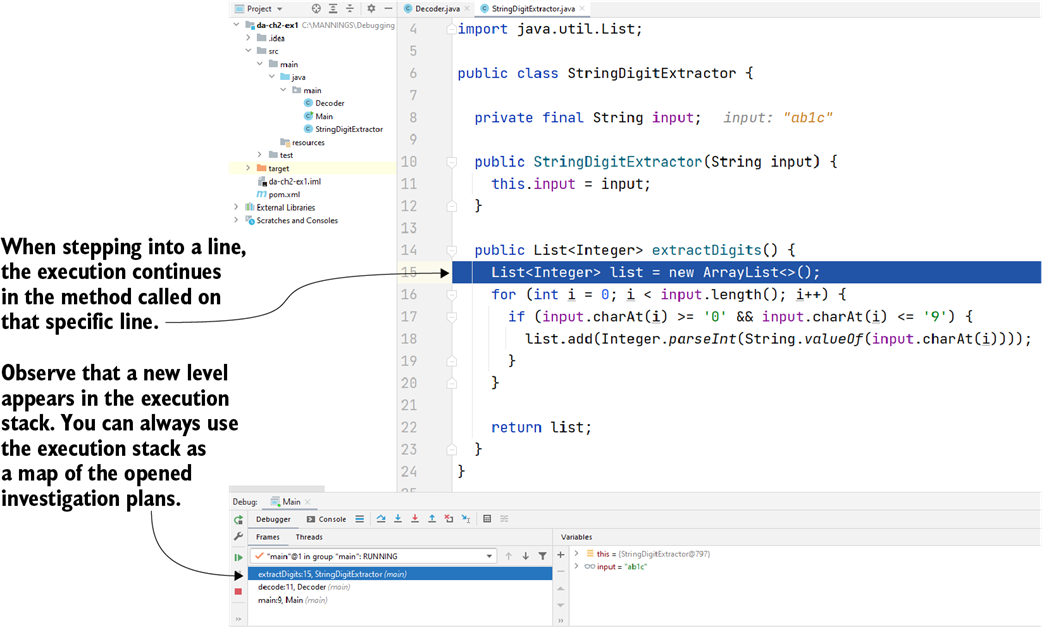
Stepping into allows you to observe the entire execution of the current instruction. This opens a new investigation plan, allowing you to parse the logic behind that particular instruction. You can use the execution stack trace to retrace the execution flow.

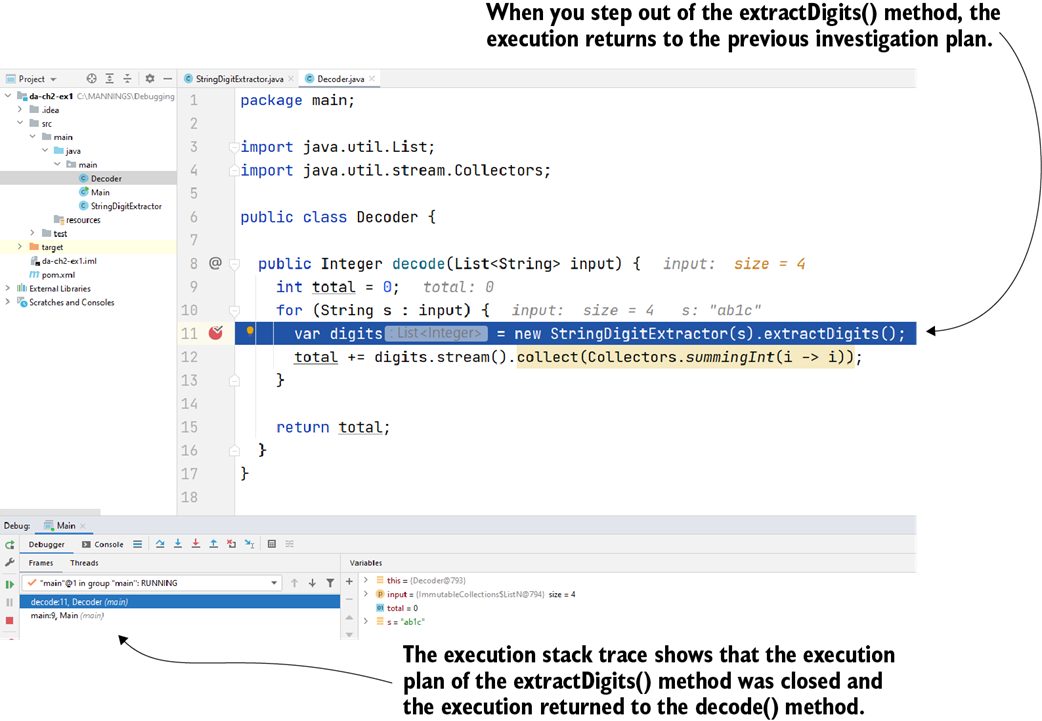
The step out operation allows you to close an investigation plan and return to the previous one in the execution stack trace. Using step out is helpful to save time since you don’t have to step over each instruction until the current execution plan closes by itself. Stepping out offers you a shortcut to return to the previous execution plan you were investigating.

Summary
- Every time you open a new piece of logic (e.g., entering a new method that defines its own logic), you open a new investigation plan.
- Unlike a text paragraph, reading code is not linear. Each instruction might create a new plan you need to investigate. The more complex the logic you explore, the more plans you need to open. The more plans you open, the more complex the process becomes. One trick to speeding up a code investigation process is to open as few plans as possible.
- A debugger is a tool that allows you to pause the app’s execution on a specific line so that you can observe the app’s execution, step by step, and the way it manages data. Using a debugger can help you to reduce some of the cognitive load of reading code.
- You can use breakpoints to mark the specific lines of code where you want the debugger to pause an app's execution so you can evaluate the values of all the variables in the scope.
- You can step over a line, which means continuing to the next execution line in the same plan, or step into a line, which means going into detail on the instruction on which the debugger paused the execution. You should minimize the number of times you step into a line and rely more on stepping over. Every time you step into a line, the investigation path gets longer and the process more time consuming.
- Even though using the mouse and the IDE’s GUI to navigate through the code is initially more comfortable, learning to use the keyboard shortcuts for these operations will help you debug faster. I recommend you learn the keyboard shortcuts of your favorite IDE and use them instead of triggering the navigation with the mouse.
- After stepping into a line, first read the code and try to understand it. If you can figure out what happens, use the step out operation to return to the previous investigation plan. If you don’t understand what happens, identify the first unclear instruction, add a breakpoint, and start debugging from there.
 Troubleshooting Java, Second Edition ebook for free