11 Analyzing potential JVM issues with GC logs
Garbage Collection logs are positioned as a practical, approachable lens into the JVM’s memory behavior—turning what first looks like inscrutable output into an everyday troubleshooting ally. The chapter opens with a narrative reminder that neglecting GC logs can hide the true causes of latency, CPU spikes, and thread churn, while a quick, focused read of the logs (often aided by an AI assistant) can reveal misconfigured heaps, excessive stop-the-world pauses, and poorly tuned collectors. The overarching goal is to build intuition: understand what the JVM is doing, when, and why—so performance anomalies become explainable patterns rather than mysteries.
From there, the text walks through enabling and structuring GC logging (-Xlog:gc*), capturing it in the console for learning and in files for real diagnostics, and formatting entries with time, uptime, level, and tags to make analysis efficient. It emphasizes operational hygiene: write logs to files, add timestamps, and use rotation (filecount/filesize) to avoid loss or bloat; choose log levels wisely (error/warning in production, info/debug/trace for deeper dives elsewhere). A guided tour explains how to read initialization lines (JVM version, GC type, heap region sizes, worker counts) and event lines (event type, phases, and durations), how object movement across Eden/Survivor/Old appears in logs, and what humongous object patterns imply. For scale, the chapter encourages using specialized tools and AI to sift large volumes, highlight anomalies, and surface likely root causes faster.
The heart of the analysis covers recurring problem patterns and concrete remedies. For performance lags, look for rising GC pause times, increasing frequency, and prolonged stop-the-world events; mitigate by right-sizing the heap (Xms/Xmx), reducing allocation churn, adjusting young/old dynamics, or choosing a more suitable algorithm (e.g., ZGC/Shenandoah for low latency). To spot memory leaks, watch for steadily increasing post-GC usage and Full GCs that reclaim little; confirm with heap dumps and roll back recent changes if needed. To distinguish insufficient memory from leaks, note that memory is reclaimed but GC occurs too often—pointing to under-provisioning rather than retention. Finally, the chapter shows how to tune G1’s parallelism (ParallelGCThreads, ConcGCThreads) to avoid underutilization or CPU contention, urging an iterative, measured approach and production discipline: keep logs lean in live systems, reproduce issues in staging, and let data—not guesswork—drive tuning.
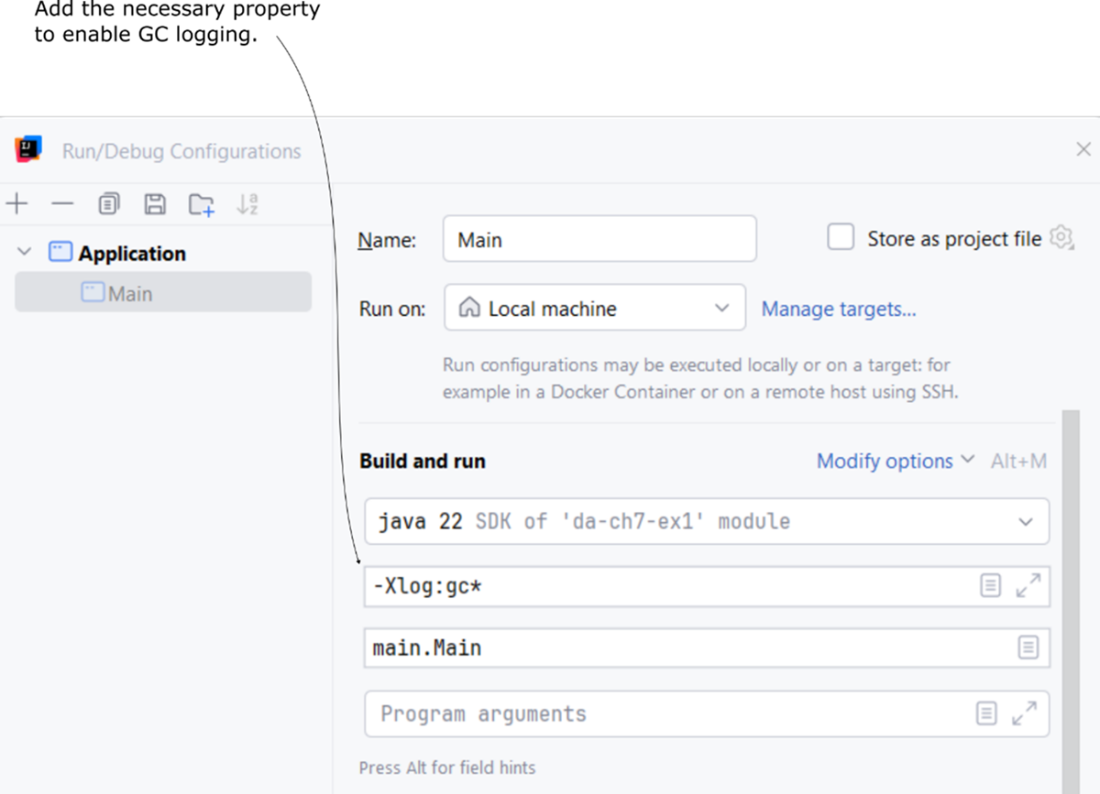
Enabling the GC logs in IntelliJ IDEA running configuration to display the GC logs in the execution console.
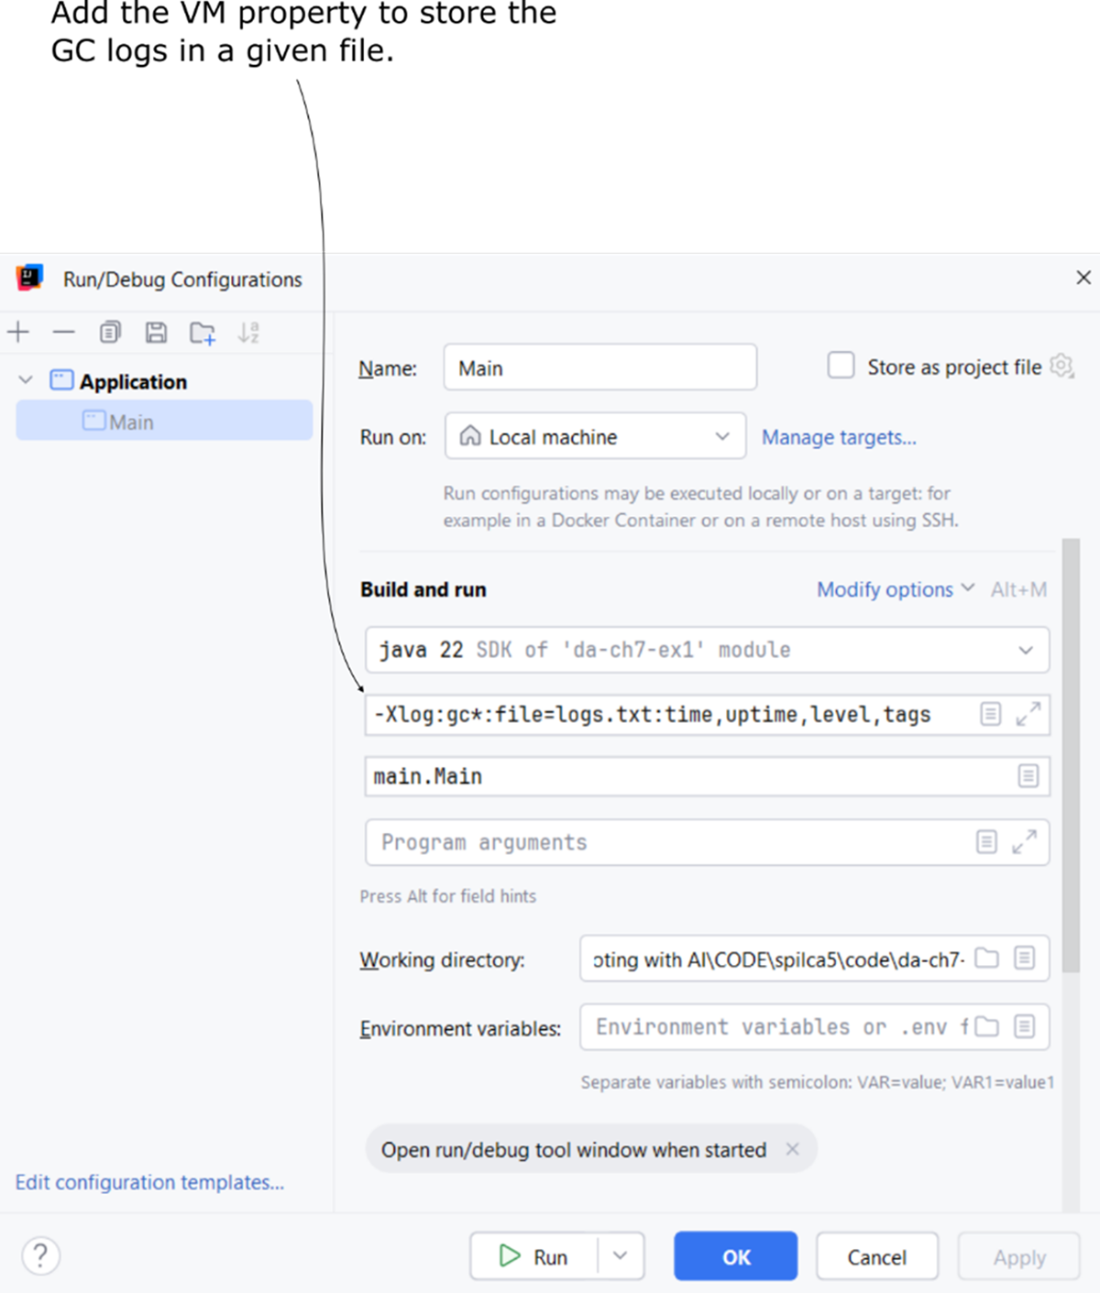
Adding a VM property to store GC logs for the application's execution in a specified file.
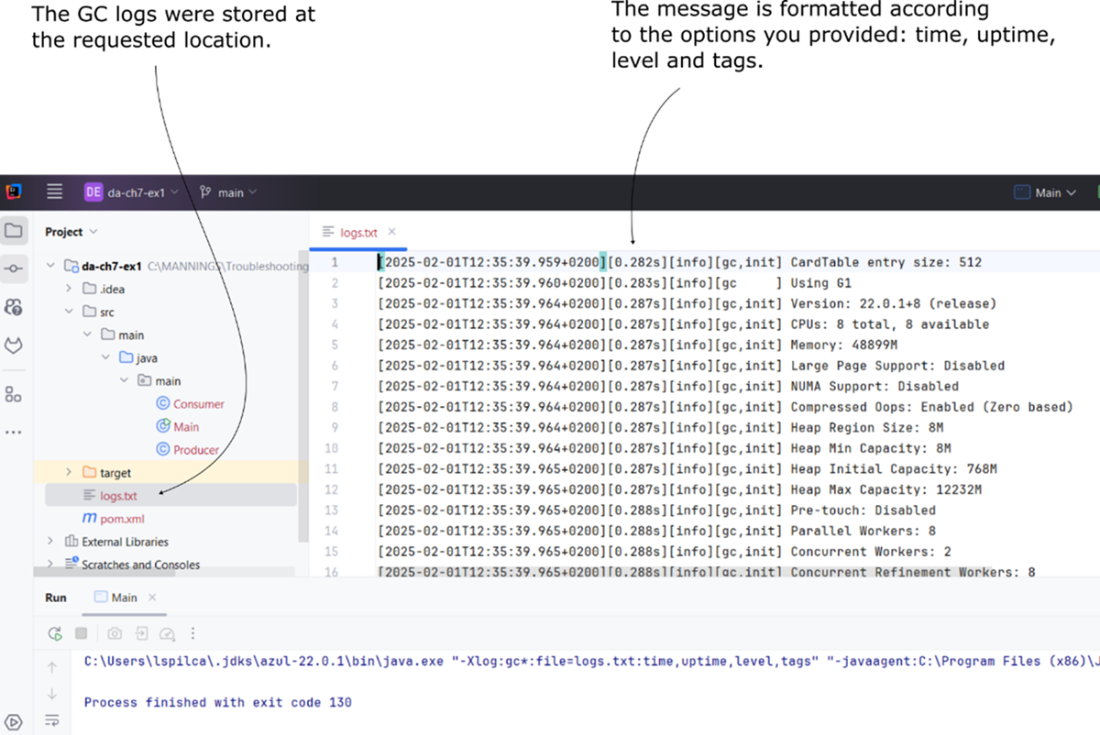
Properly formatted GC logs are stored in the specified file, as defined by the VM parameter.
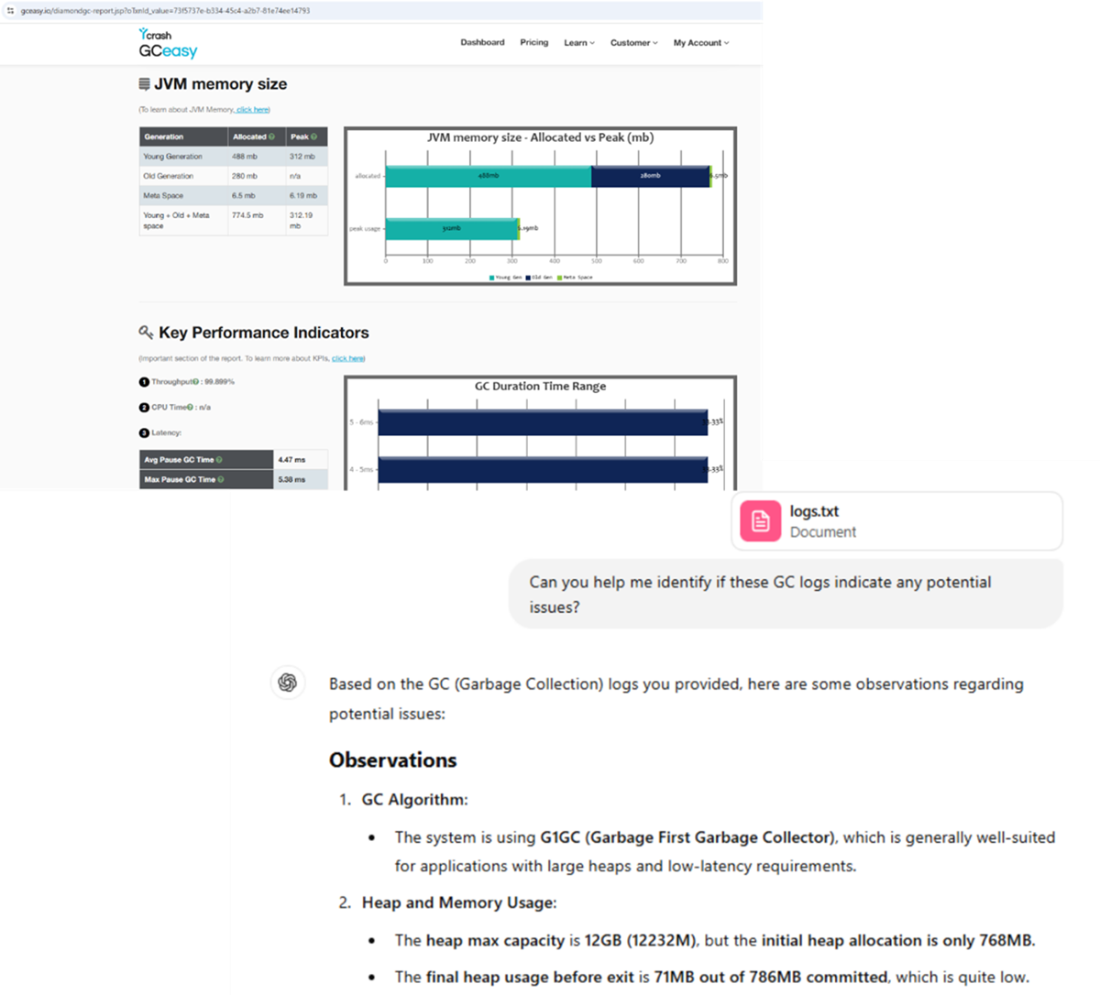
Using tools such as GCeasy or AI chat assistants to help you troubleshoot the GC logs.
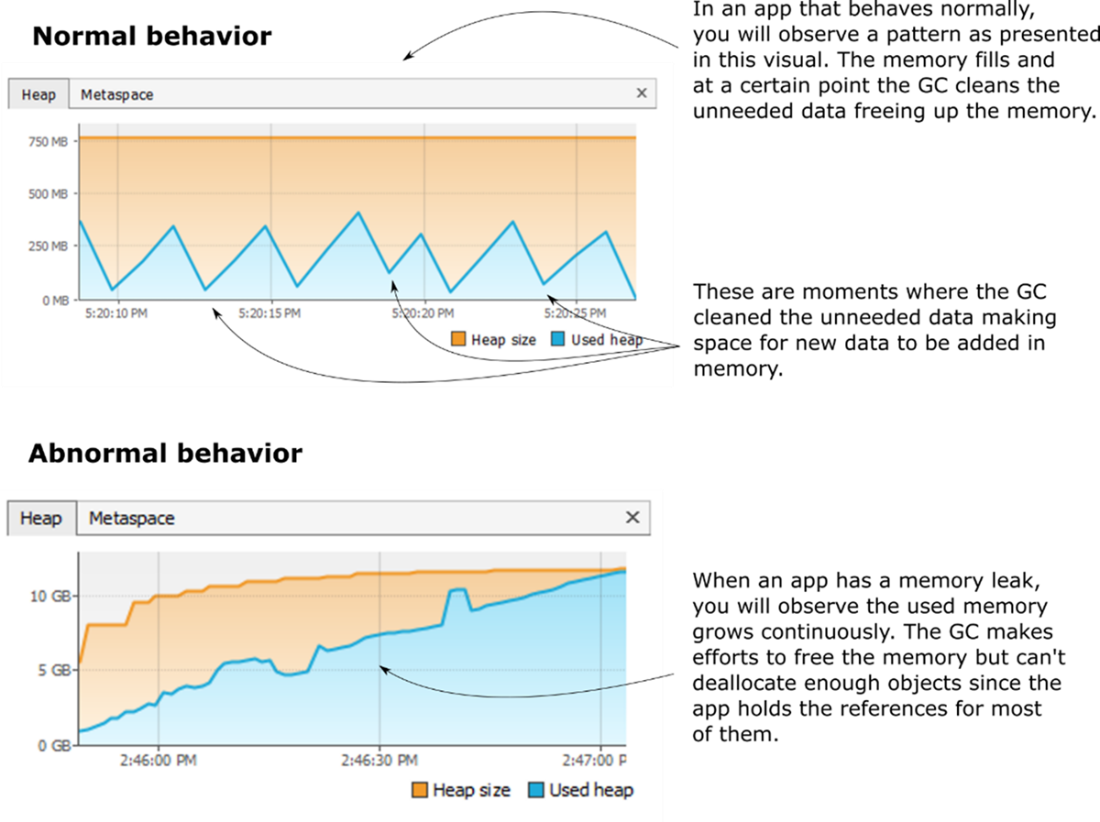
A comparison between the memory consumption graph of an application with normal memory usage and one affected by a memory leak.
Summary
- Garbage Collector logs are crucial for troubleshooting JVM memory management issues. They provide insights into memory allocation, garbage collection pauses, and heap utilization.
- Enabling GC logs is the first step in analyzing JVM memory behavior. The -Xlog:gc* VM option enables GC logging, helping developers track GC activity in real-time or store logs for later analysis.
- Understanding GC log structure is essential. Logs include details on GC events, pause times, heap size changes, and memory allocation patterns.
- GC logs help diagnose excessive GC pauses. Long GC pause times (typically above 50ms) can indicate performance issues, while frequent Full GC events suggest memory pressure.
- Heap memory organization impacts GC performance. Objects move through Eden, Survivor, and Old Generation memory regions. Inefficient memory usage can cause frequent GC interruptions.
- Frequent Full GC events may indicate insufficient memory or a memory leak. Logs showing frequent Full GC events with minimal memory reclamation suggest a leak, while effective but frequent Full GCs indicate an under-provisioned heap.
- Storing GC logs in files is recommended for deeper analysis. Use -Xlog:gc*:file=gc.log:time,uptime,level,tags to redirect logs to a file for structured storage and easier troubleshooting.
- Log rotation prevents excessive storage use. Configuring file count and file size limits ensures logs do not consume excessive disk space.
- Choosing the right logging level improves troubleshooting efficiency. Error logs capture critical failures, while Info and Debug levels provide additional insights into memory management.
- Tuning GC parallelism can reduce pause times. Adjusting -XX:ParallelGCThreads and -XX:ConcGCThreads optimizes CPU usage for better performance.
- AI tools and third-party services can simplify GC log analysis. Uploading logs to tools like GCEasy or using AI assistants can speed up troubleshooting.

 Troubleshooting Java, Second Edition ebook for free