13 Managing projects
Effective project management hinges on quantitative thinking. The chapter argues that projects falter when planning is superficial and management relies on intuition rather than data. It emphasizes the interdependence of scope, schedule, and budget, noting that schedule slippage often cascades into cost overruns and scope compromise. The remedy is a disciplined, statistics-driven approach that turns planning, execution, and risk control into measurable, testable processes.
The workflow begins with a work breakdown structure (WBS), a hierarchical decomposition that captures all activities and their dependencies; the WBS is the foundation of the plan, not the plan itself. Activity durations are then estimated with PERT using optimistic, most likely, and pessimistic inputs to derive expected times. With durations and dependencies set, the critical path method (CPM) calculates earliest and latest start/finish times and slack, distinguishing tasks that drive the end date from those with float. Because manual CPM does not scale, the chapter demonstrates programmatic forward and backward passes in Python with pandas and NumPy to compute ES, EF, LS, LF, slack, and criticality reliably for larger networks, regardless of whether teams work in waterfall or Agile iterations.
Uncertainty is quantified by deriving activity variances from PERT inputs and aggregating them along the critical path to obtain a project standard deviation. Assuming approximate normality of completion time, a z-score provides the probability of finishing by a given deadline, either via tables or directly with scipy. When the likelihood is insufficient, the chapter turns to schedule compression (crashing): compute per-week crash costs, target the lowest-cost critical activities, shorten them within allowable bounds, and verify the critical path does not shift. For complex portfolios, it recommends formulating crashing as a constrained optimization problem. Taken together, WBS, PERT, CPM, probabilistic forecasting, and cost-aware crashing give managers a rigorous toolkit to plan intelligently, focus attention where it matters, and deliver on time without sacrificing scope.
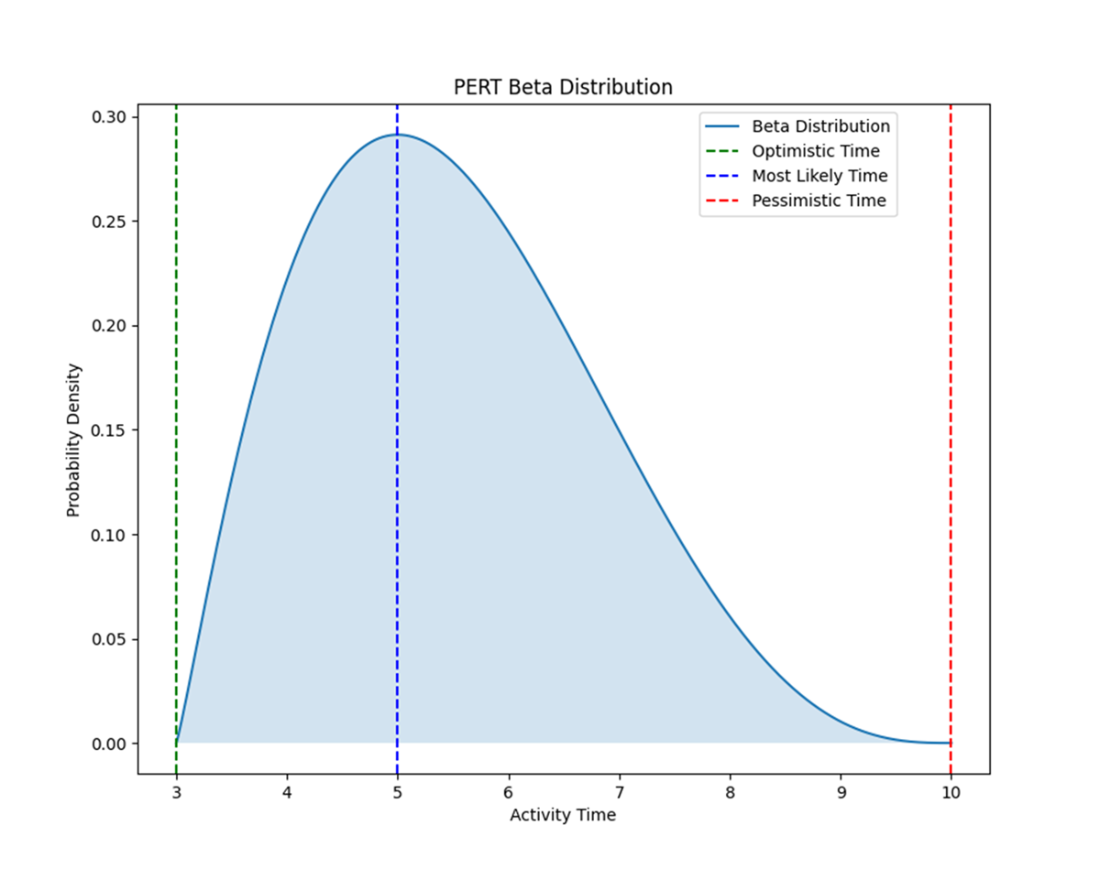
An illustration of the beta probability distribution assumed by PERT that otherwise displays the optimistic, pessimistic, and most likely activity times. The area under the curve represents the probability of different completion times, with the peak indicating the most likely duration.
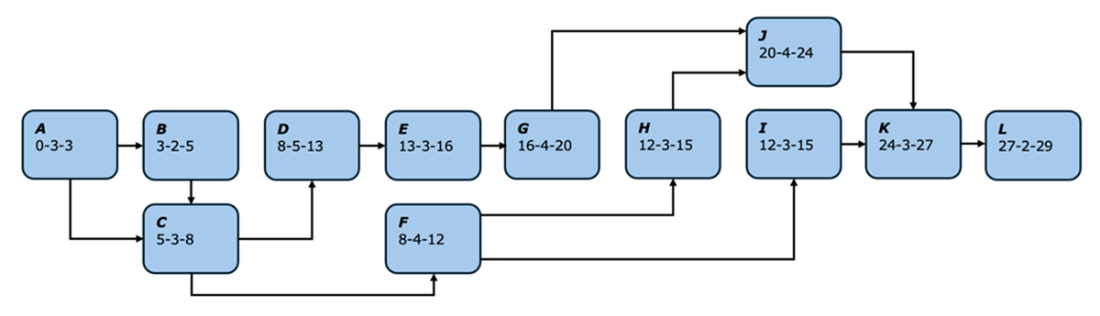
A visual representation of the automated reporting tool project plan, where each activity is represented by its unique identifier. Lines and arrows between activities represent dependencies. The sequence of digits immediately beneath each activity represents, in order, the activity’s earliest start time, expected duration, and earliest finish time. Earliest times are derived by using a forward pass through the network. Based on this analysis, the project timeline is 29 weeks, which is the length of the longest path in the network.
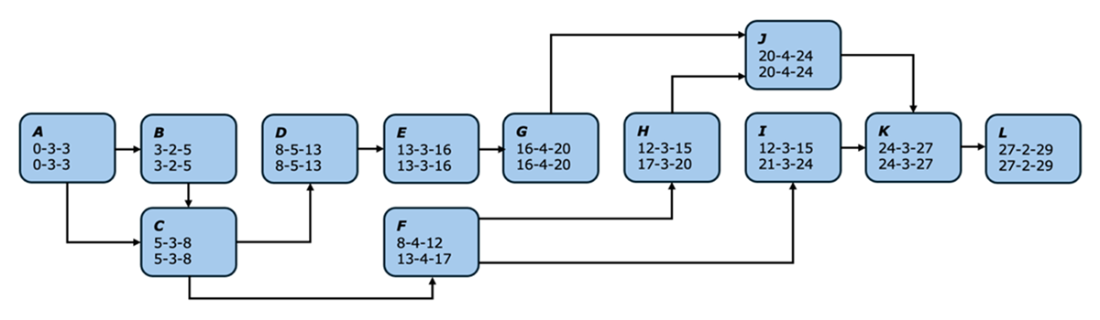
A second visual representation of the automated reporting tool project plan. The new three-digit sequence for each activity represents, in order, the latest start time, the expected duration, and the latest finish time. A quick and easy way of distinguishing critical tasks from non-critical tasks is to compare the three-digit sequences—critical tasks have similar three-digit sequences while non-critical tasks do not.
The top of a typical z-score table. The probability is found where the integer and remaining fractional parts of the value intersect.

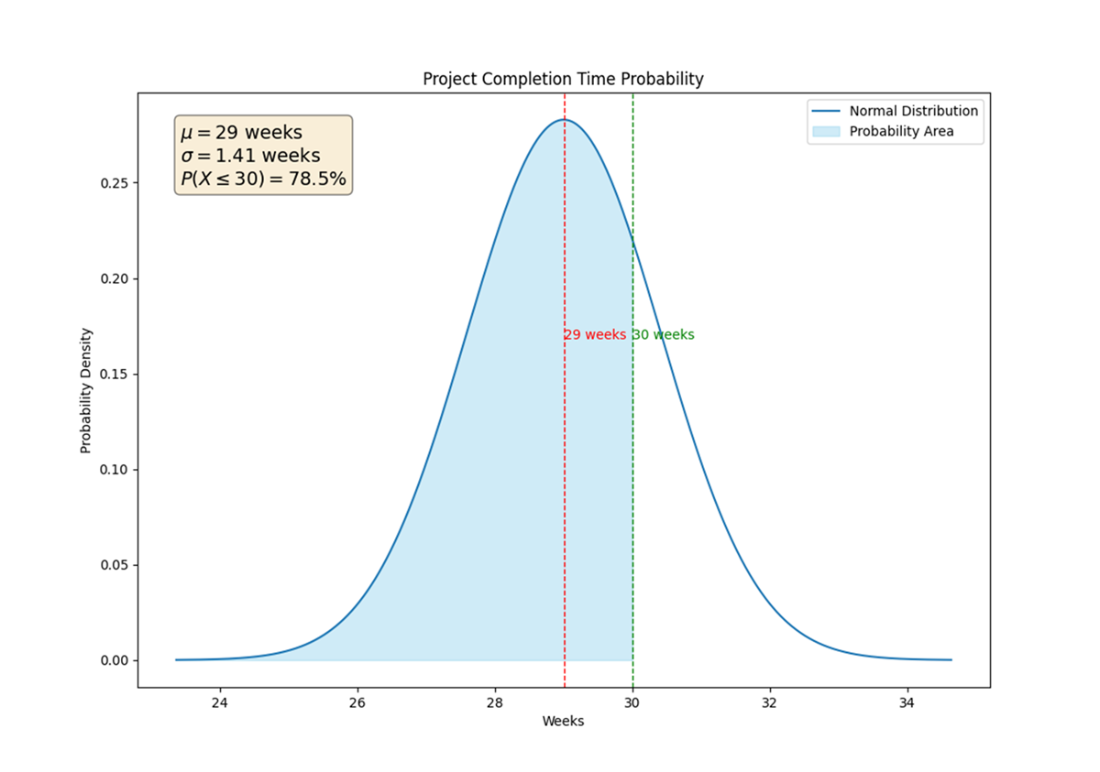
Normal probability distribution of project completion time, where the mean duration is 29 weeks and the standard deviation is 1.41 weeks. The due date of 30 weeks is marked, showing a 78.5% probability (using the z-table results) of completing the project within this timeframe.
Summary
- Managing projects effectively requires a solid foundation in quantitative skills. These skills enable project managers to analyze data, forecast outcomes, and make informed decisions based on numerical evidence. Proficiency in areas such as scheduling, risk assessment, and resource allocation is critical. These competencies help in structuring plans that are realistic and achievable, ensuring project objectives are met efficiently.
- A work breakdown structure is pivotal in project planning and management. It systematically breaks down a project into manageable sections and tasks, making it easier to organize, schedule, and delegate. The WBS serves as the foundation for the project planning process, helping to identify all necessary activities, allocate resources appropriately, and establish a timeline that supports the project’s objectives.
- The program evaluation and review technique is utilized especially in scenarios where there's a lack of analogous estimating data. PERT focuses on calculating time estimates for project activities by considering optimistic, pessimistic, and most likely durations. This approach accommodates uncertainty and variability in project planning, allowing for more robust and resilient scheduling.
- The critical path method identifies the longest sequence of dependent activities and calculates the shortest possible project duration. Automating CPM enhances accuracy in identifying the critical path, reduces manual errors, and speeds up the reevaluation of the project schedule in response to changes. This automation supports dynamic project management and allows real-time decision-making to keep the project on track.
- Calculating the probability of on-time project completion involves using statistical methods to assess the likelihood of meeting project deadlines. By computing the z-score for the project duration and using it to estimate the cumulative probability, project managers can quantify the chances of completing the project by a specified due date. This method provides a clear, numerical understanding of schedule risks, enabling better planning and decision-making to ensure timely project delivery.
- Project crashing is a technique used to shorten the duration of a project by decreasing the time for one or more critical path activities. This is often achieved at additional costs, typically by assigning overtime to current project team members or by adding resources. The decision to crash a project is usually made when the benefits of completing the project sooner outweigh the additional expenses and other factors.
- Applying quantitative skills to project management requires significant analytical effort and careful planning, even with automation. However, the consequences of inadequate project management—delays, budget overruns, and compromised scope—are often far greater. Poor planning is a leading cause of project failure, and leveraging quantitative methods helps mitigate risks, optimize schedules, and improve overall project outcomes.
 Statistics Every Programmer Needs ebook for free