Overview
1 The data science process
Data science is presented as a practical, cross‑disciplinary craft focused on making better decisions in business and science. The chapter emphasizes that success stems less from exotic tools than from clear, quantitative goals, sound methodology, collaboration, and a repeatable workflow. Grounded by a loan‑risk example, it introduces an iterative project lifecycle in which insights at any stage can trigger revisiting earlier steps, and where completed efforts often lead to follow‑on projects.
Successful projects rely on well‑defined roles and sustained stakeholder engagement. The project sponsor owns the business outcome and defines success, so keeping them informed and securing measurable acceptance criteria is paramount. The client represents end users and workflow realities; the data scientist designs strategy and analysis; and data architects and operations ensure data stewardship, infrastructure, deployment, and run‑time constraints. Regular communication, intelligible reporting, and aligning technical choices with business and user needs are treated as core competencies.
The lifecycle progresses from defining specific, measurable goals to collecting, exploring, and conditioning data, with attention to representativeness, quality, and bias. Modeling then extracts signal through tasks such as classification, scoring, ranking, clustering, and relationship discovery, selected to balance performance with interpretability and operational fit. Models are critiqued against business goals using metrics beyond accuracy, compared to null or existing baselines, and refined as needed. Results are documented and tailored to executives, end users, and operations, then deployed, monitored, piloted, and maintained. The chapter closes by stressing expectation‑setting: establish realistic lower bounds and success thresholds early, verify that available data and resources can meet them, and use measures like precision, recall, and false‑positive rate to guide trade‑offs.
Summary
The data science process involves a lot of back-and-forth—between the data scientist and other project stakeholders, and between the different stages of the process. Along the way, you’ll encounter surprises and stumbling blocks; this book will teach you procedures for overcoming some of these hurdles. It’s important to keep all the stakeholders informed and involved; when the project ends, no one connected with it should be surprised by the final results.
In the next chapters, we’ll look at the stages that follow project design: loading, exploring, and managing the data. Chapter 2 covers a few basic ways to load the data into R, in a format that’s convenient for analysis.
In this chapter you have learned:
- That a successful data science project involves more than just statistics. It also requires a variety of roles to represent business and client interests, as well as operational concerns.
- That you should make sure you have a clear, verifiable, quantifiable goal.
- That you should make sure you’ve set realistic expectations for all stakeholders.
FAQ
What does this chapter mean by “data science”?
Data science is a cross‑disciplinary practice that uses data engineering, descriptive statistics, data mining, machine learning, and predictive analytics to drive decisions and manage their consequences. In this book it is applied to business and scientific problems, and success comes from measurable goals, sound methodology, collaboration, and repeatable workflows—not from any single tool.Who are the core roles in a data science project and what do they do?
- Project sponsor: Owns the business need and decides success; champions the project.
- Client (end‑user representative): Domain expert who ensures the solution fits day‑to‑day work.
- Data scientist: Sets strategy, selects data and tools, builds and evaluates models, and communicates with stakeholders.
- Data architect: Manages data sources and storage; may oversee data collection.
- Operations: Owns infrastructure and deployment constraints; runs the model in production.
Roles can overlap, and some may sit outside the core project team.Why is the project sponsor so important, and how should you work with them?
The sponsor defines success. Get explicit, quantifiable goals through directed interviews and keep the sponsor informed with clear, business‑level updates. Aim for precise acceptance criteria (for example, target recall, false positive rate, and lead time) and seek periodic sign‑off to keep the project aligned.What are the stages of the data science lifecycle, and why are they iterative?
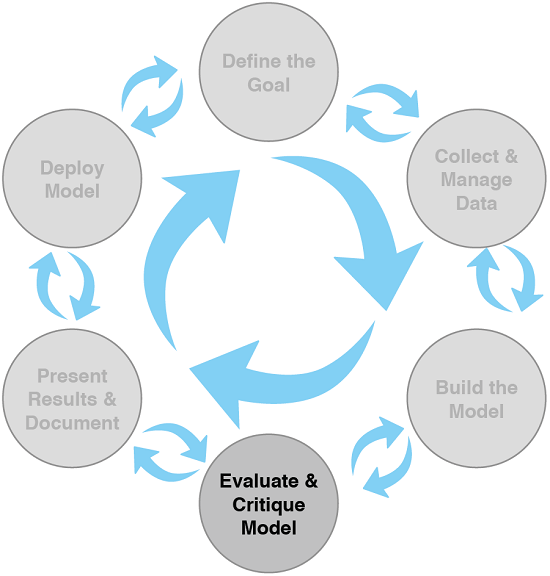
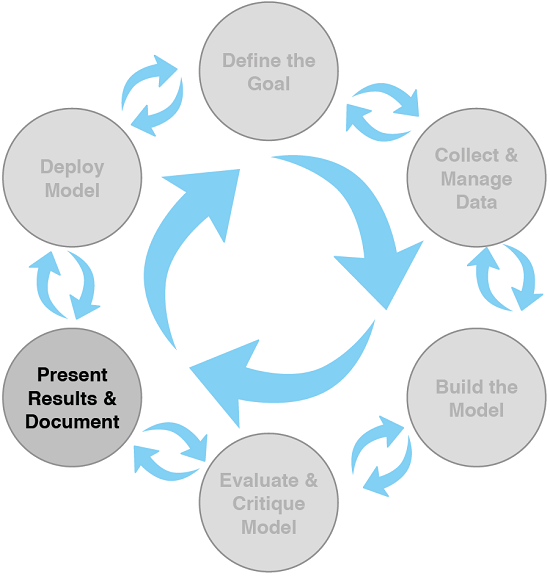
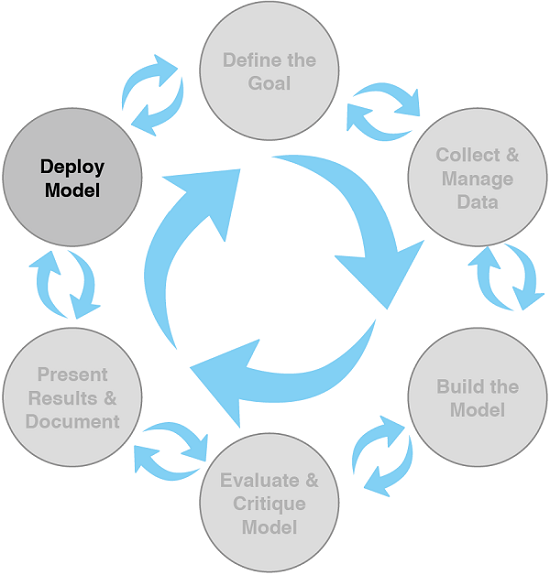
- Defining the goal
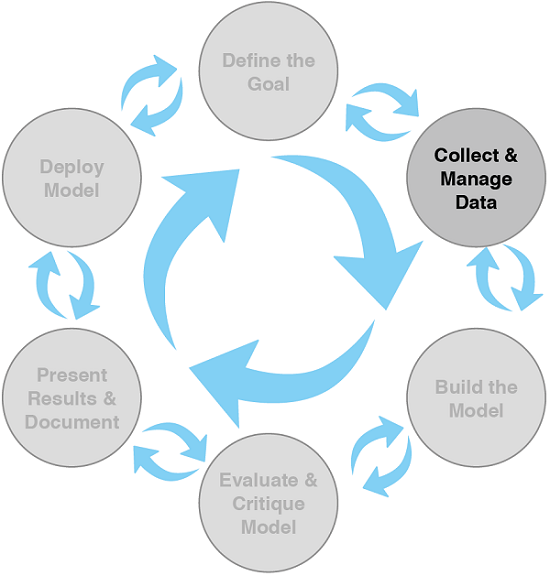
- Data collection and management
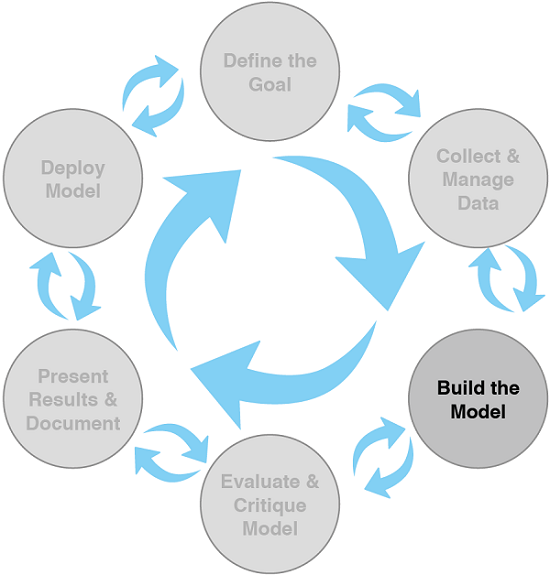
- Modeling
- Model evaluation and critique
- Presentation and documentation
- Deployment and maintenance
Expect iteration and feedback loops between stages (similar to CRISP‑DM). You often revisit earlier steps as you learn from data and stakeholders.How do you define a good project goal?
Make it specific, measurable, and tied to deployment. Clarify the problem context, available resources (data, staff, compute), and constraints. Establish concrete acceptance criteria and stopping conditions. For exploratory work, time‑box it and convert findings into testable goals for a full project.What should you look for during data collection and management?
- What data exists, whether it’s sufficient, and its quality.
- Prefer direct measures over proxies when possible.
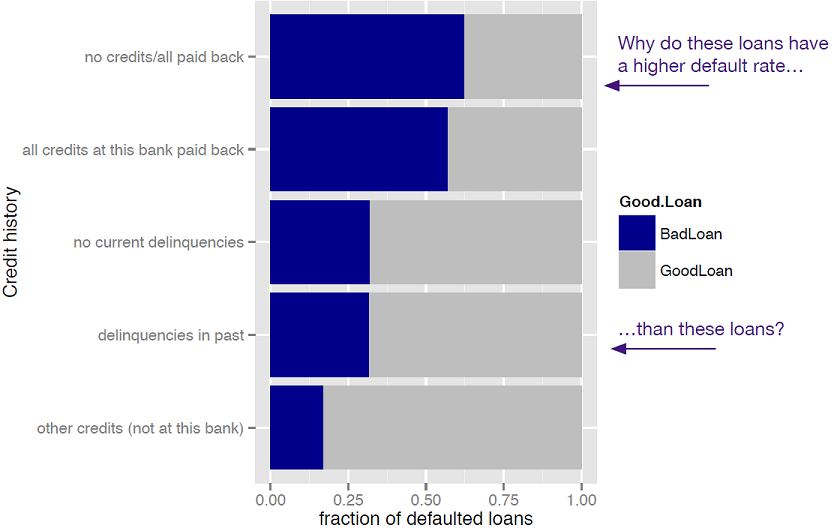
- Explore, visualize, and clean early; expect to refine goals as you learn.
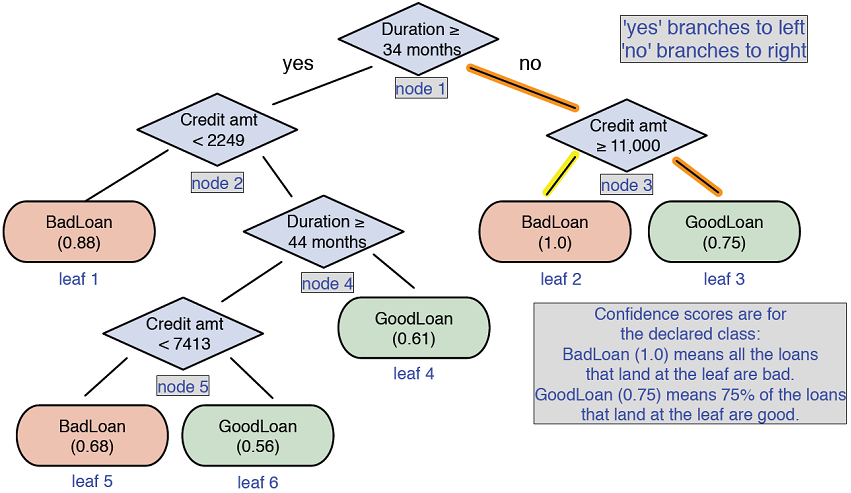
- Watch for sampling bias (e.g., having only accepted loans can distort patterns) and involve domain experts to interpret surprising findings.Which modeling tasks are common, and what drove the model choice in the loan example?
Common tasks: classification, scoring, ranking, clustering, finding relations, and characterization. In the loan example (a classification problem), a decision tree was chosen for interpretability and confidence estimates, though logistic regression and Naive Bayes were also viable options.How do you evaluate and critique a model?
Check whether it meets goals, generalizes, and makes domain sense. Use confusion matrices and metrics like accuracy, precision, recall, and false positive rate; compare performance to the “obvious guess” or current process. Prefer evaluation on held‑out test data, and balance trade‑offs with stakeholders.What does “setting expectations” involve, and how do null models help?
Align performance targets with business goals and available resources early. Define a null model (existing process or simplest baseline) to set lower bounds (e.g., base error rate) and test that your model is significantly better. Go beyond accuracy—precision, recall, and false positive rate are often more relevant to business impact.How should you present results and plan for deployment and maintenance?
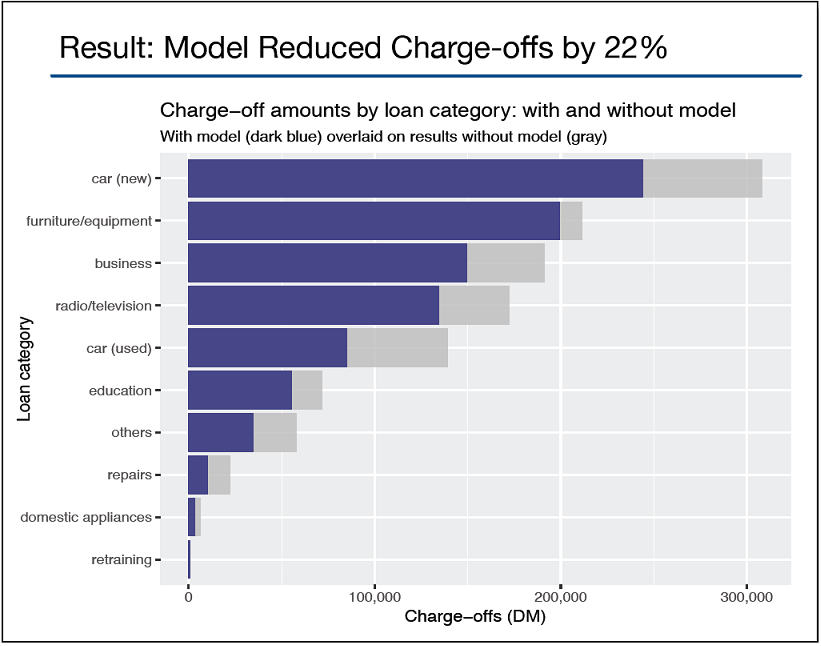
- For sponsors: emphasize business impact (e.g., potential reduction in losses).
- For end users: explain outputs, confidence scores, when to override, and how the model helps their workflow.
- For operations: detail dependencies, latency, data volume, and failure modes.
Pilot first, monitor performance and overrides, update models as conditions change, and capture feedback for follow‑up projects.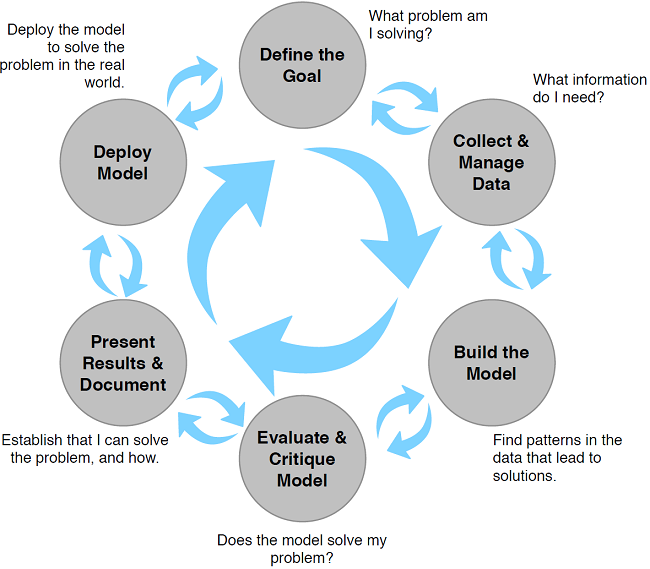

 Practical Data Science with R, Second Edition ebook for free