11 Monitoring and explainability
Putting models into production is only the beginning; keeping them reliable demands comprehensive monitoring, alerting, and interpretability. This chapter outlines an end-to-end approach to observability for ML services, combining basic operational monitoring with ML-specific checks like data drift, and pairing them with explainability techniques to understand model behavior. Using an object detection service and a movie recommender as running examples, it frames monitoring in two parts—service health and data drift—and shows how explainability builds trust, aids debugging, and supports regulatory and stakeholder needs.
For operational monitoring, the chapter demonstrates how BentoML’s built-in metrics can be scraped by Prometheus and visualized in Grafana, providing insights into uptime, latency, throughput, resource usage, and error rates against SLAs. It shows how to add custom business-aware metrics (for example, a prediction confidence histogram and request counters) and why logs complement metrics for root-cause analysis. Logs are centralized with Loki to correlate events across services, unifying metrics and logs in one place. Alerting is then layered on using Prometheus alert rules (including up and absent checks) and Alertmanager to route notifications by severity to channels like email or PagerDuty, enabling timely, actionable incident response.
On the ML side, the chapter focuses on detecting and responding to data drift and making model decisions transparent. For computer vision, it uses Deepchecks to compare distributions of image properties (such as brightness and contrast) between training and production data, and recommends storing inference images and predictions to compute drift periodically. For recommendations, it tracks shifts in user and item latent factors and detects feature-level drift over time. Explainability techniques close the loop: EigenCAM heatmaps verify that the object detector attends to the right regions, while an explainable matrix factorization approach surfaces neighborhood-based rationales for recommendations. Together, these practices establish a robust feedback system—monitor, detect, explain, and act—to maintain performance, reliability, and trust in production ML systems.
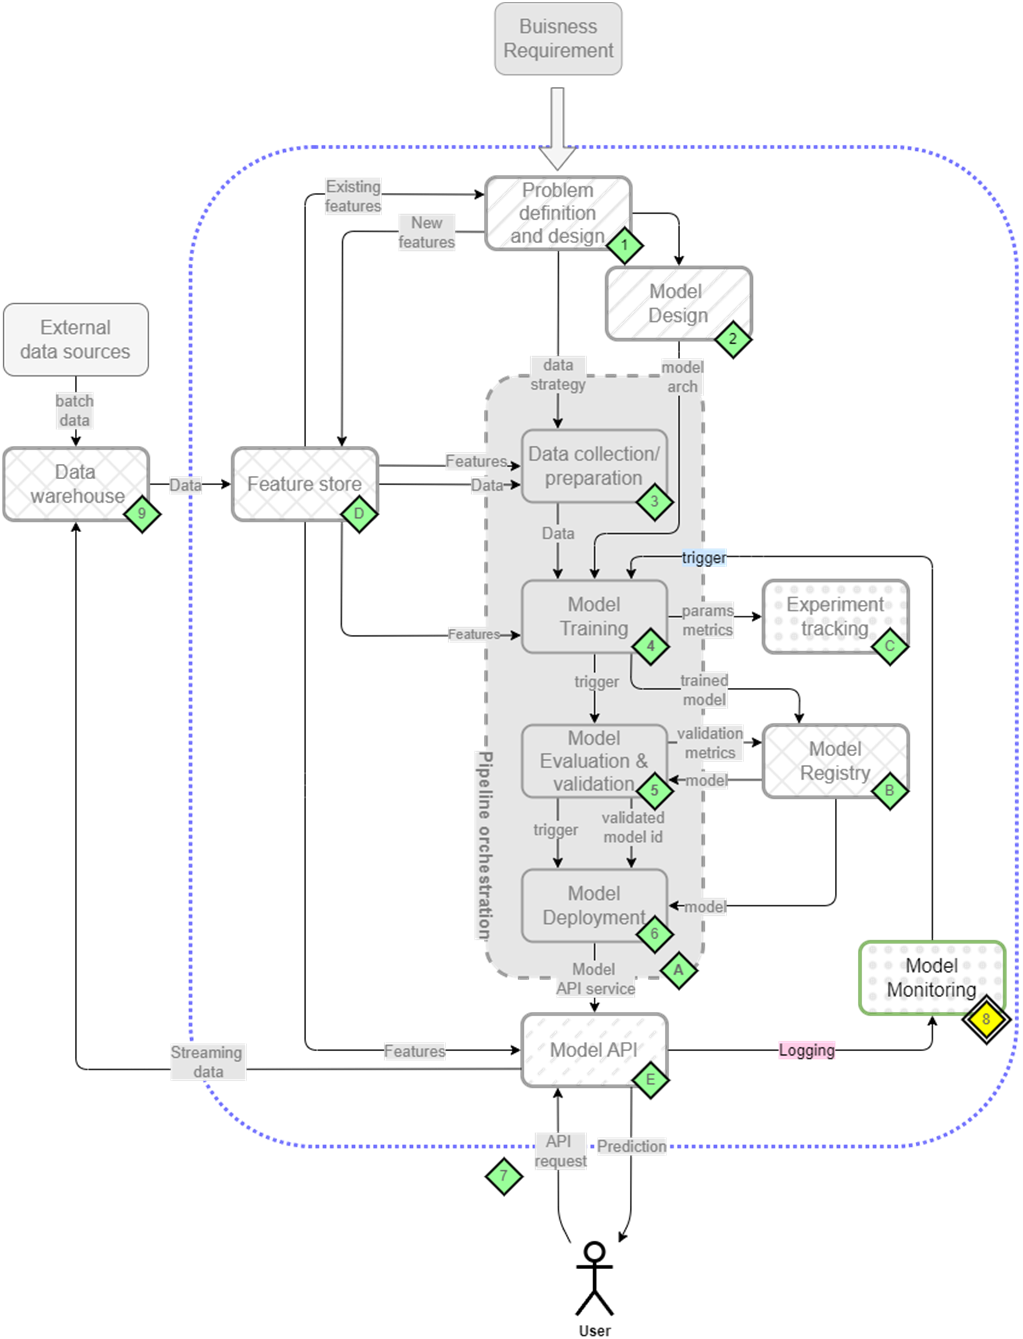
The mental map where we are now focusing on model monitoring(8)
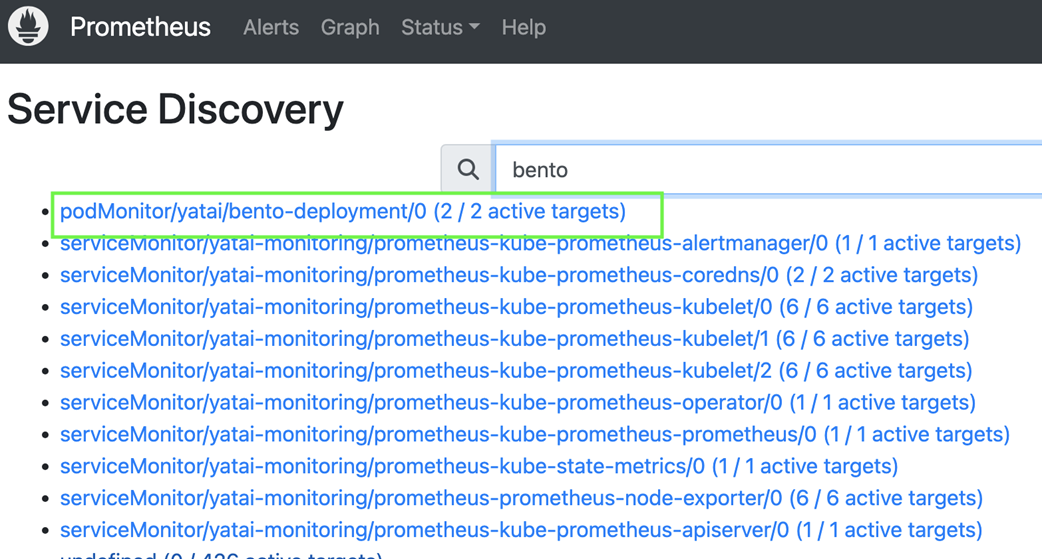
Searching for BentoML in Prometheus service discovery
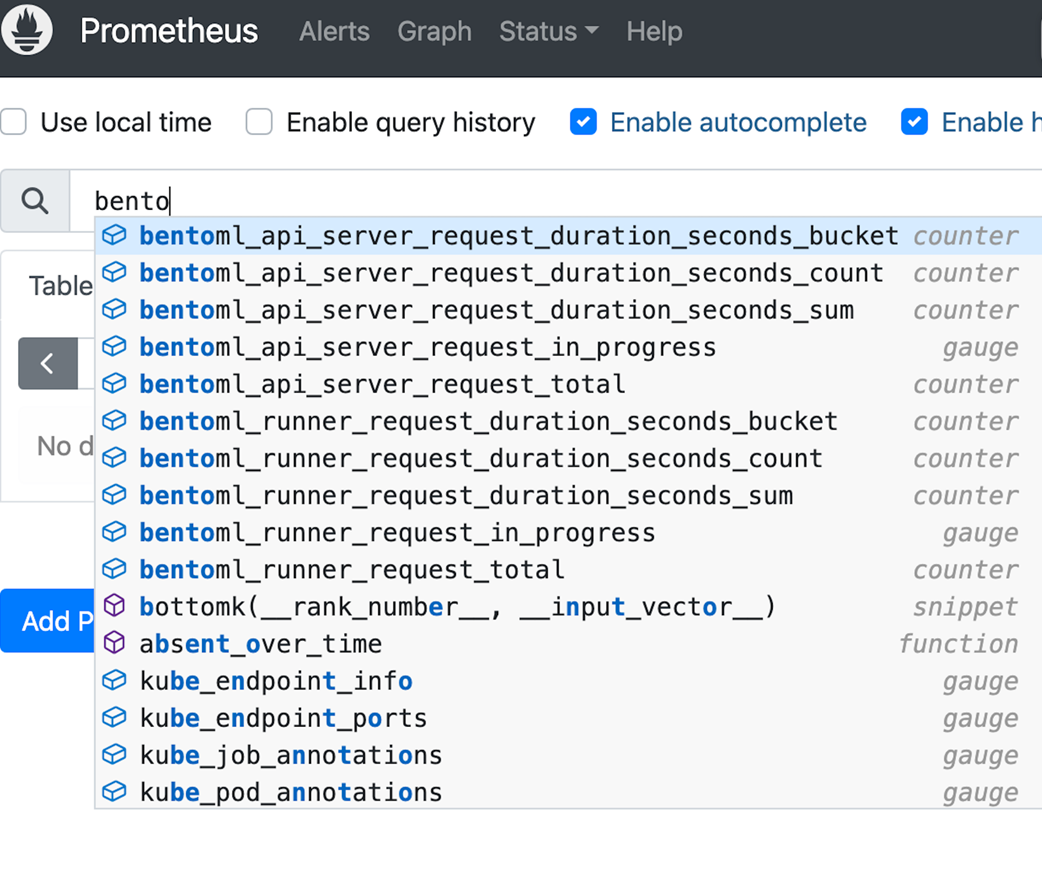
Verifying if BentoML metrics are being scraped by Prometheus
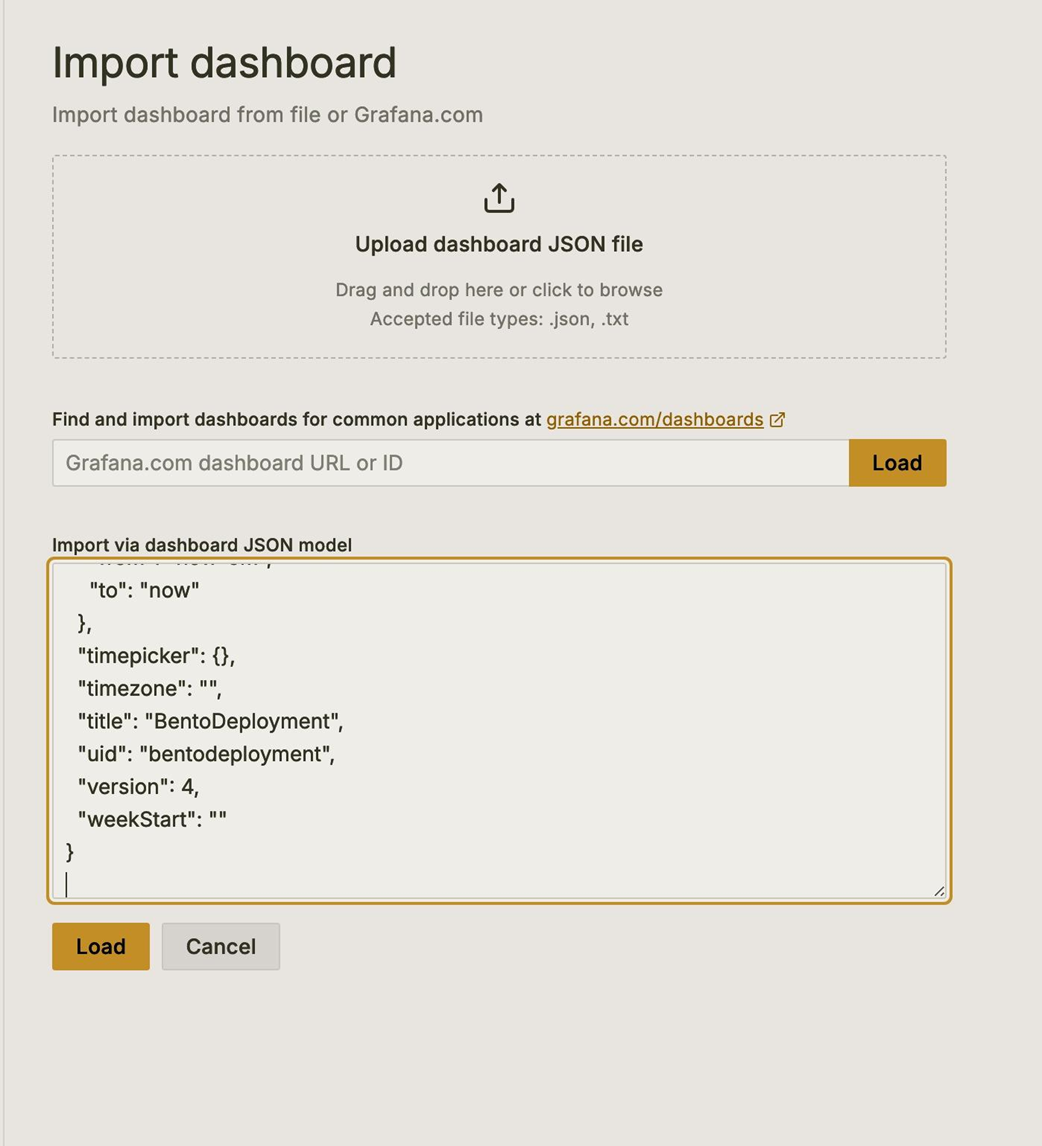
Importing BentoML dashboard in Grafana
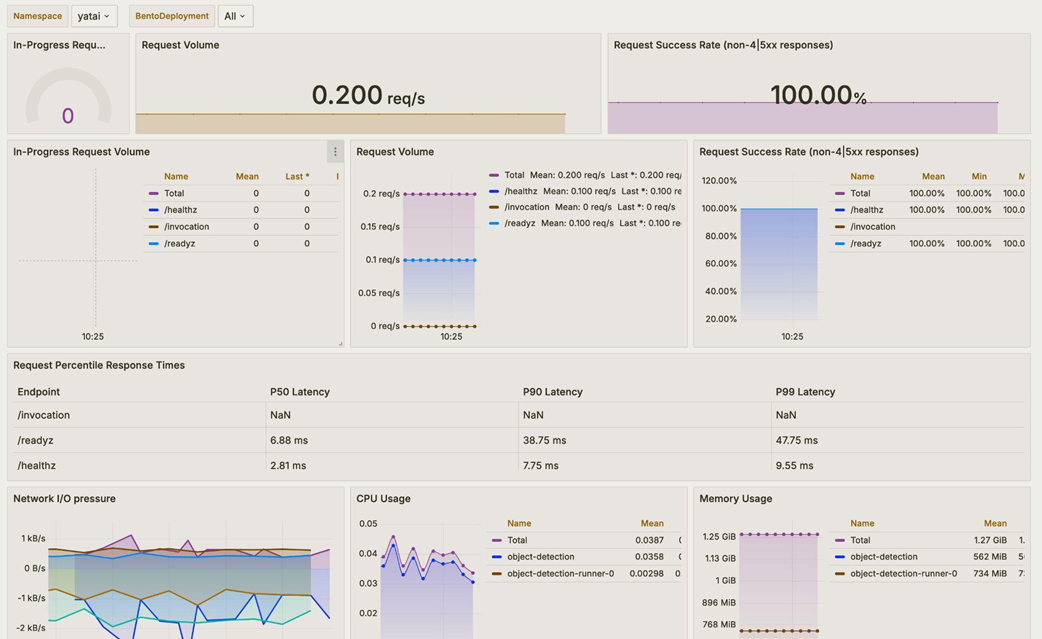
BentoML basic monitoring dashboard.
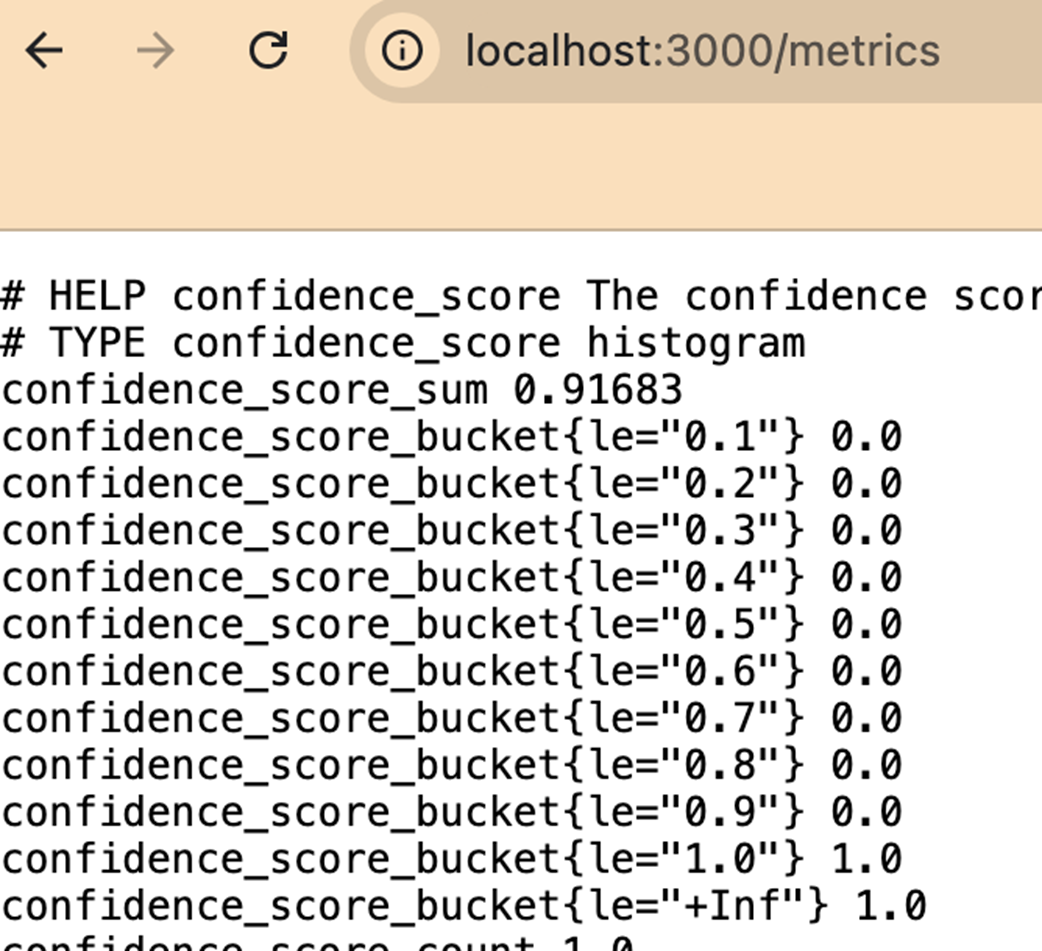
Custom metrics can be seen at /metrics endpoint
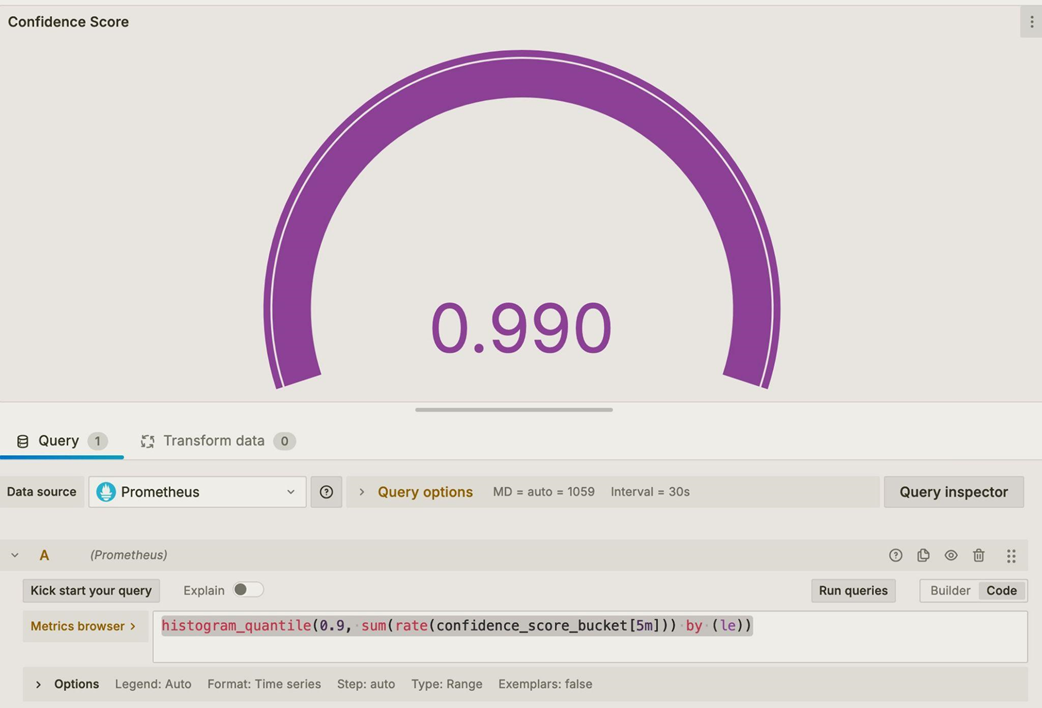
Visualizing the confidence score custom metric in Grafana as a Gauge
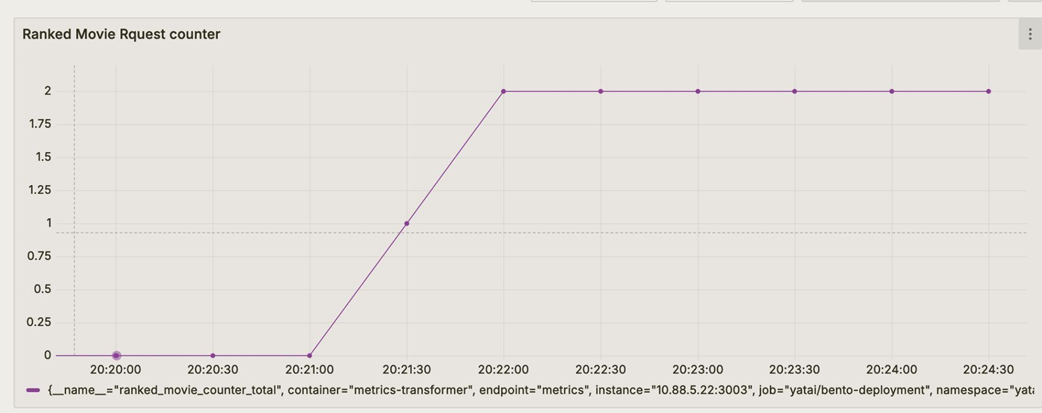
Visualizing the ranked movie counter score custom metric in Grafana as a line chart
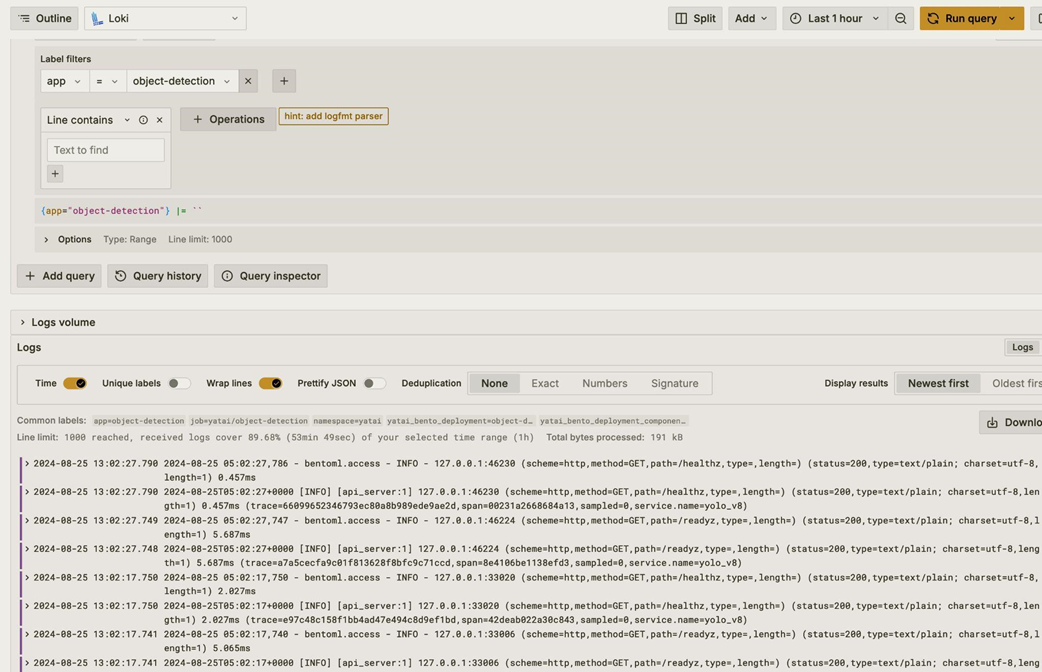
Using Loki as log aggregation system in Grafana
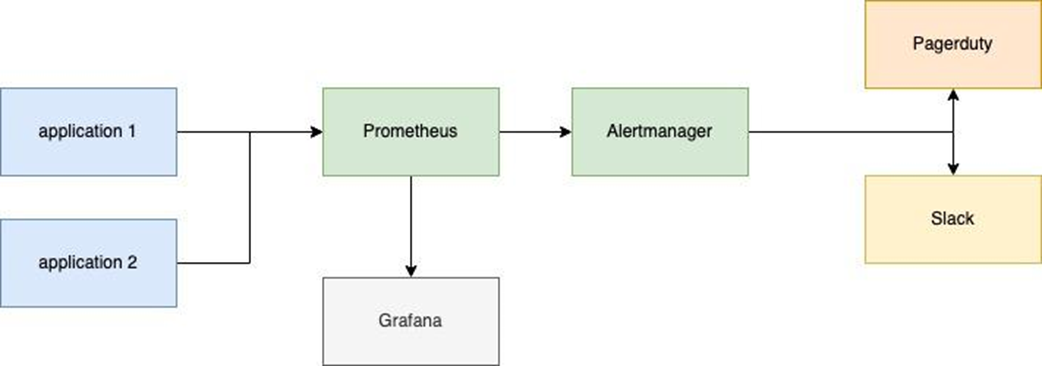
Alerts generated by the Prometheus service are sent to Alertmanager, which routes them to various channels such as Slack, Email, or PagerDuty
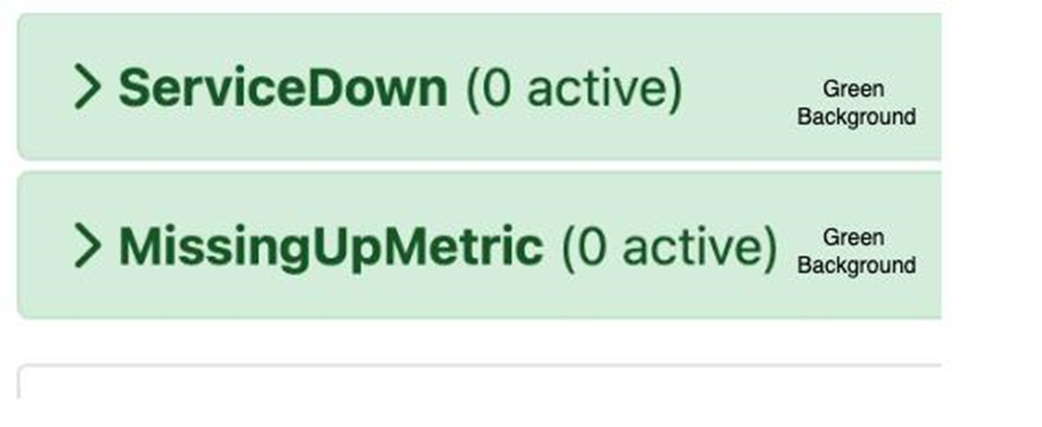
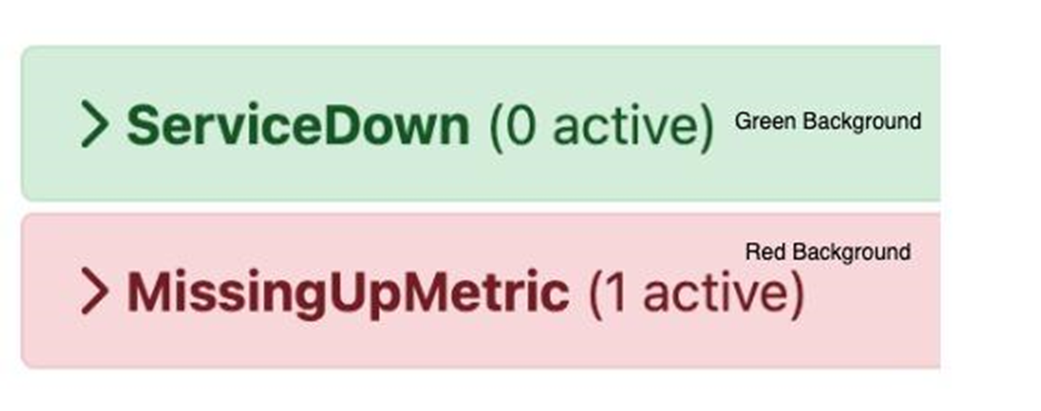
When the alerts are green in color it means they have not been triggered yet
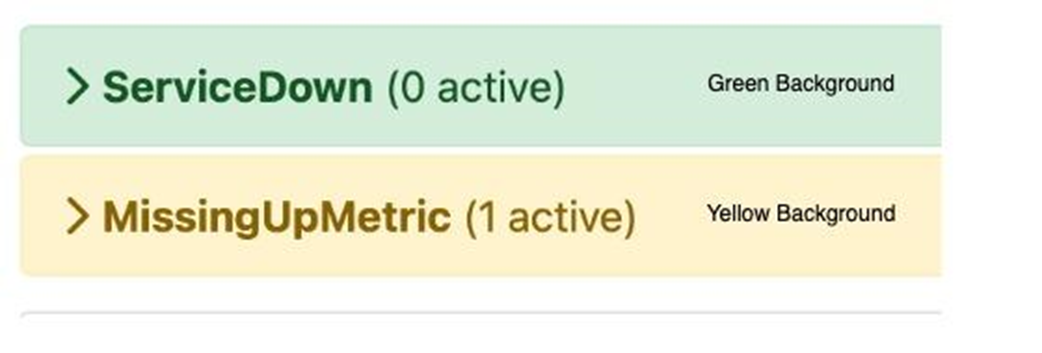
When the alerts are yellow it means the rule that triggers the alert is active and in a pending state
When the alerts are red it means the alert has been triggered
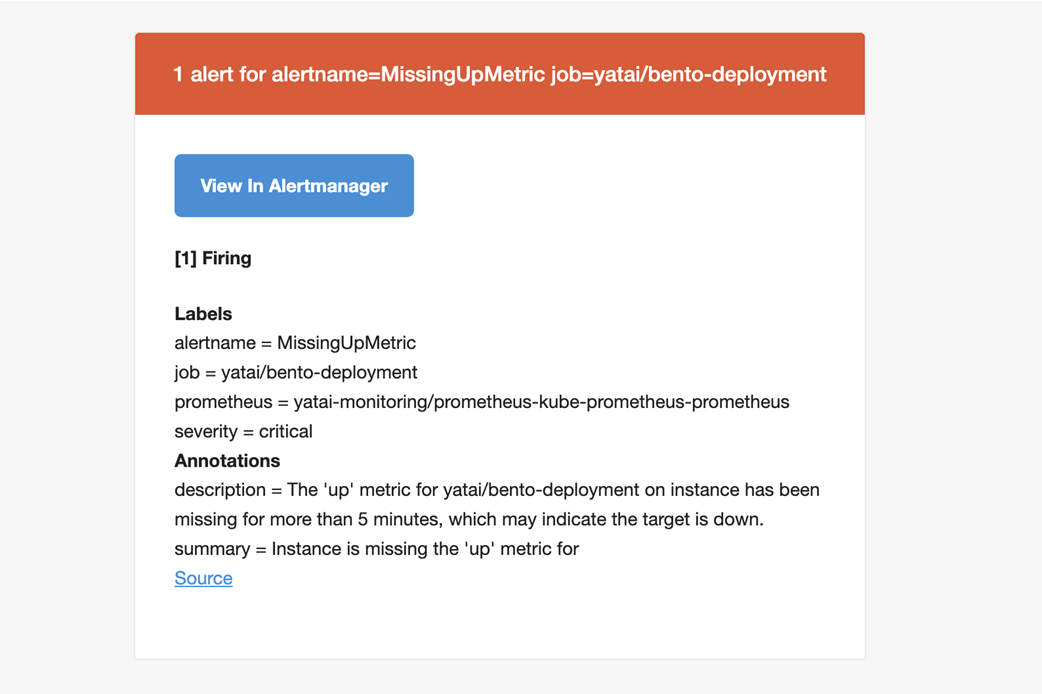
An alert email that states the alert label and pre-defined description
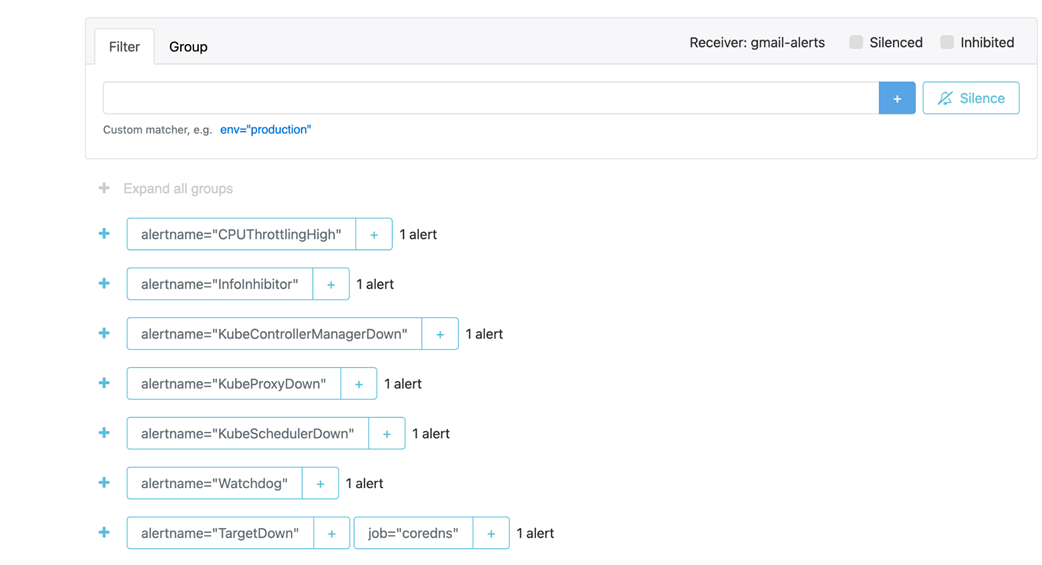
Multiple alerts which have been triggered and routed to Gmail by Alertmanager
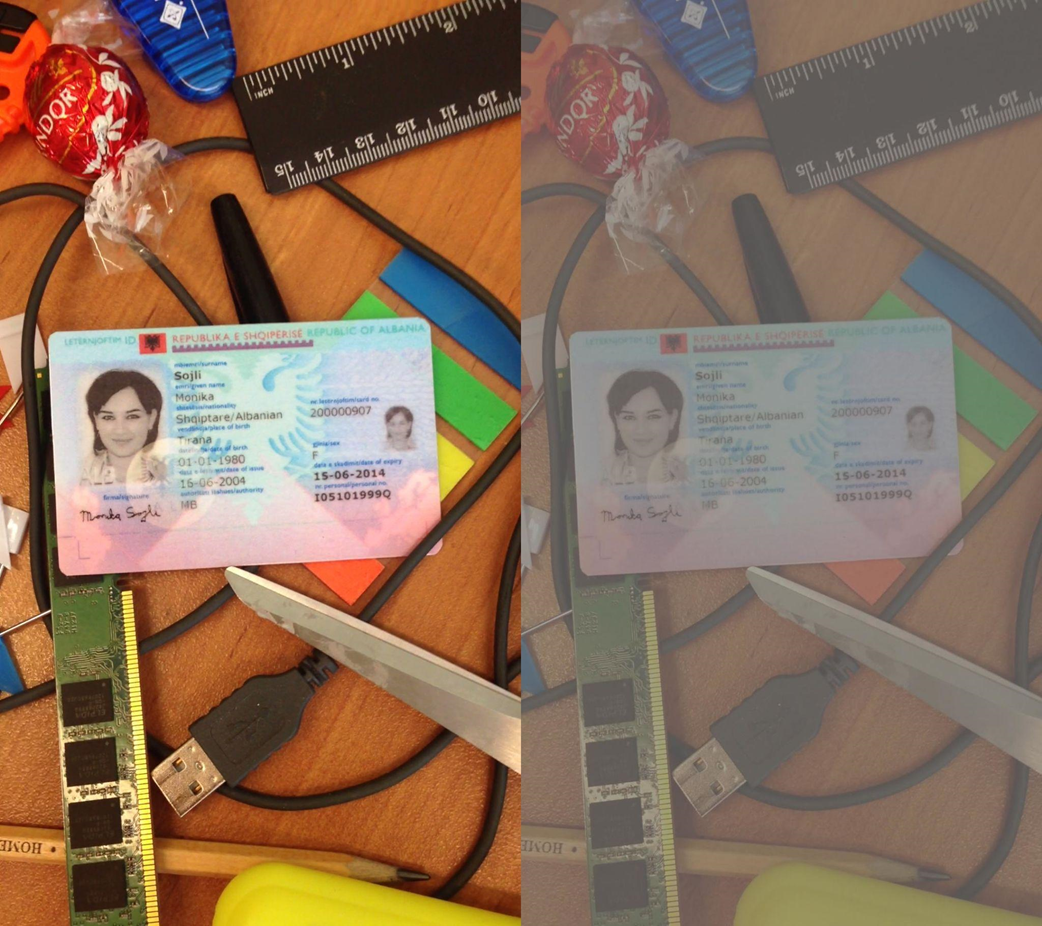
Before and after adjusting the brightness of the image. We have reduced the brightness of the original training image.
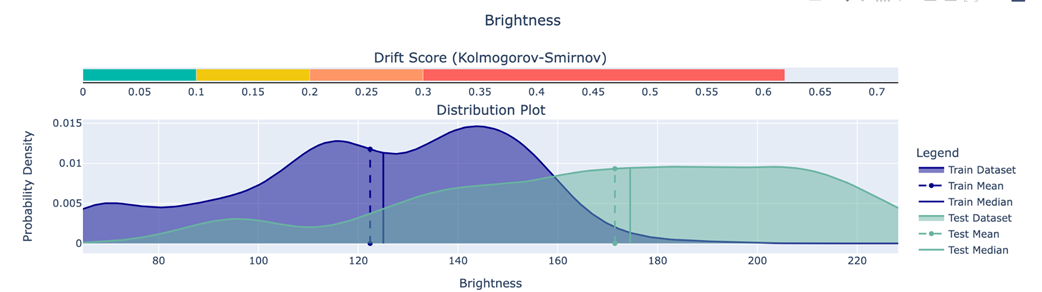
Difference in data distribution of brightness between train and test dataset.We can see the distribution of the test dataset has more variance than the train dataset.
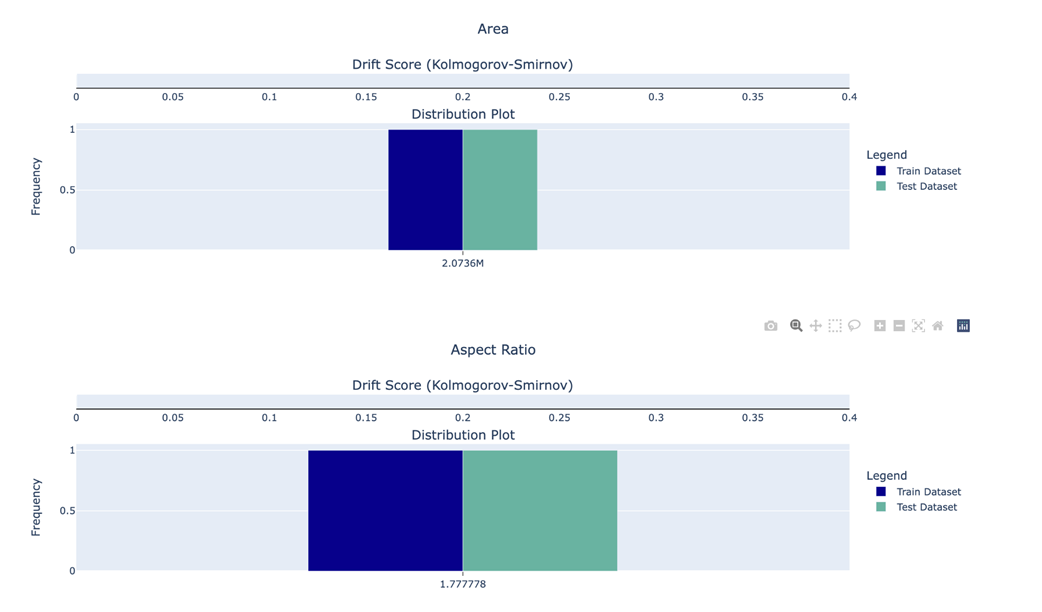
No difference in data distribution for aspect ratio and area
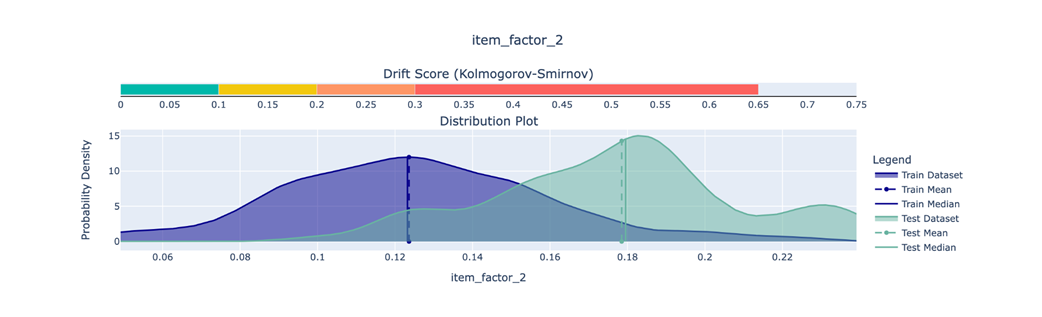
Differences in data distribution of item latent factors between training and test datasets
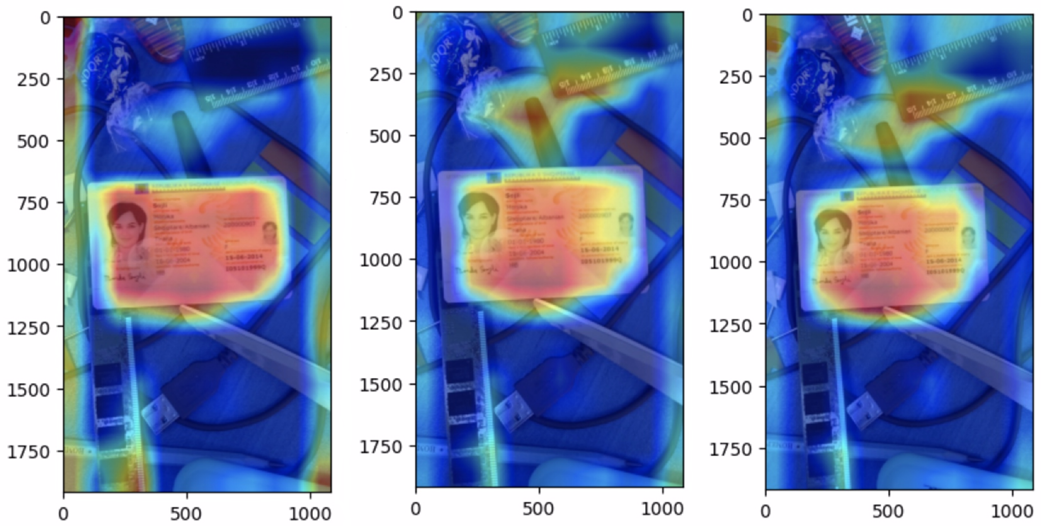
EigenCam heatmap visualizing the region of the image that contributes most to model’s decision making
Summary
- Monitoring ML applications is crucial for maintaining service reliability and performance. Basic monitoring involves tracking resource utilization and request metrics, which can be visualized using pre-built dashboards like those provided by BentoML.
- Custom metrics allow for tracking application-specific details, such as confidence scores in object detection or ranked movie counts in recommender systems. These custom metrics can be integrated into monitoring dashboards for better insights.
- Logging provides valuable context and detailed information for debugging and troubleshooting. Centralizing logs using tools like Loki enhances observability and facilitates efficient log analysis.
- Alerting is essential for proactive incident management. Setting up alert rules based on monitored metrics and logs, and using Alertmanager for routing notifications, ensures timely responses to critical issues.
- Data drift monitoring is important for maintaining model accuracy. Deepchecks provides tools to detect drift in various data types, including images and embeddings. Regularly monitoring for drift helps prevent model performance degradation.
- Model explainability is crucial for building trust and understanding AI decisions. Techniques like EigenCAM for object detection and model-based approaches for recommender systems provide insights into how models make predictions. Explainability enhances transparency and accountability in ML systems.

 Machine Learning Platform Engineering ebook for free