10 Graph feature engineering: manual and semi-automated approaches
This chapter explains how to turn graph elements into machine‑learnable vectors and frames feature engineering along a spectrum from manual to semi‑automated to fully automated approaches. It emphasizes the core trade‑off between interpretability and efficiency: hand‑crafted features are transparent and auditable, while more automated pipelines scale better but tend to be less explainable. The chapter focuses on techniques that keep humans in the loop—both to inject domain knowledge and to produce features that are understandable by analysts and amenable to reasoning by Large Language Models.
For nodes, the manual toolbox progresses from local to global structure: degrees (including domain‑aware variants such as fraud and legit degree), triangles (fraudulent, semi‑fraudulent, legitimate), egonet density, distances to specific node classes (e.g., shortest paths to fraudsters and path counts within 1–3 hops), and centralities like closeness, betweenness, and PageRank (plus a fraud‑weighted variant). These features are assembled into tabular datasets and used with standard classifiers (for example, logistic regression) to detect suspicious behavior while preserving explainability. For relationships, two strategies are presented: node‑based combinations that merge endpoint vectors (concatenation, average, L1/L2, Hadamard) and path‑based features that capture connection patterns via metapaths. To reduce hub bias in path counts, Degree‑Weighted Path Count (DWPC) down‑weights highly connected intermediates, enabling effective link prediction in domains such as drug repurposing. The chapter also shows how LLMs can accelerate this work by generating Cypher queries and scaffolding feature extraction code from high‑level specifications.
To bridge manual work and full automation, the chapter introduces ReFeX, a semi‑automated method that recursively aggregates local and egonet features (using sum/mean across neighborhoods) and prunes redundancy via correlation checks and binning. ReFeX yields interpretable, consistent, and transferable “regional” features that scale to larger graphs and remain robust across snapshots, while still benefiting from expert oversight. Although it focuses on topology and may omit attribute or edge‑type nuances without customization, ReFeX offers a practical middle ground when domain knowledge is limited or rapid, explainable feature generation is needed. The chapter closes by positioning these techniques as a solid, transparent foundation for downstream tasks in fraud detection and drug discovery, and as a springboard toward the fully automated representation learning methods that follow.
An example of a fraudulent social network. The white nodes represent legit people or people for whom we don’t know if they are fraudsters or not. The black nodes represent fraudsters.

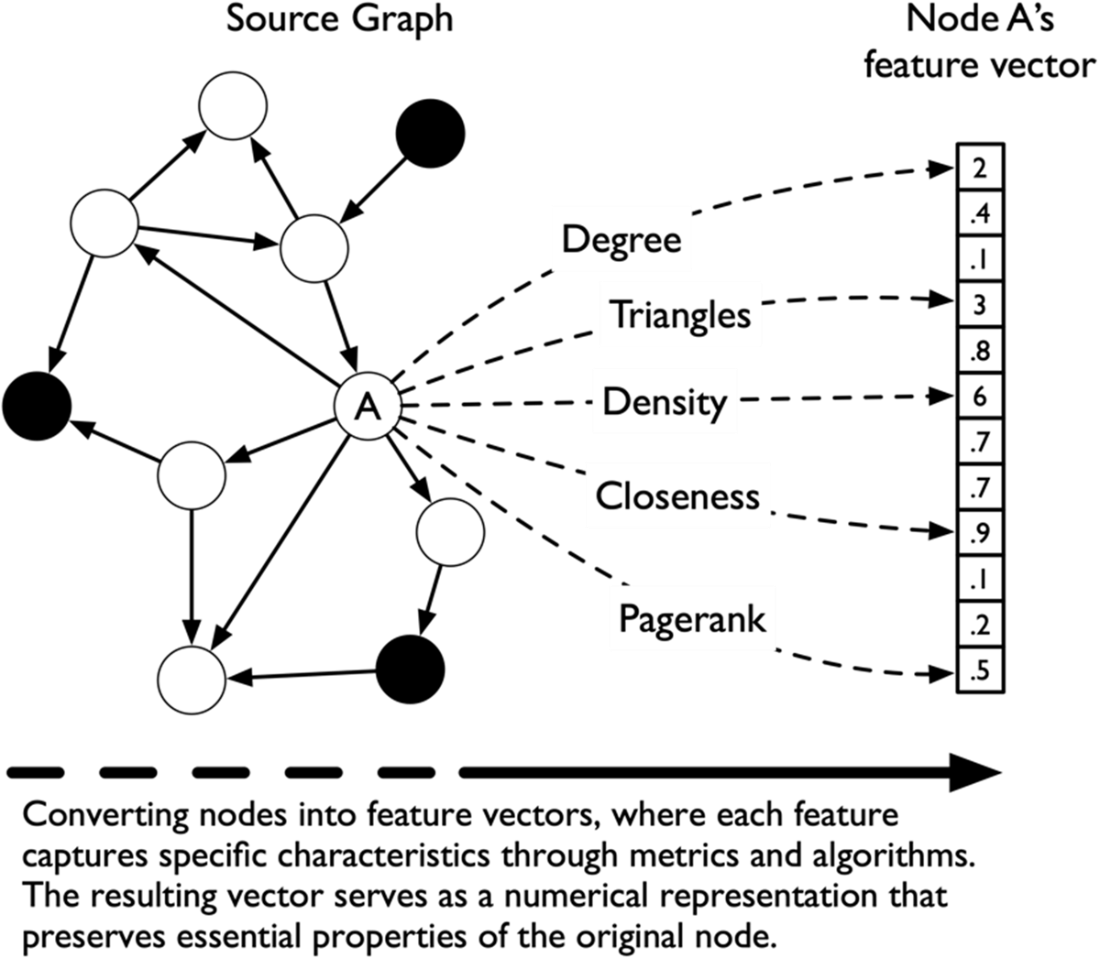
Node feature extraction: using metrics and graph algorithms to transform nodes into numerical feature vectors that capture their key characteristics.
An example of three connected nodes forming a triangle (or not). If each node is connected to the other two, they constitute a triangle.

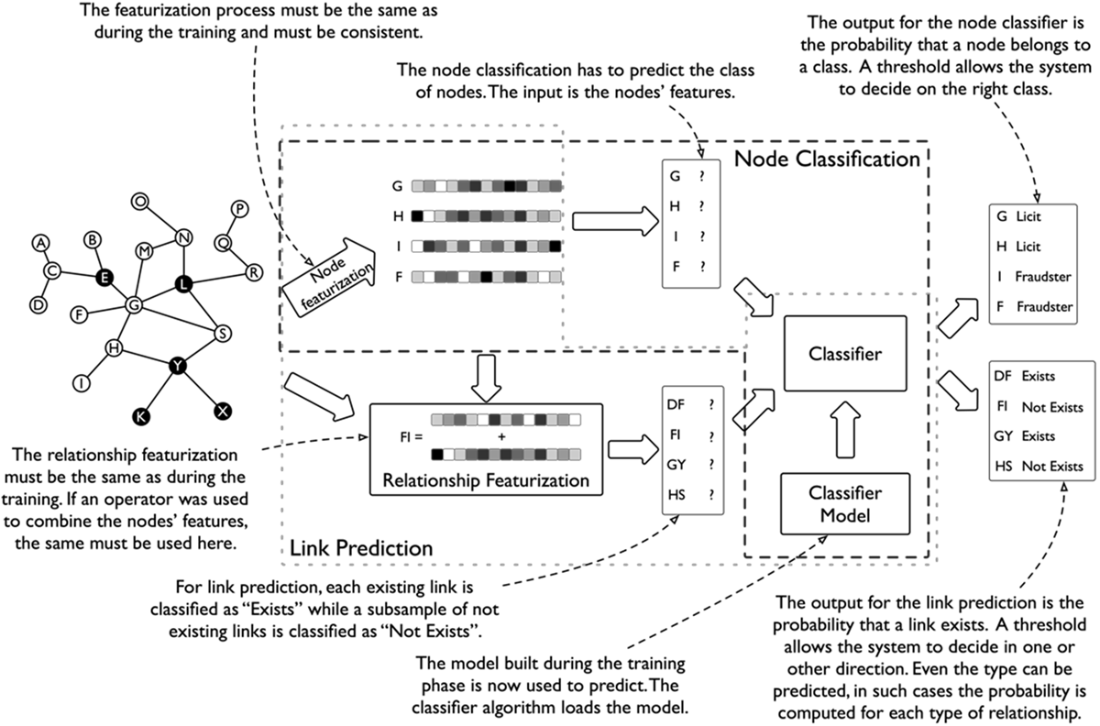
A typical relationship prediction, compared with the node classification, process as it has been presented in the previous chapter.
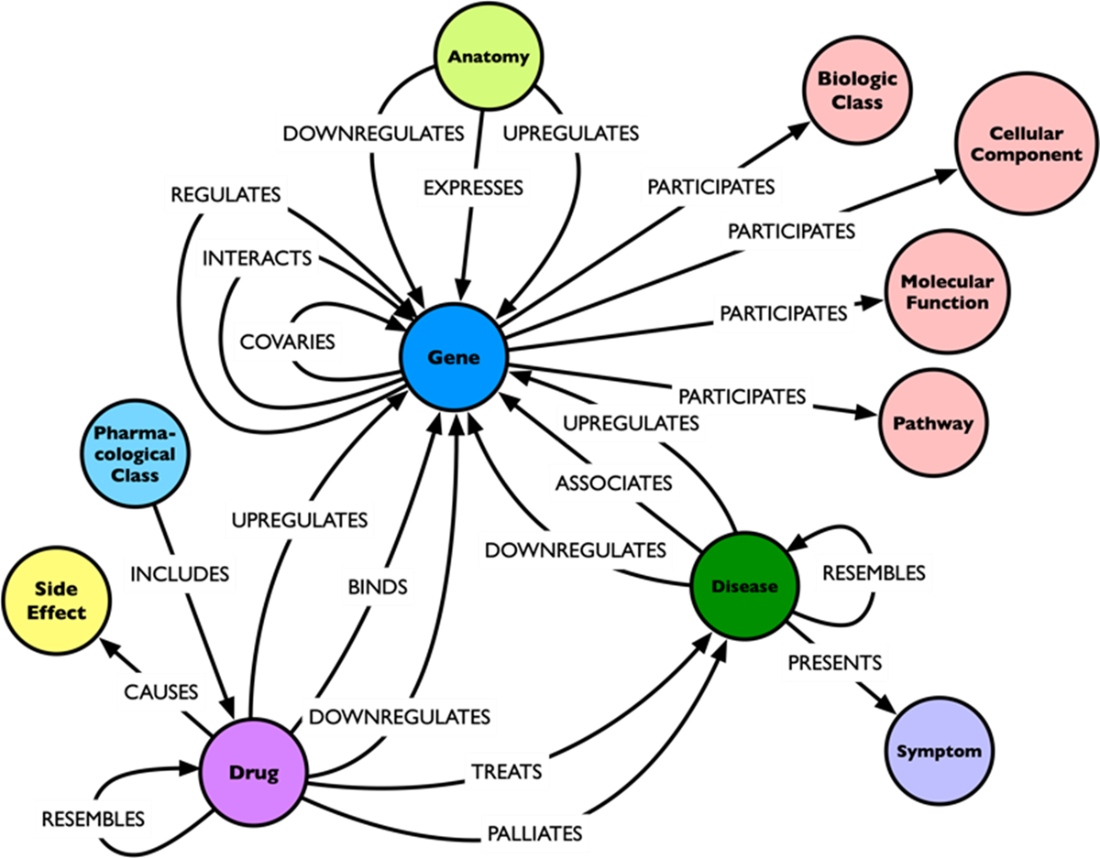
Hetionet schema as it was presented in chapter 4. For details on the project and the schema refer to the chapter.
Metagraph and metapaths examples from Hetionet.
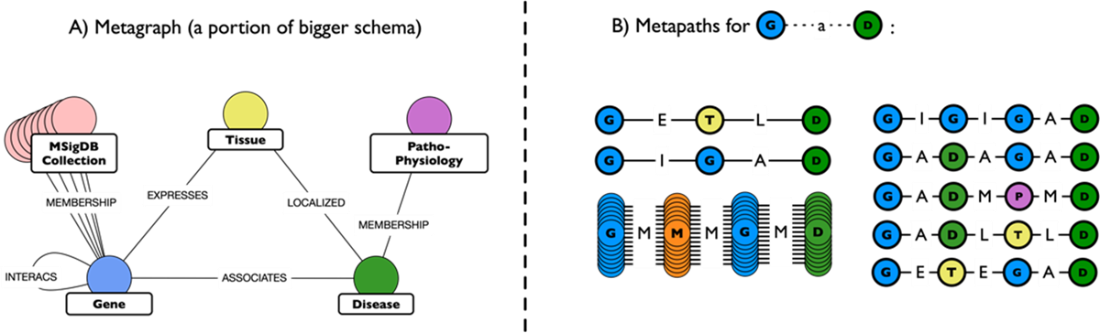
Metapath-based features definition for the relationships between compounds and diseases.

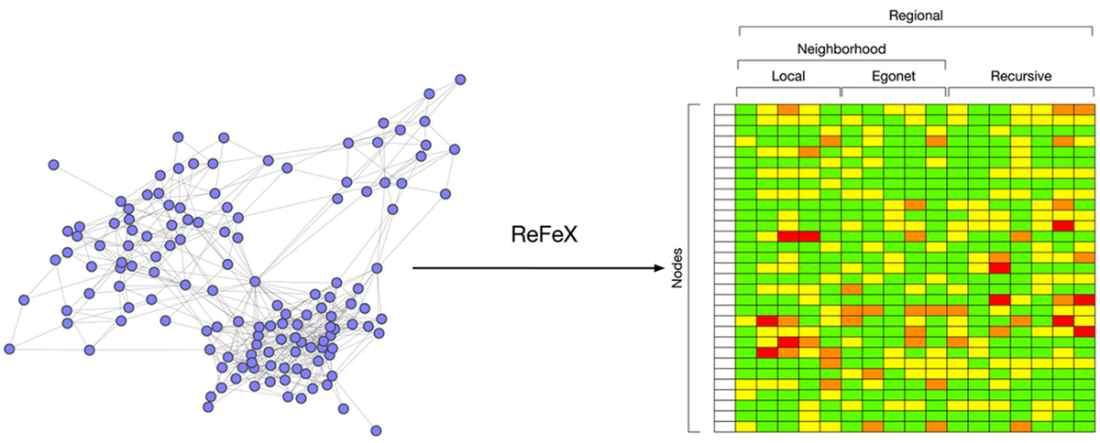
ReFeX converts each node in a vector representing the node’s topological feature at different scales [8]
The same simple fraudulent network as in Figure 10.1. In this case, the color of the nodes will be ignored since ReFeX doesn’t consider the type of the nodes.
Visual description of a few iterations of the ReFeX process. At each iteration, each node passes its values (degree, previous sums, etc.) to the neighbors that will aggregate.

Reference
- A. Negro, Graph-Powered Machine Learning. Shelter Island, NY, USA: Manning Publications, 2021
- F. Fouss, M. Saerens, and M. Shimbo, "Algorithms and Models for Network Data and Link Analysis." Cambridge, UK: Cambridge University Press, 2016. Accessed: May 15, 2024 [Online]. Available: https://doi.org/10.1017/CBO9781316418321
- T. H. Cormen, C. E. Leiserson, R. L. Rivest, and C. Stein, "Introduction to Algorithms," 4th ed. Cambridge, MA, USA: MIT Press, 2022
- B. Baesens, V. Van Vlasselaer, and W. Verbeke, "Fraud Analytics Using Descriptive, Predictive, and Social Network Techniques: A Guide to Data Science for Fraud Detection." Hoboken, NJ, USA: Wiley, 2015
- D. S. Himmelstein, A. Lizee, C. Hessler, et al., "Systematic integration of biomedical knowledge prioritizes drugs for repurposing," eLife, vol. 6, no. e26726, Oct. 2017. Accessed: May 15, 2024 [Online]. Available: https://doi.org/10.7554/eLife.26726
- D. S. Himmelstein, "Our hetnet edge prediction methodology: the modeling framework for Project Rephetio," ThinkLab, 2016. Accessed: May 15, 2024 [Online]. Available: https://doi.org/10.15363/thinklab.d210
- D. S. Himmelstein, "Dhimmel/Learn V1.0: The Machine Learning Repository For Project Rephetio," Zenodo, 2017. Accessed: May 15, 2024 [Online]. Available: https://doi.org/10.5281/zenodo.268654
- K. Henderson, B. Gallagher, L. Li, L. Akoglu, T. Eliassi-Rad, H. Tong, and C. Faloutsos, "It's Who You Know: Graph Mining Using Recursive Structural Features," in Proceedings of the 17th ACM SIGKDD International Conference on Knowledge Discovery and Data Mining, San Diego, CA, USA, 2011, pp. 663-671. Accessed: May 15, 2024 [Online]. Available: https://doi.org/10.1145/2020408.2020512
FAQ
What is graph feature engineering and why is it necessary for machine learning on graphs?
Most ML algorithms (logistic regression, random forests, deep nets) require numeric vectors, not raw graph structures. Graph feature engineering transforms nodes, relationships, or whole graphs into vectors that capture structural properties (for example, degree, triangles, centrality). The quality and relevance of these vectors strongly influence downstream performance for tasks like node classification, link prediction, and graph-level analysis.How do manual, semi-automated, and fully automated approaches compare, and what are the trade-offs?
- Manual features: highly interpretable and domain-aligned, but time-consuming and bespoke.- Semi-automated features (for example, ReFeX): generate broad, interpretable structural features with minimal manual effort; good balance of coverage and transparency.
- Fully automated (representation learning, covered later): highly scalable and task-adaptive, but often less interpretable. In practice, choose based on interpretability needs, available expertise, data scale, and time-to-value.
What’s the difference between local and global node features?
- Local features: derived from a node’s immediate neighborhood (egonet) or small-radius neighborhoods. Examples: total degree, triangles, egonet density, counts of paths within 1–3 hops to specific node types (for example, fraudsters).- Global features: capture a node’s role in the broader network. Examples: betweenness, closeness, PageRank, eigenvector centrality. These reflect influence, reachability, and connectivity patterns beyond the local vicinity.
How do degree-based features help in fraud detection?
Degree measures are simple yet powerful signals:- total_degree: number of neighbors
- fraud_degree and legit_degree: neighbors split by known labels (for example, fraudster vs legitimate).
If a node is directly connected to many fraudsters (high fraud_degree), its risk of being fraudulent or influenced by fraud increases. This domain-aware refinement of degree often improves classification accuracy.
What do triangle-based features capture and how are they specialized for fraud use cases?
Triangles indicate tightly knit local structure (friends of friends are connected). Specializations help model contagion or influence:- total_triangles: all triangles a node participates in
- fraud_triangles: triangles where both other nodes are fraudsters
- legit_triangles: triangles where both other nodes are legitimate
- semi_fraud_triangles: mixed triangles (one fraudster, one legitimate)
How is egonet density computed and when is it useful?
Egonet density measures how interconnected a node’s neighborhood is. For an egonet with N nodes and M observed edges, density = M / [N(N − 1)/2]. High density signals cohesive, potentially high-trust clusters; lower density suggests sparse, broker-like neighborhoods. In fraud analysis, density complements degree and triangles to describe local cohesion.What are geodesic (shortest-path) features and why do they matter?
Geodesic features capture how close a node is to risky or influential nodes and the breadth of short connections:- geodesic_path: shortest distance to any fraudster (or other target class)
- #1-hop, #2-hop, #3-hop paths to fraudsters: counts of paths within 1–3 hops
How do closeness, betweenness, and PageRank differ and when should I use each?
- Closeness: inverse of the average shortest path to reachable nodes. High closeness means a node can reach others quickly; useful for identifying fast spreaders/influencers.- Betweenness: fraction of shortest paths between other node pairs that pass through the node. High betweenness flags bridges or bottlenecks; useful for controlling information flow and spotting chokepoints (potentially key facilitators of fraud).
- PageRank: importance derived from connections to other important nodes. A fraud-weighted variant boosts influence from known fraudsters, surfacing nodes with disproportionate exposure to risky peers.
How can I represent relationships (links) for link prediction: node-based vs path-based?
Two main strategies:- Node-based combination: build an edge vector by combining the two node vectors with operators like concatenation, average, L1 (|u − v|), L2 ((u − v)^2), or Hadamard (u * v). Simple and fast; performance depends on node feature quality.
- Path-based features: describe structural connectivity between nodes using counts/patterns of paths and metapaths. In heterogeneous graphs (for example, drug–gene–disease), degree-weighted path count (DWPC) discounts paths through hubs and yields more meaningful signals than raw path counts.
What is ReFeX and why is it a strong semi-automated option?
ReFeX (Recursive Feature eXtraction) automatically generates interpretable structural features by:- Extracting local features (for example, degree),
- Adding egonet features (for example, egonet size, edges, density),
- Recursively aggregating neighbor features using sum/mean across iterations (regional patterns),
- Pruning highly correlated or redundant features.
 Knowledge Graphs and LLMs in Action ebook for free