Appendix B. DOD vs. OOP architecture performance example
This appendix builds a real-world benchmark to compare data-oriented design (DOD) and object-oriented programming (OOP) in Unity by stress-testing a simple survival game on target devices. The goal is to maximize the number of enemies interacting on screen while maintaining 60 fps. To keep runs comparable, player input is removed and identical enemy-to-enemy collision work is added: collisions are detected via pairwise distance checks, then resolved by moving both enemies to opposite sides of their midpoint and updating directions. A frame-windowed controller repeatedly averages delta times over a configurable number of frames (60), doubles the spawn amount while the average stays above ~59 fps, and rolls back to the last “good” count and resets spawn rate to 1 if it dips below. Supporting data (EnemyCount, EnemyCountGood stack, SpawnRate, DeltaTime ring with counts, board bounds, shared EnemyVelocity) is added to GameData/Balance, and all loops switch from fixed counts to the dynamic gameData.EnemyCount.
The OOP version introduces an EnemyOOP MonoBehaviour with per-object state (direction, velocity, bounds) stored on the component and position held in the Transform. Each object moves in Update, bounces off walls using shared logic, and resolves collisions via squared-distance checks to avoid square roots, repositioning around the midpoint and updating directions. A Board manages a pre-instantiated pool of EnemyOOP objects, activating/deactivating them as EnemyCount changes; TickOOP handles collisions and calls the shared TryChangeEnemyCount() to adjust load. The DOD version keeps the same behaviors but stores positions/directions in tightly packed arrays and processes them with cache-friendly loops (HandleEnemyToEnemyCollisionDOD). Its Board uses pooled GameObjects plus a parallel active array to show/hide instances; both simulations share the spawn/FPS control logic. A Game wrapper sets a high target frame rate (120), lets the user start either simulation, and routes per-frame ticks accordingly.
Across multiple devices the DOD simulation sustains roughly ten times more enemies than the OOP version at 60 fps. The improvement stems from data locality: contiguous arrays in DOD align with CPU cache behavior, minimizing cache misses and memory stalls, whereas scattered object state in OOP forces frequent cache line evictions and main-memory waits. The appendix reinforces best practices such as preallocating pools, avoiding allocations in hot paths, measuring FPS over stable windows (and storing per-frame deltas to filter outliers), and always validating performance on the target device rather than the editor.
Figure B.1 Screenshots of our simulation running on an iPhone 16 Pro. The left screenshot shows the main menu where we can select to run either the DOD or OOP simulations. The middle screenshot shows the DOD simulation running after maximizing the number of enemies. The rightmost screenshot is the OOP simulation running after maximizing the number of enemies.
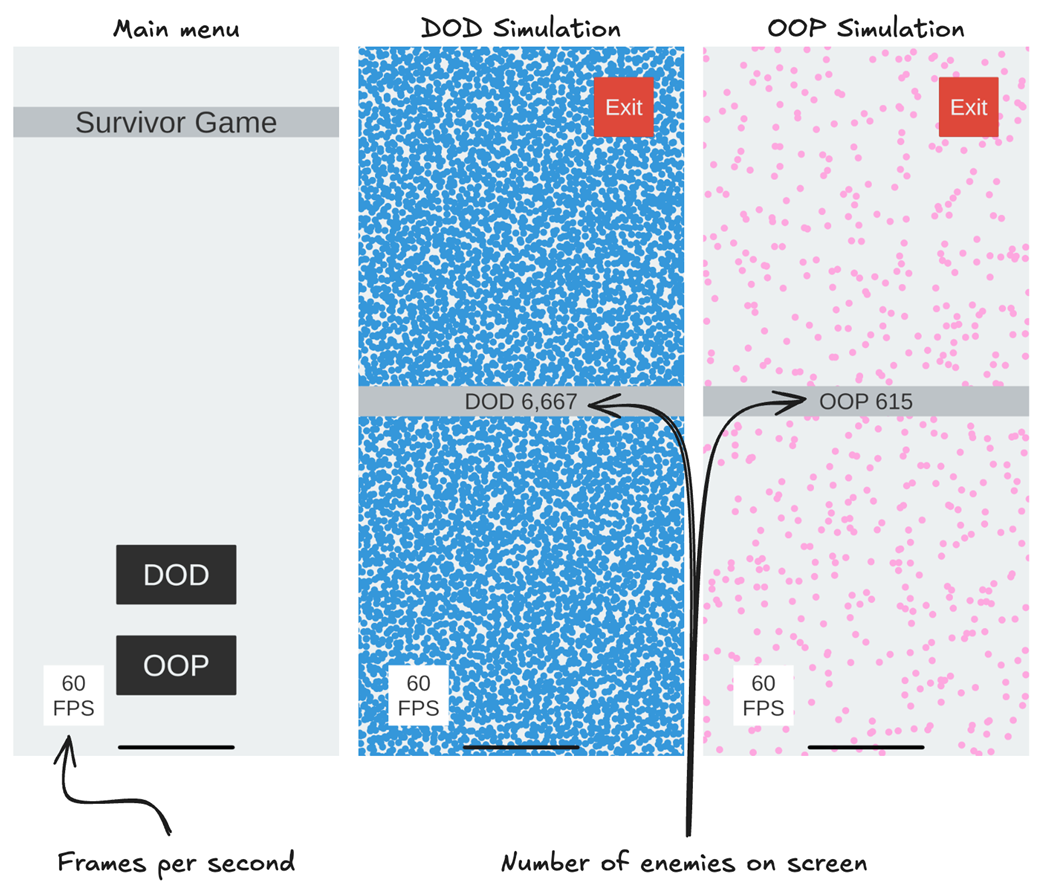
Figure B.2 Explanation of how collision detection and response work in our simulation. We use distance to determine if two enemies have collided, then calculate their midpoint and move them in opposite directions.
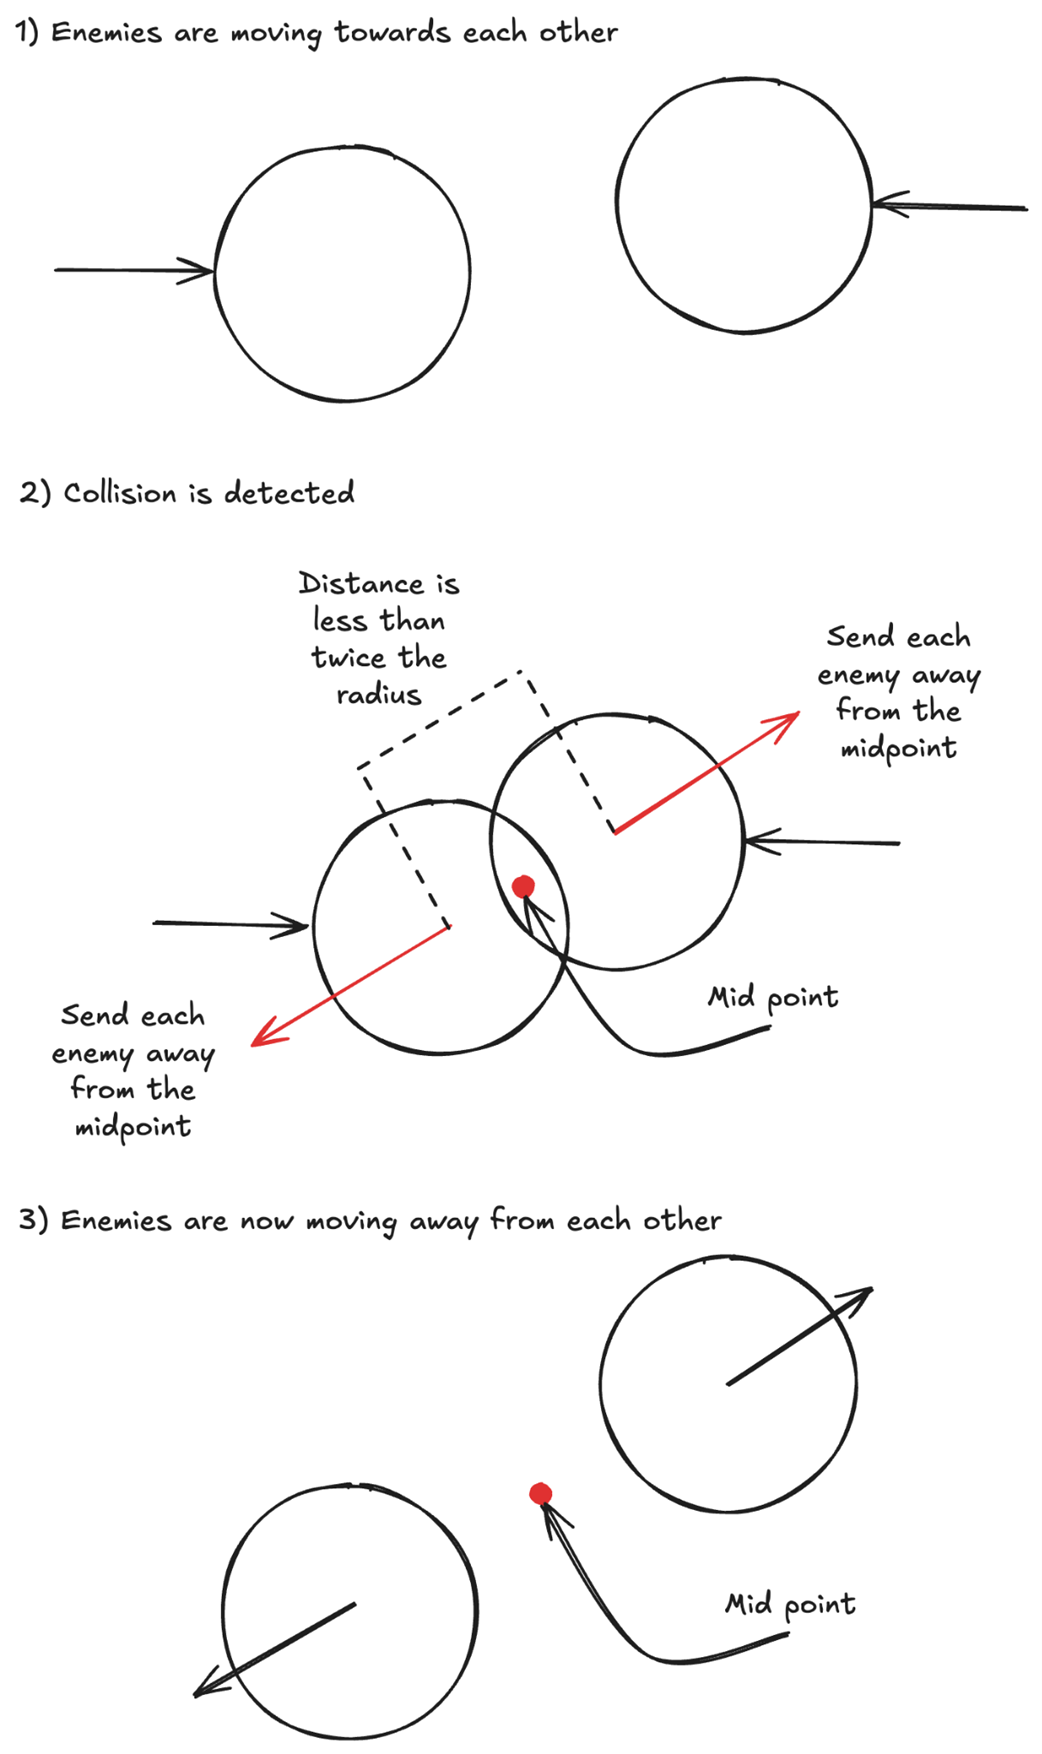
Figure B.3 The logic we use to maximize the number of enemies on screen while maintaining 60fps.
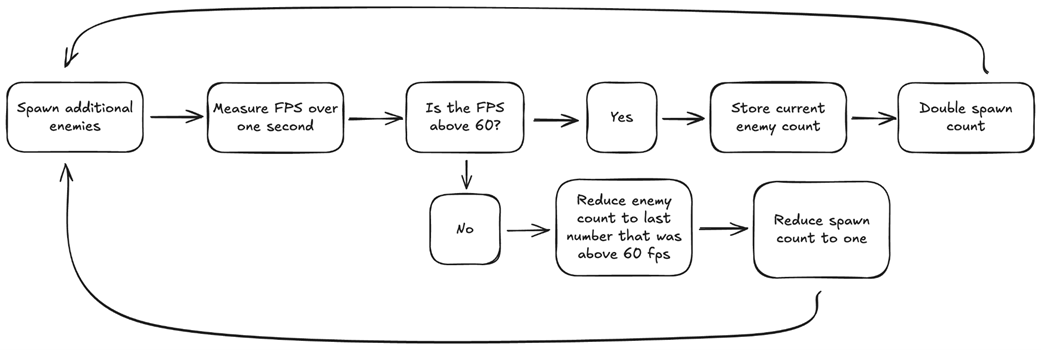
Figure B.4 We start the game with an enemy count of 0, and spawn one enemy, for a total of one enemy on the screen. Then we spawn two enemies for a total of three, then four for a total of seven, etc. We continue spawning double the number of enemies until our fps drop below 60. When that happens, we drop our spawn count to one and reduce our enemy count to the last amount above 60 fps. This way, our algorithm should find the maximum number of enemies it can simulate while maintaining 60fps.
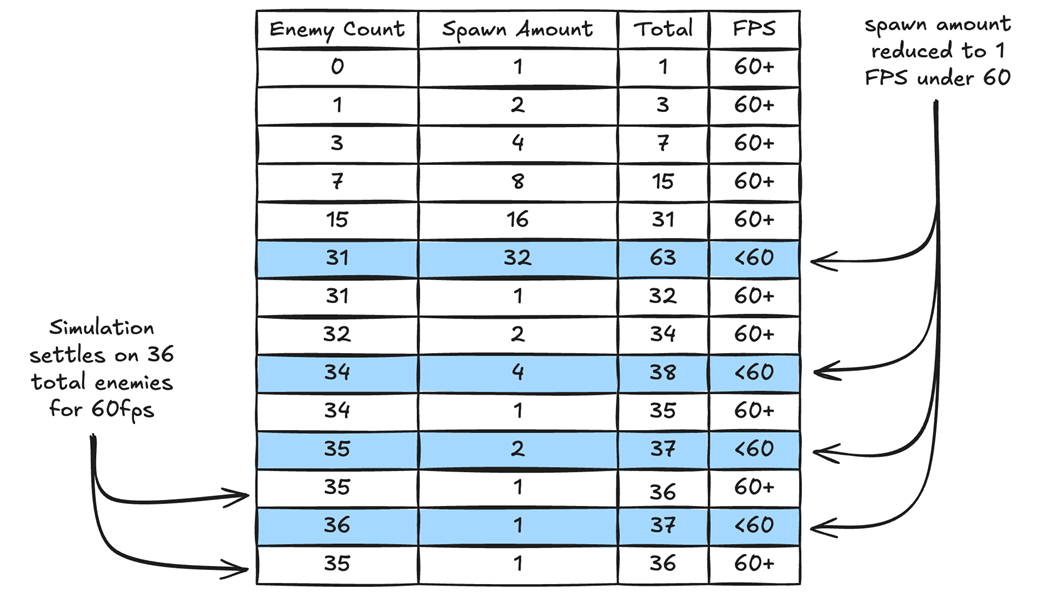
Figure B.5 All our enemies are the same size, so we only need the radius data to calculate whether two enemies are touching. The distance between the centers of two enemies will be twice their radius if they are touching.
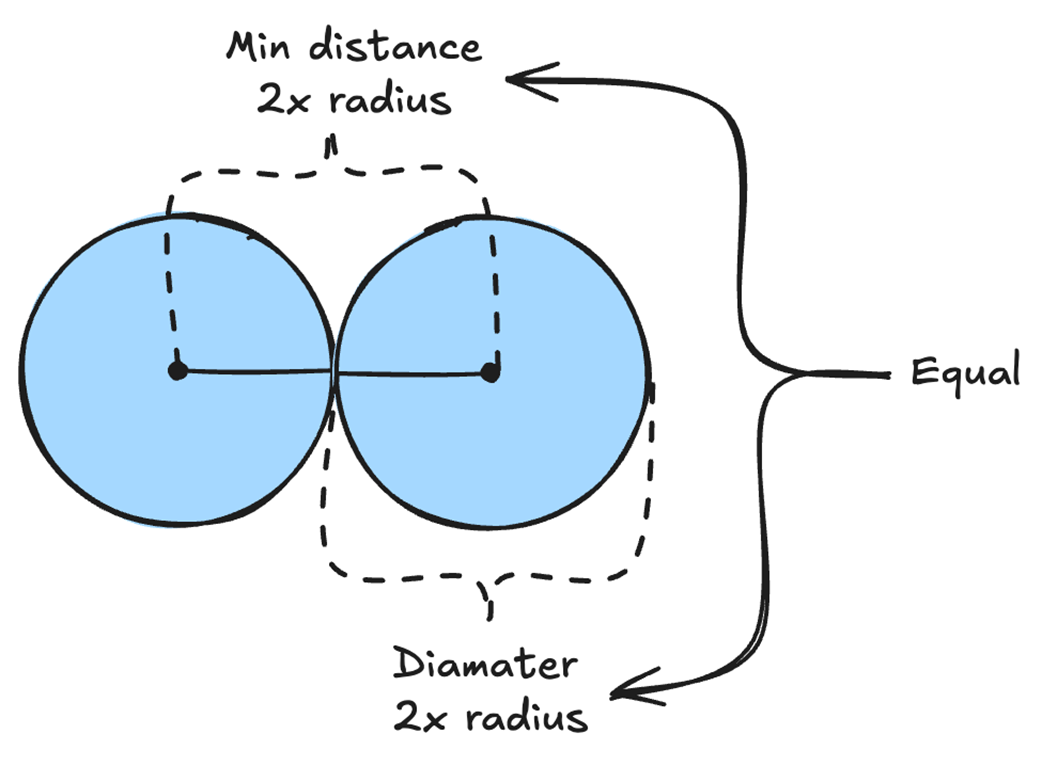
Figure B.6 Instead of calculating the square root to determine the distance, we can just square the distance.
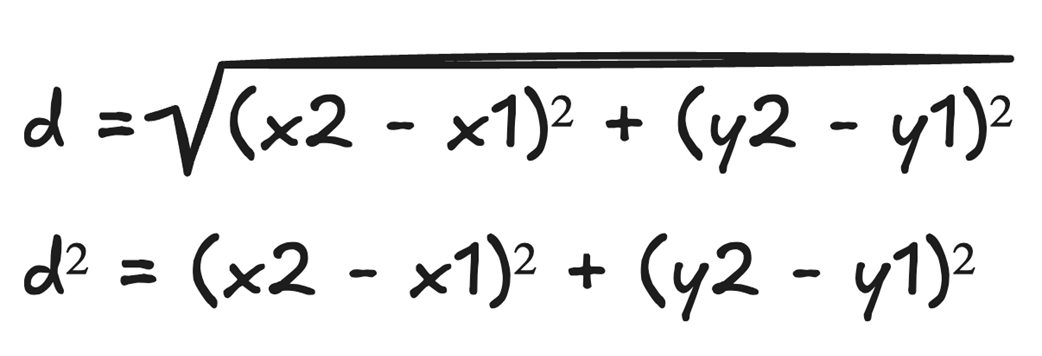
Figure B.7 Once the collision between two enemies is detected, we move them away from each other as if they never collided, so we don’t mistakenly calculate them as having collided again in the next frame.
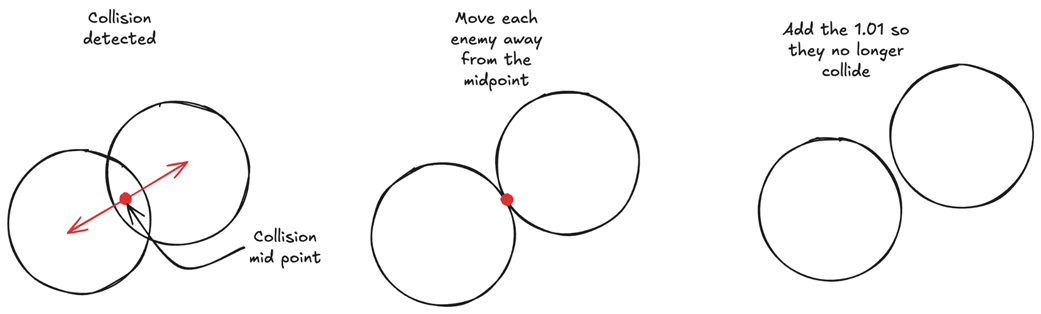
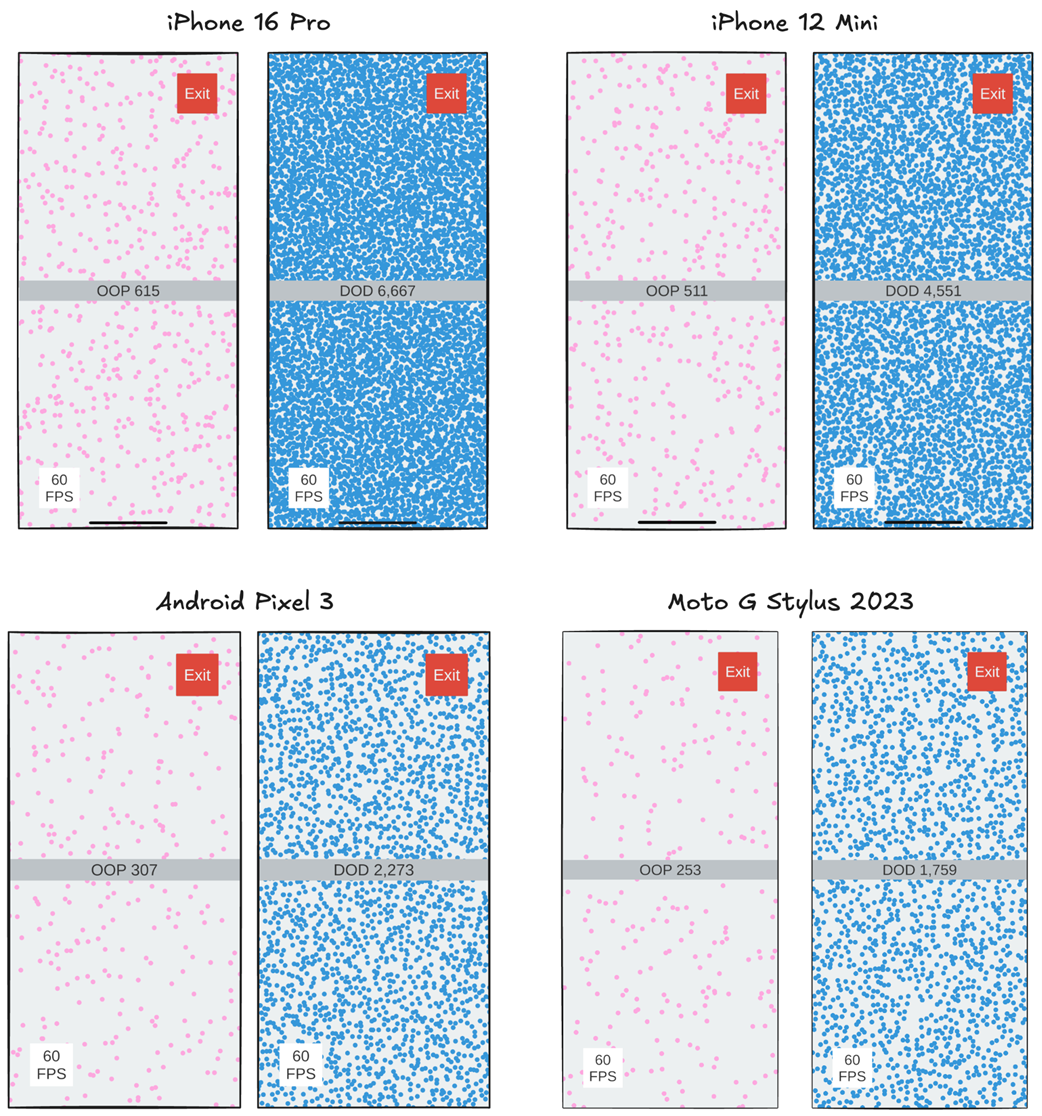
Figure B.8 OOP vs DOD simulation result on four different devices. For each device, the left screen is the OOP simulation, and the right screen is the DOD simulation. The results show that we can simulate roughly 10x more enemies using data-oriented design.
B.6 Conclusion
The best way to see how much data-oriented design can improve our game is through real-world examples. Creating a simulation from the game we wrote in Chapters 4 and 5, using DOD nets us roughly a 10x improvement over OOP in terms of performance. All we did was structure our data using arrays to leverage data locality, just as we learned in Chapters 1, 2, and 3.
 High Performance Unity Game Development ebook for free