8 Machine learning
This chapter demystifies machine learning by showing how data-driven patterns support real-world decisions. It frames problems into supervised, unsupervised, and reinforcement learning, and emphasizes representing data as features (x) and targets (y). A pragmatic workflow runs through the entire narrative: understand the domain, collect and clean data, train a model, test it on unseen data, and iterate to improve. Throughout, the text stresses that good outcomes depend as much on context and preparation as on algorithms.
Before modeling, the chapter tackles data preparation: handling missing values (removal, mean/median or mode substitution, and advanced estimation), resolving inconsistencies, and encoding categorical variables (one-hot versus label encoding). It then builds intuition for linear regression—fitting a line with least squares, computing slope and intercept, and interpreting predictions—alongside practical considerations like scaling, proper train/test splits, and evaluating fit via R². Common pitfalls such as underfitting and overfitting are introduced with remedies that include better data, more informative features, revised preparation, or swapping algorithms.
For classification, the chapter implements decision trees (CART), showing how the model learns questions that partition data to reduce uncertainty. It explains Gini impurity, entropy intuition, and information gain to choose effective splits, recursively growing the tree and pruning to avoid overfitting. Model assessment moves beyond raw accuracy to confusion-matrix–derived metrics such as precision, recall, specificity, and overall accuracy. The chapter closes by situating trees and linear regression among broader options (e.g., SVMs, ensembles, clustering, and deep learning) and highlights high-impact applications including fraud and threat detection, personalized recommendations, dynamic pricing, and health risk prediction.
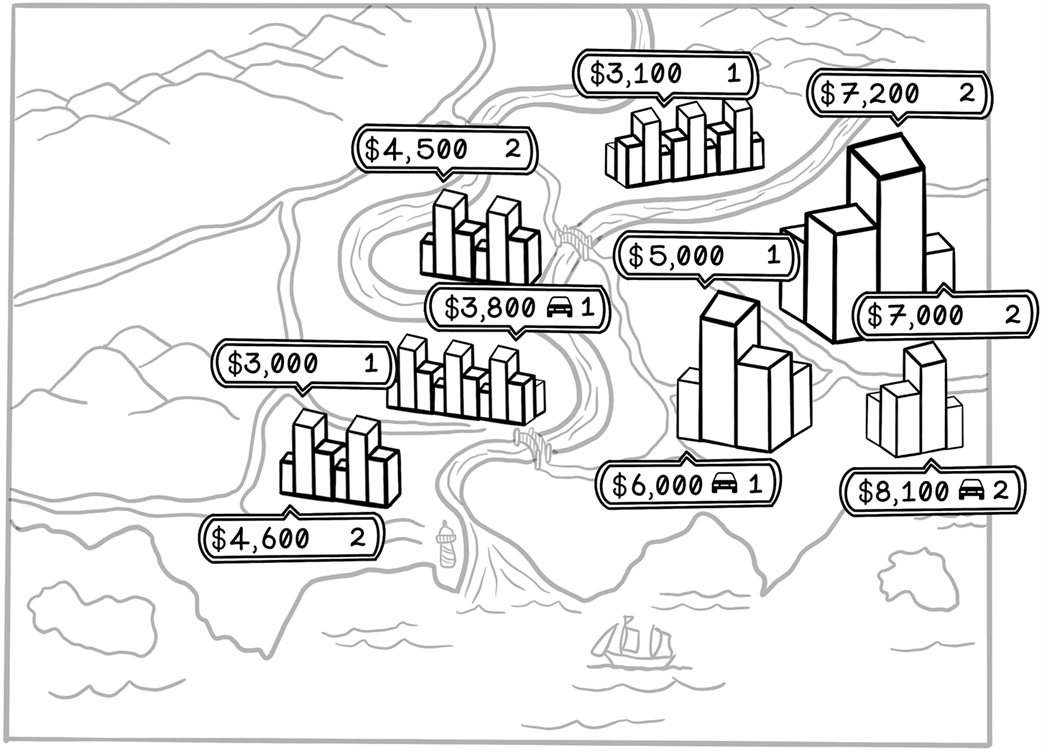
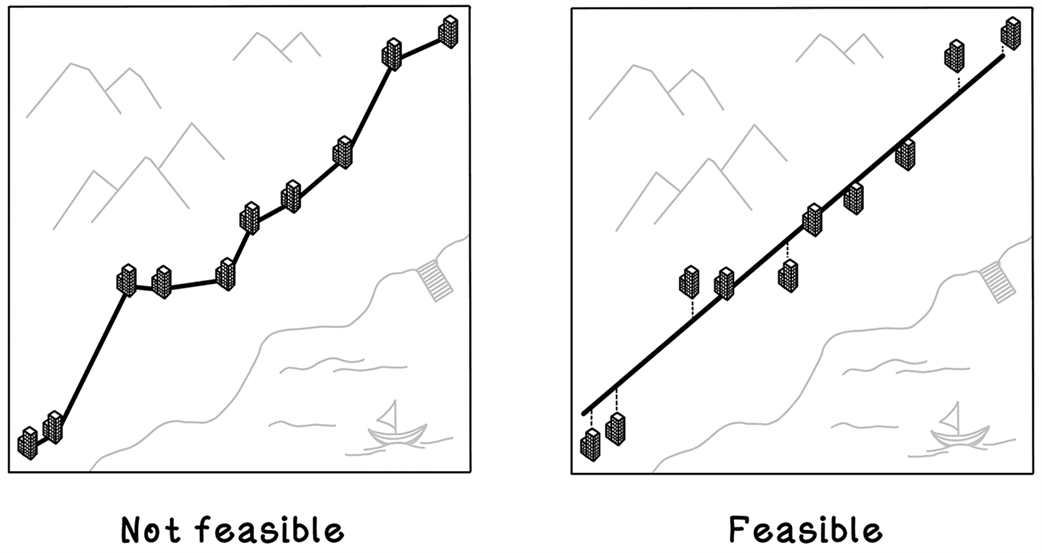
An illustration of property prices and features in different regions
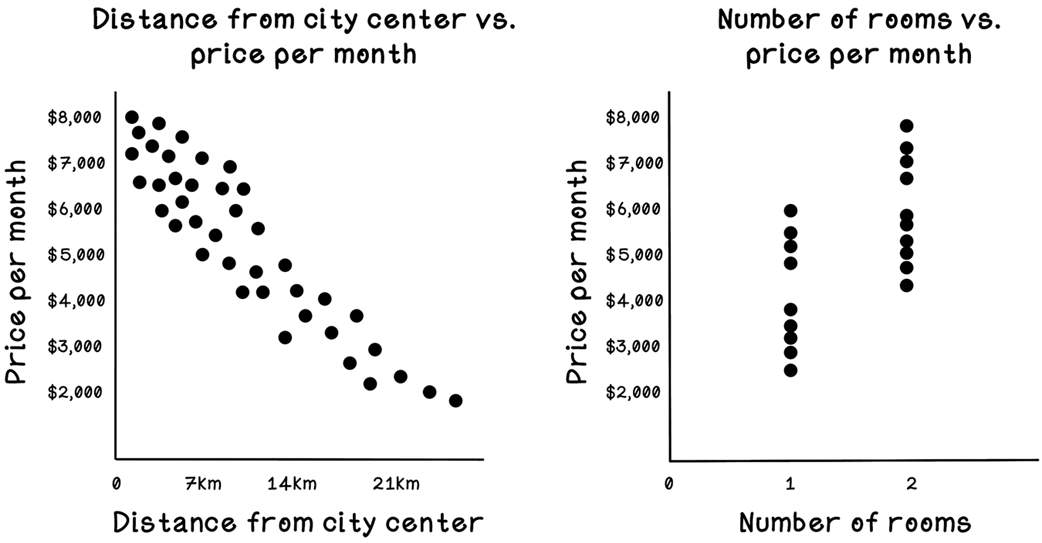
Example visualization of relationships among data
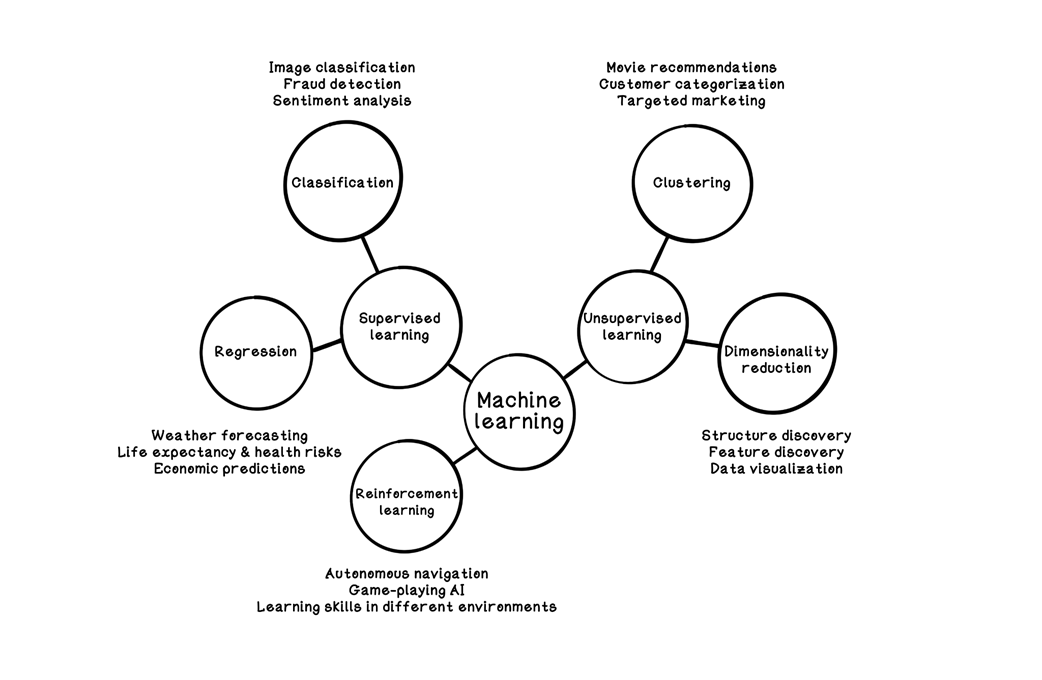
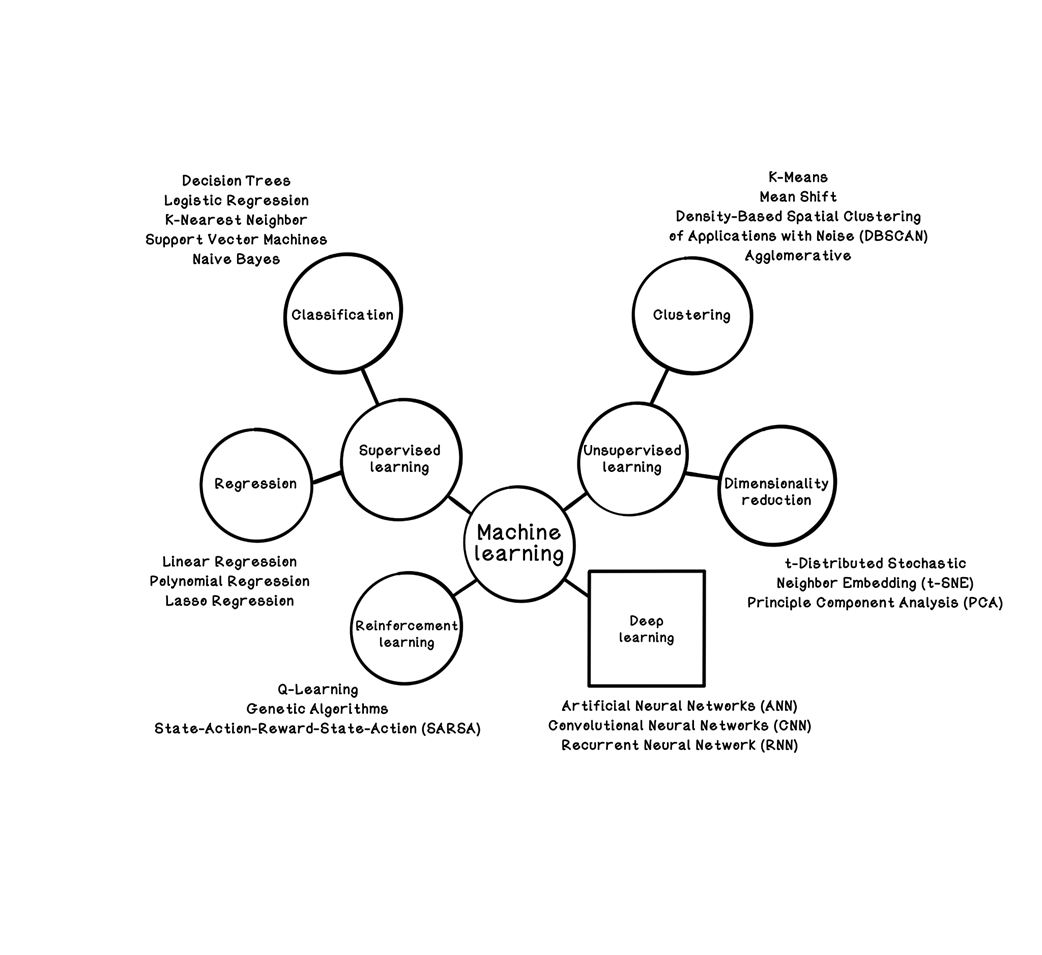
Categorization of machine learning and uses
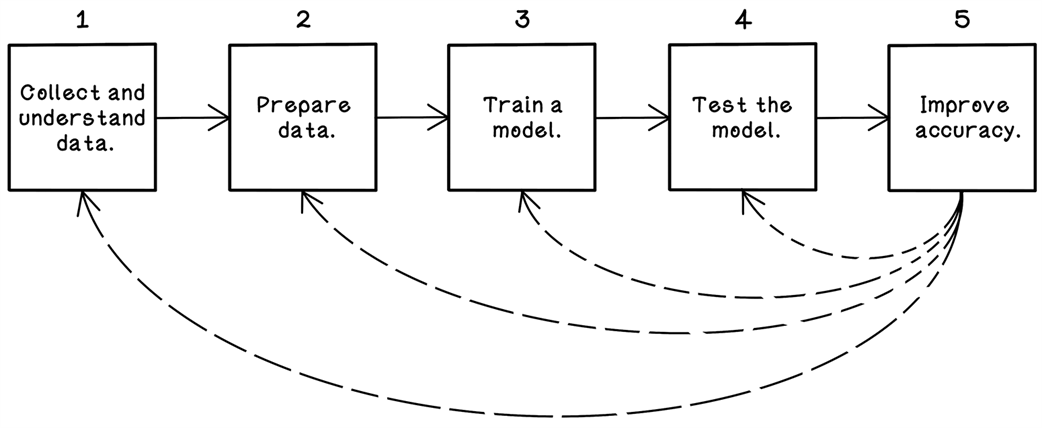
A workflow for machine learning experiments and projects
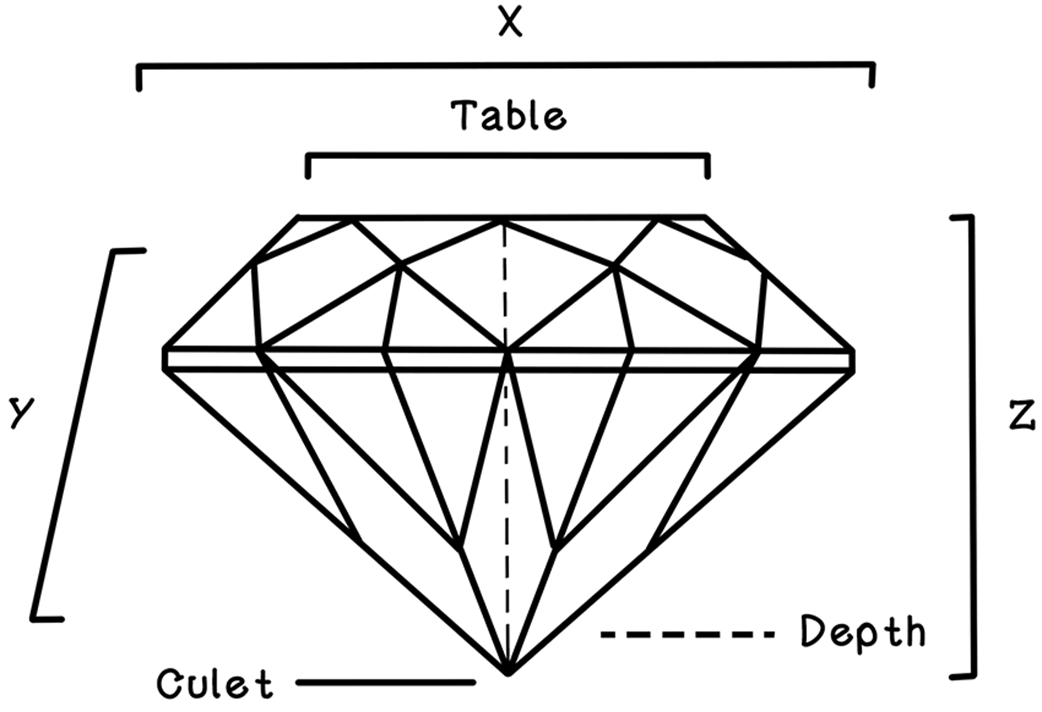
Terminology of diamond measurements

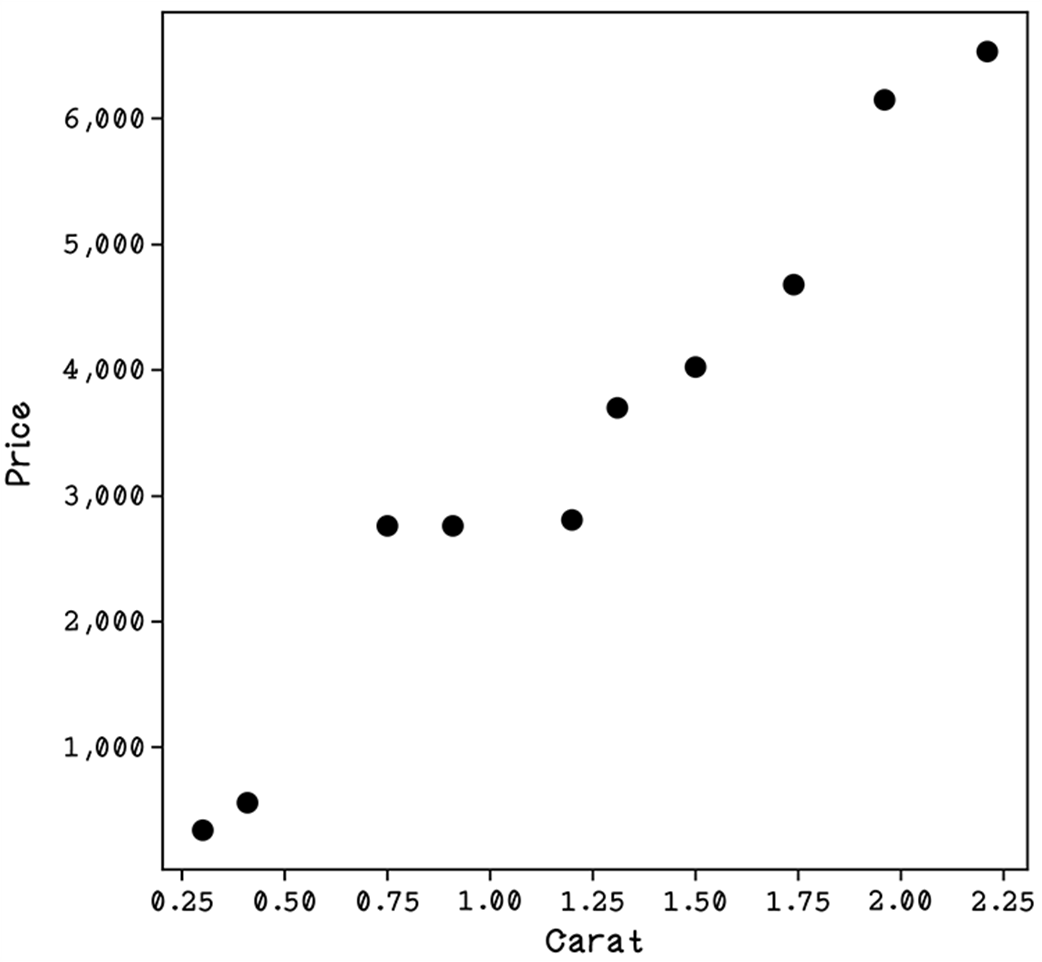
A scatterplot of carat and price data
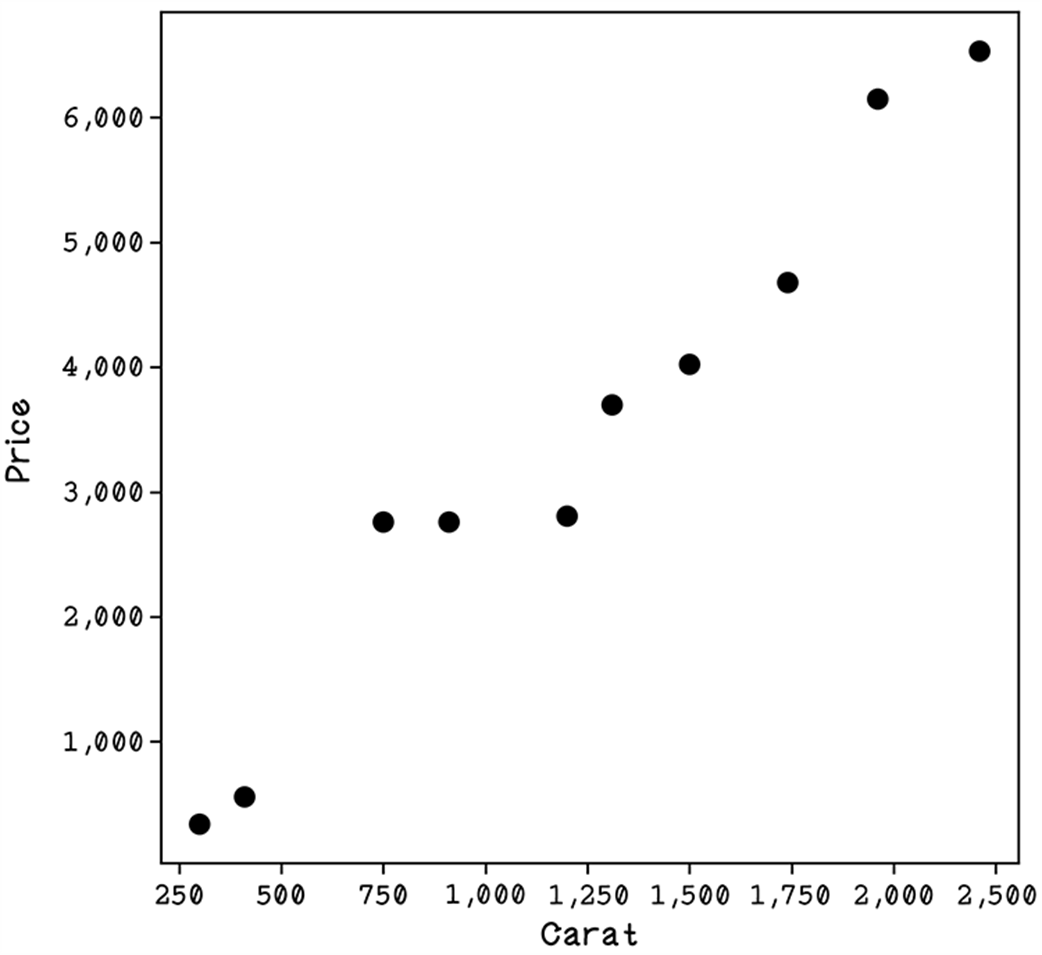
A scatterplot of carat and price data
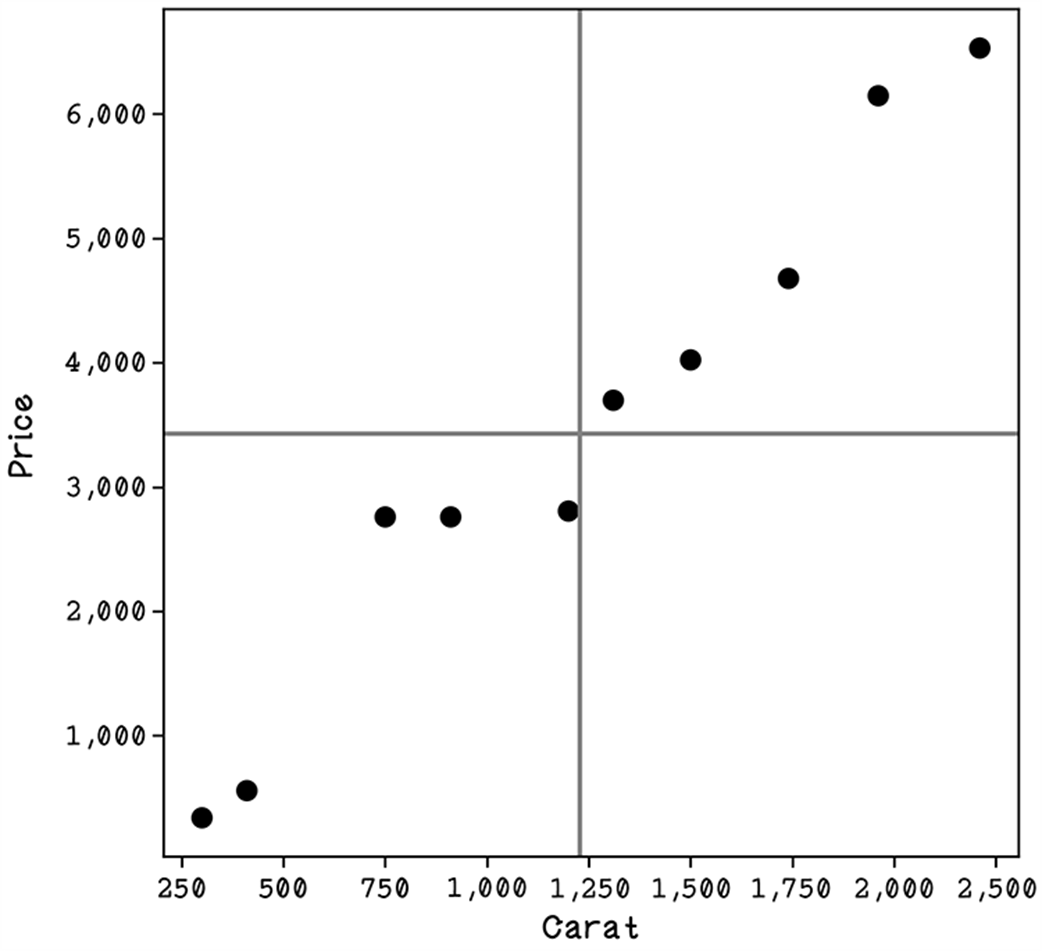
The means of x and y represented by vertical and horizontal lines
Possible regression lines
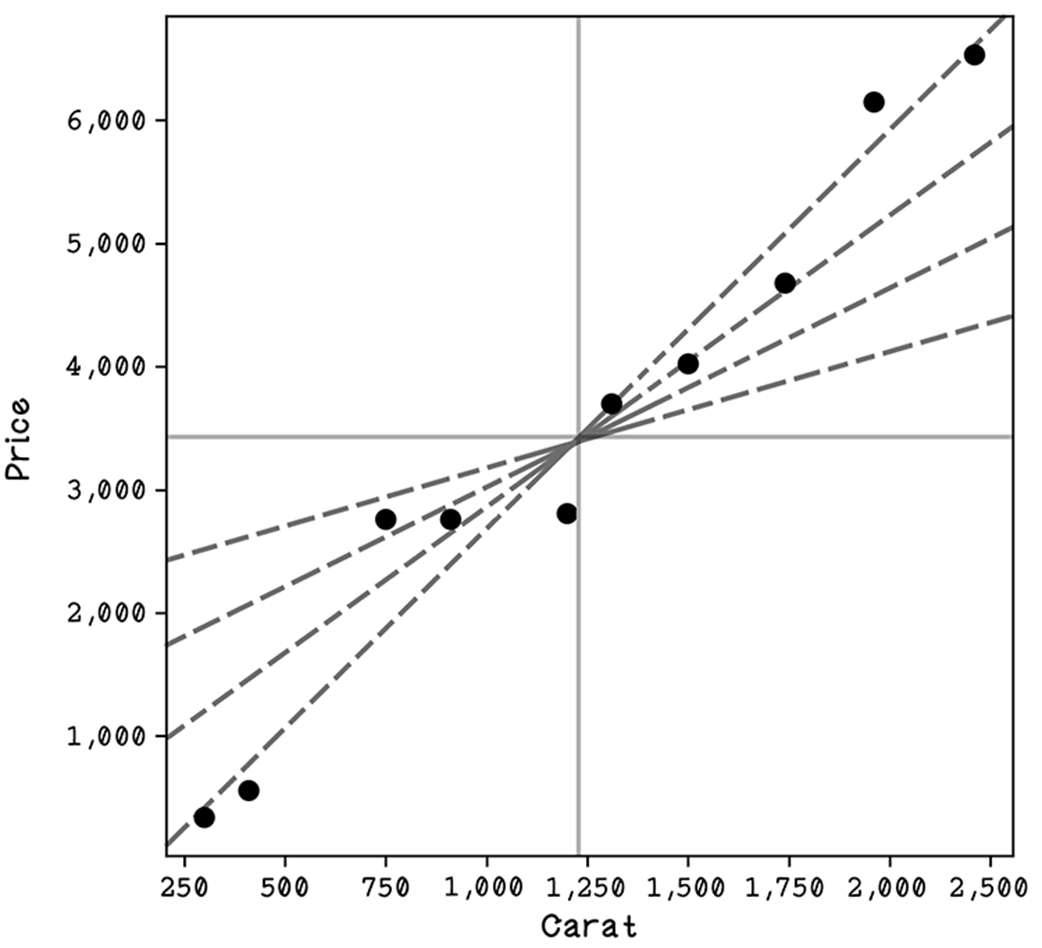
Intuition of regression lines
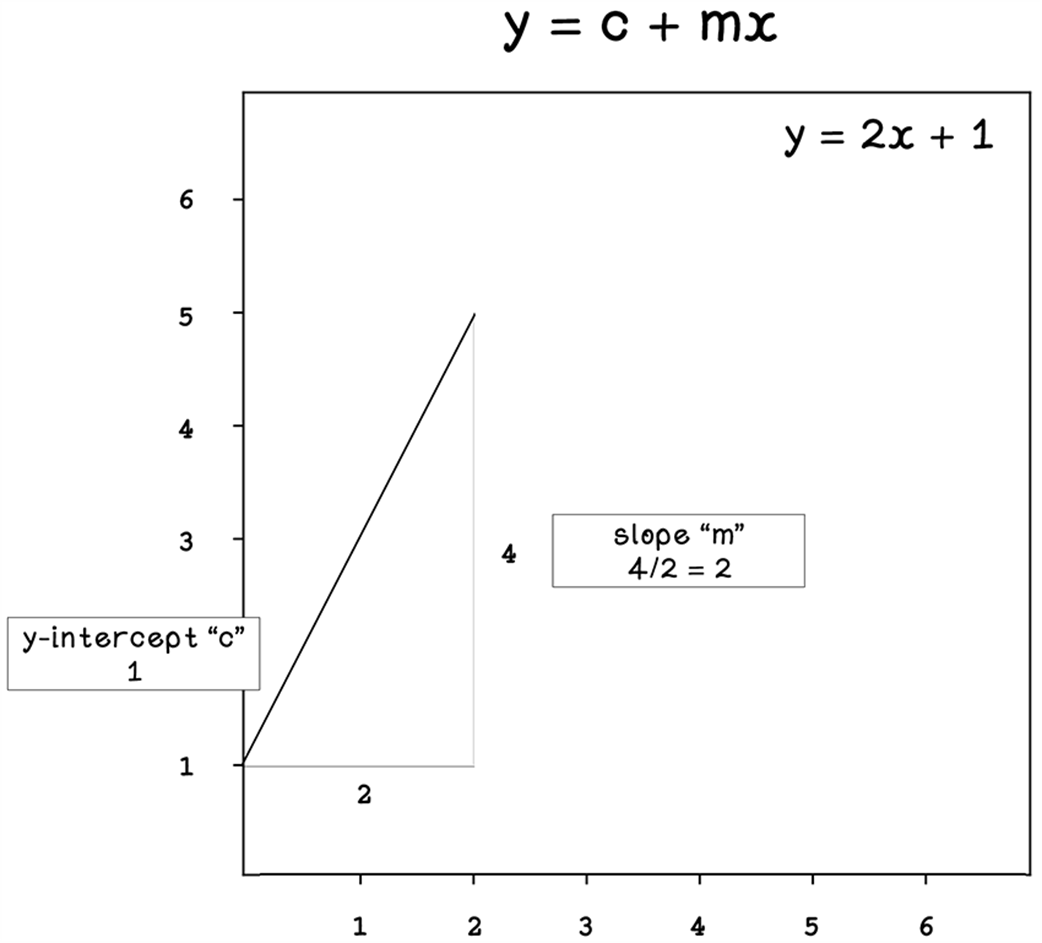
Intuition of the equation that represents a line
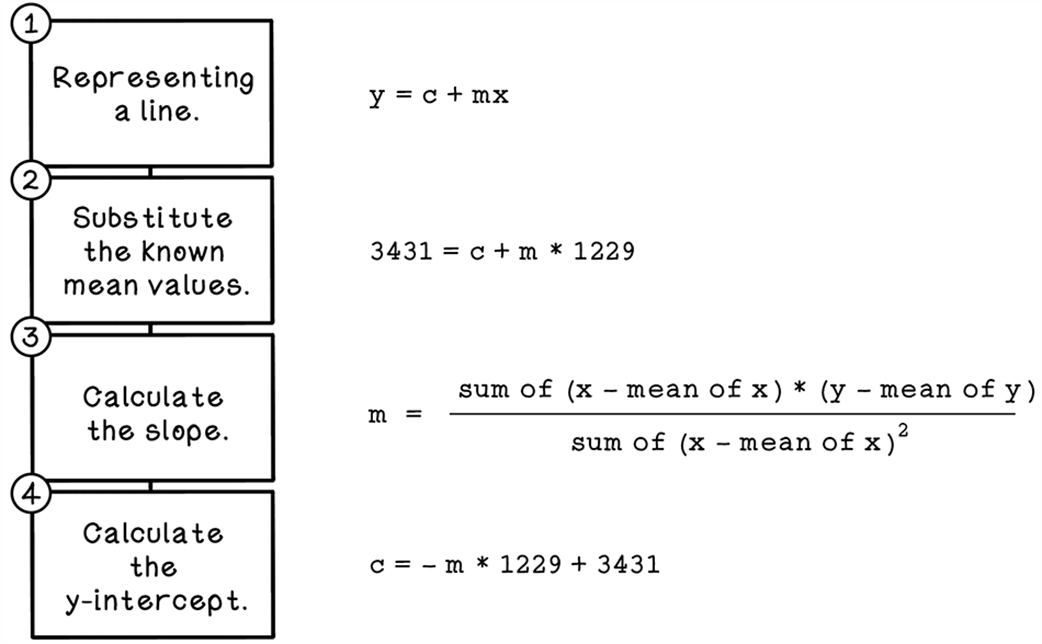
The basic workflow for calculating a regression line

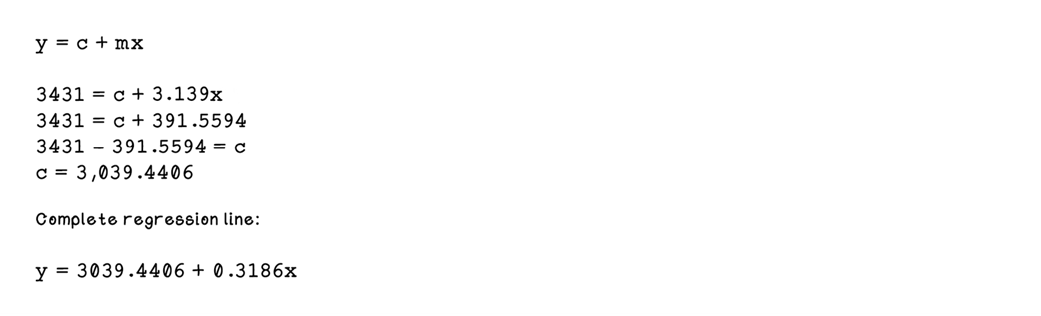
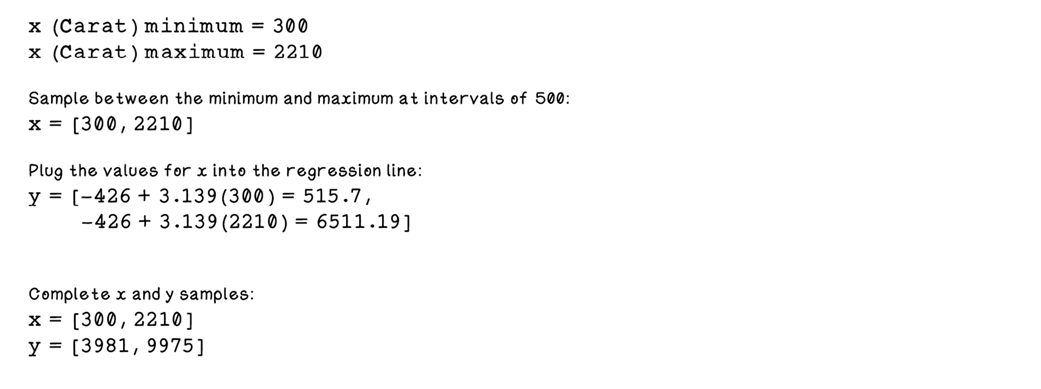
A regression line plotted with the data points
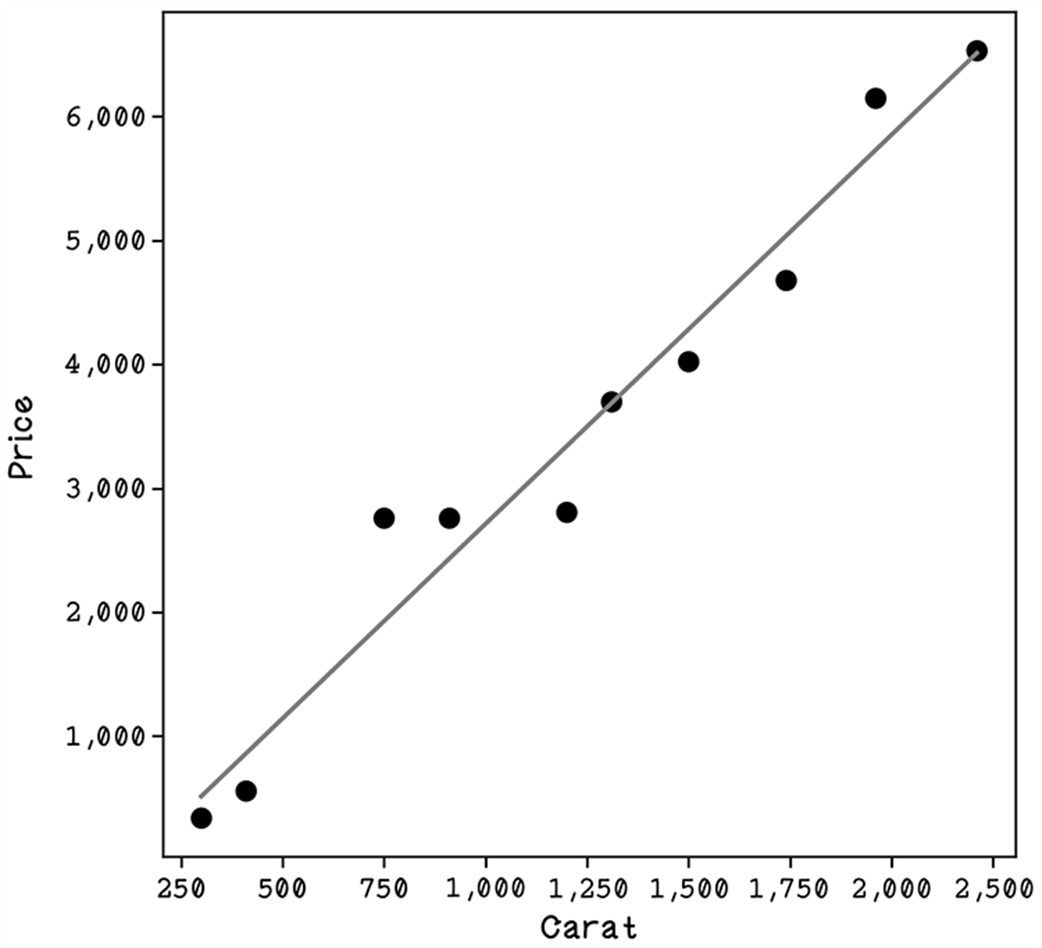
A regression line plotted with the data points
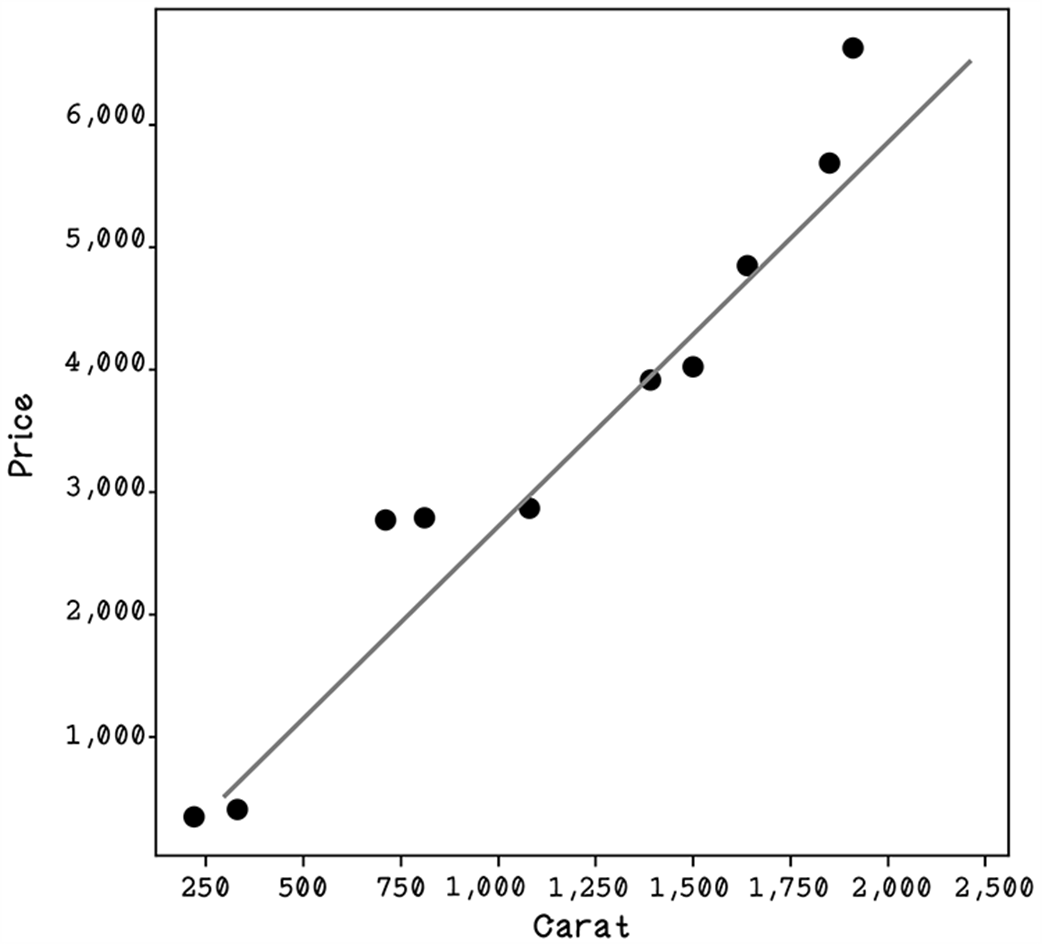


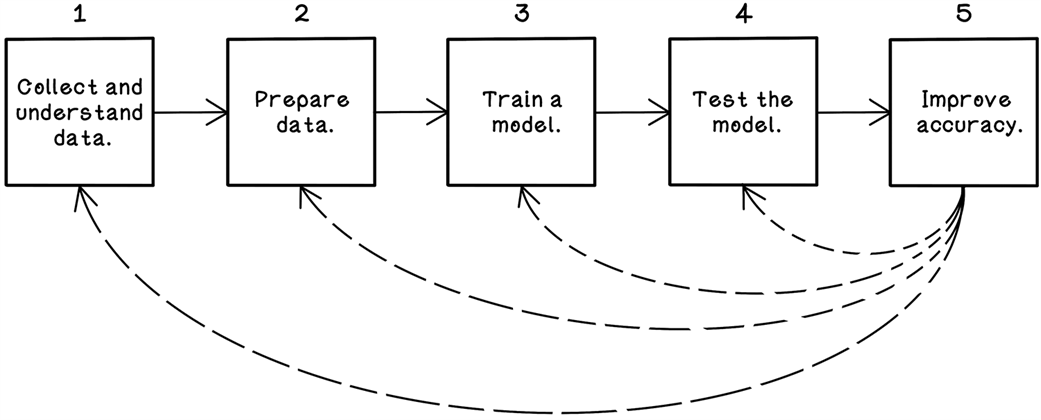
A refresher on the machine learning life cycle
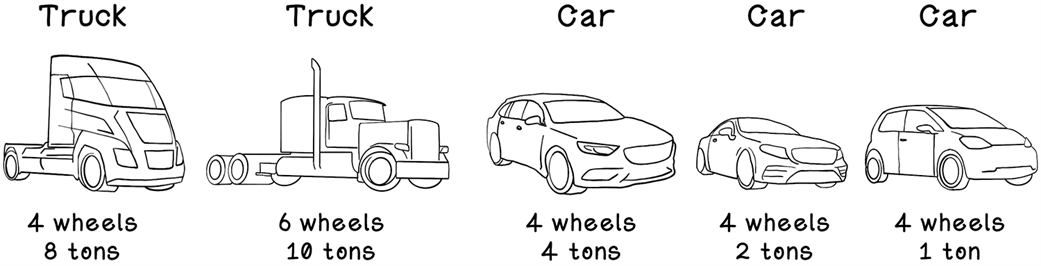
Example vehicles for potential classification based on the number of wheels and weight
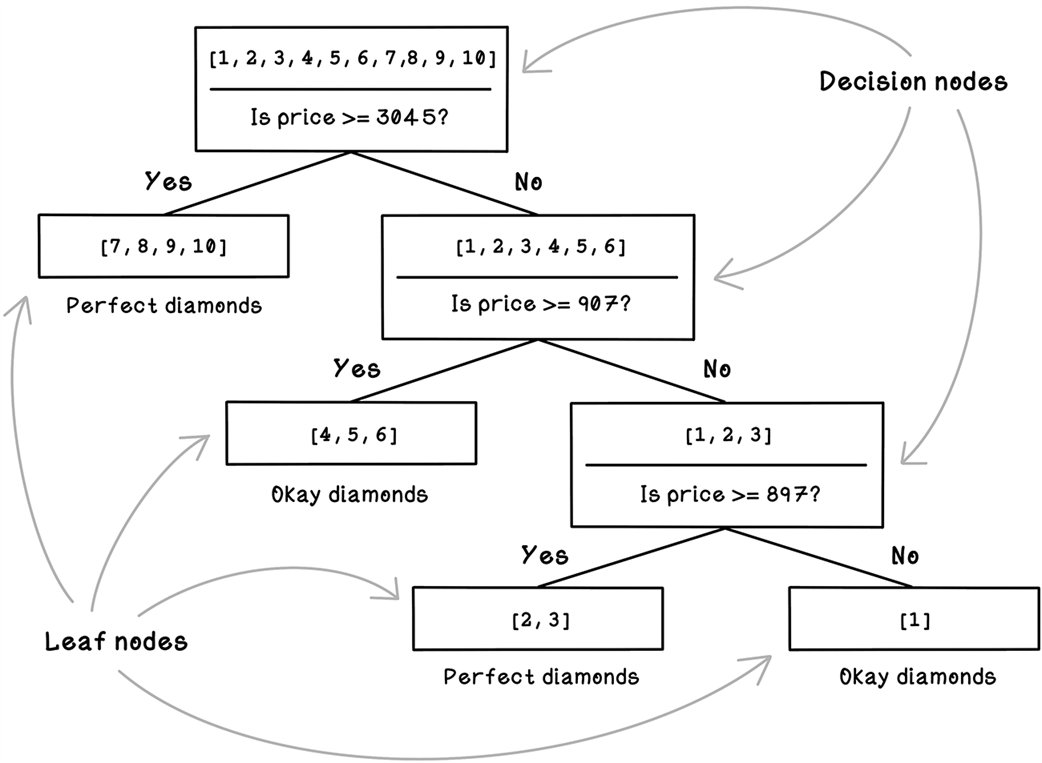
Example of a basic decision tree
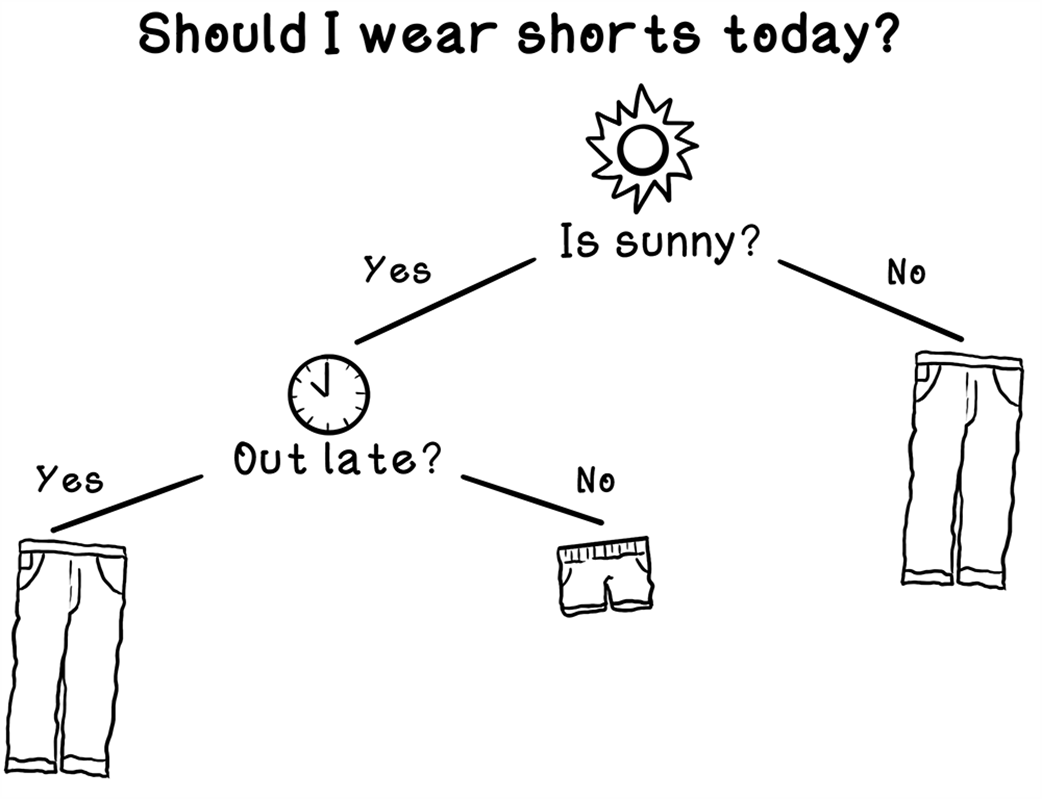
Example of a decision tree designed through human intuition
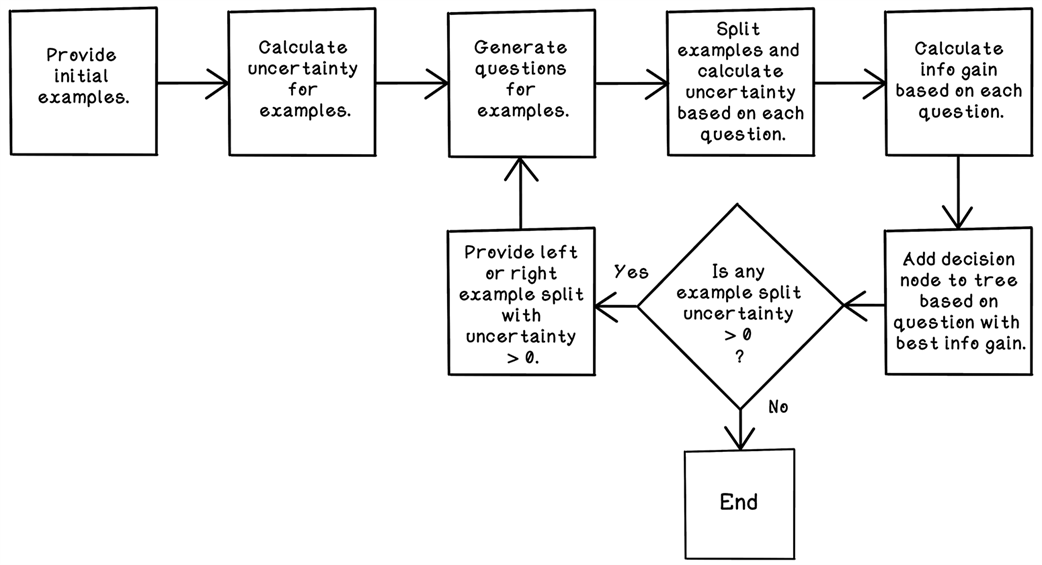
A basic flow for building a decision tree
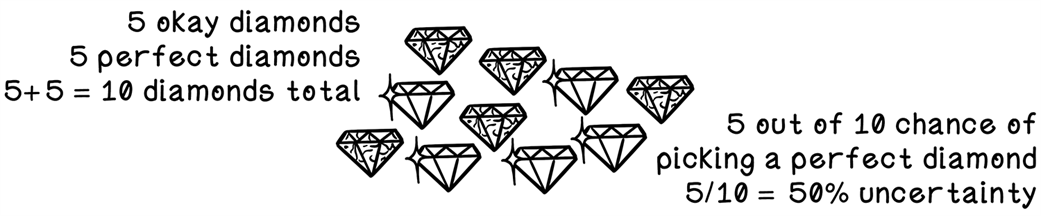
Example of uncertainty
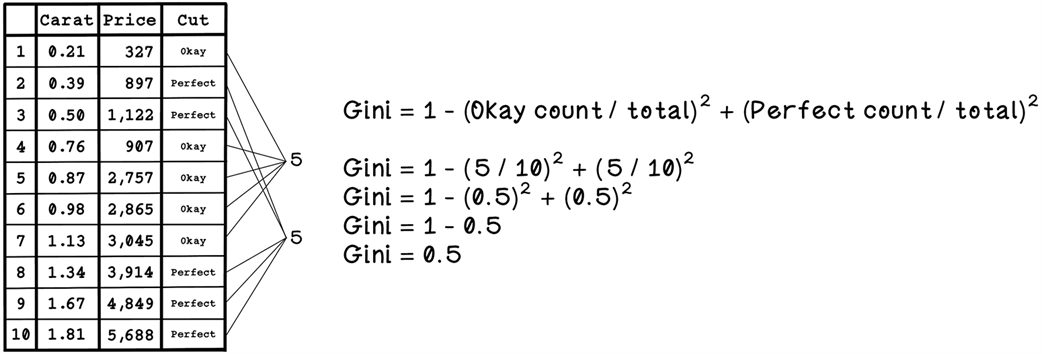
The Gini index calculation
An example of questions asked to split the data with a decision node
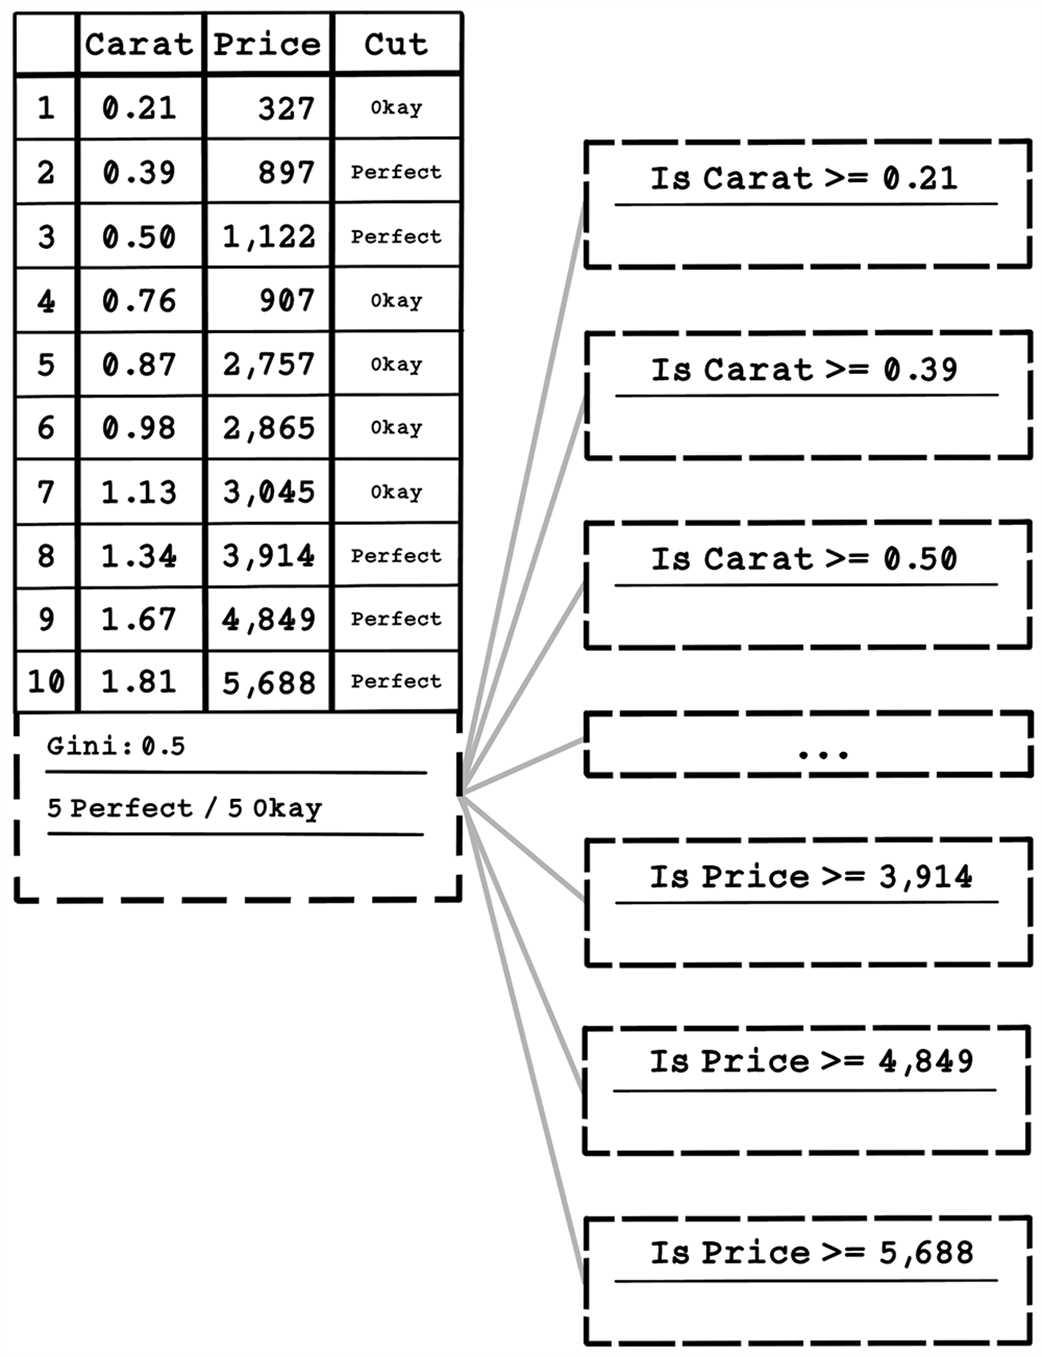
Illustration of data split and information gain based on a question
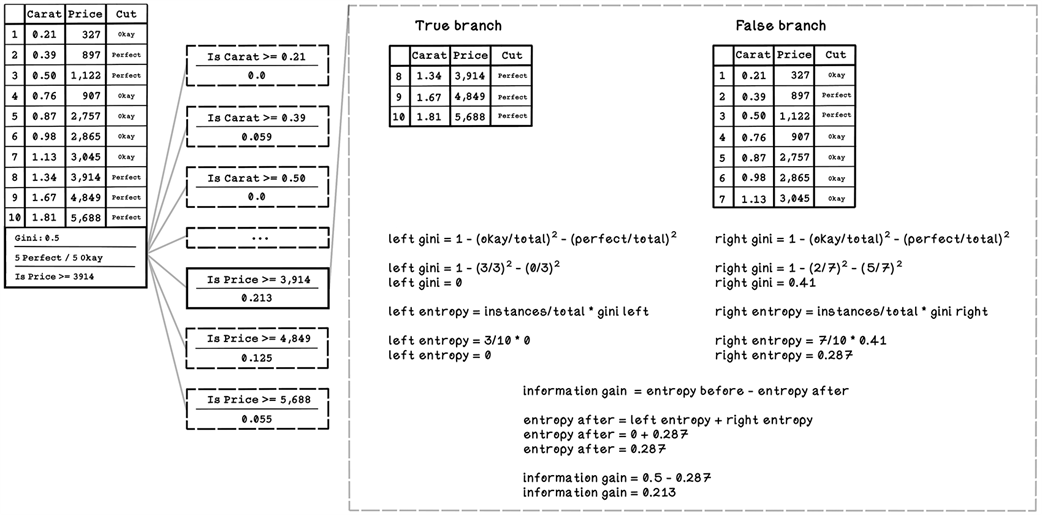
The resulting decision tree after the first decision node and possible questions
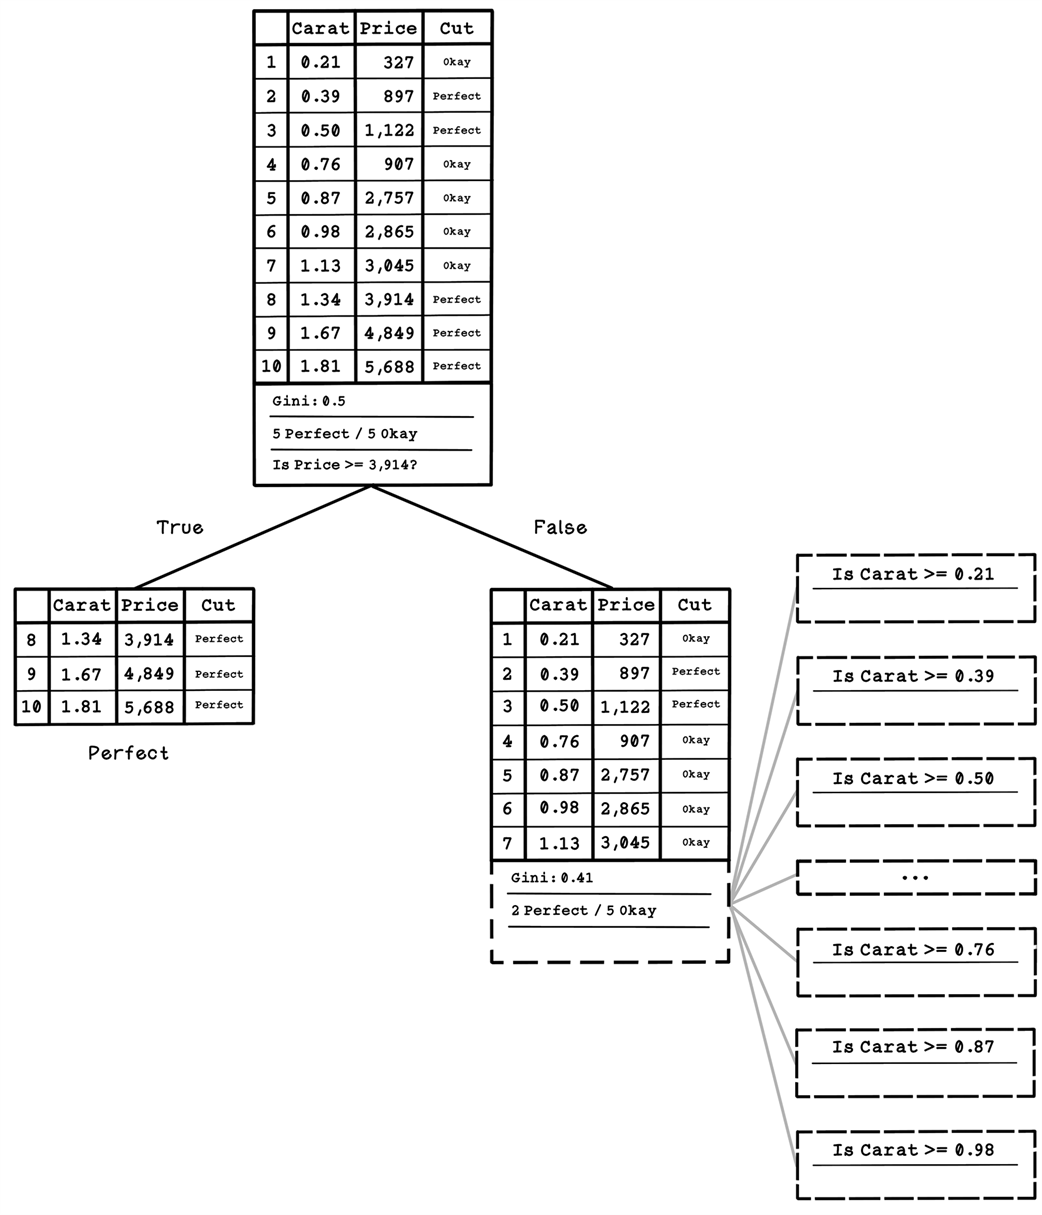
Illustration of data split and information gain based on a question at the second level
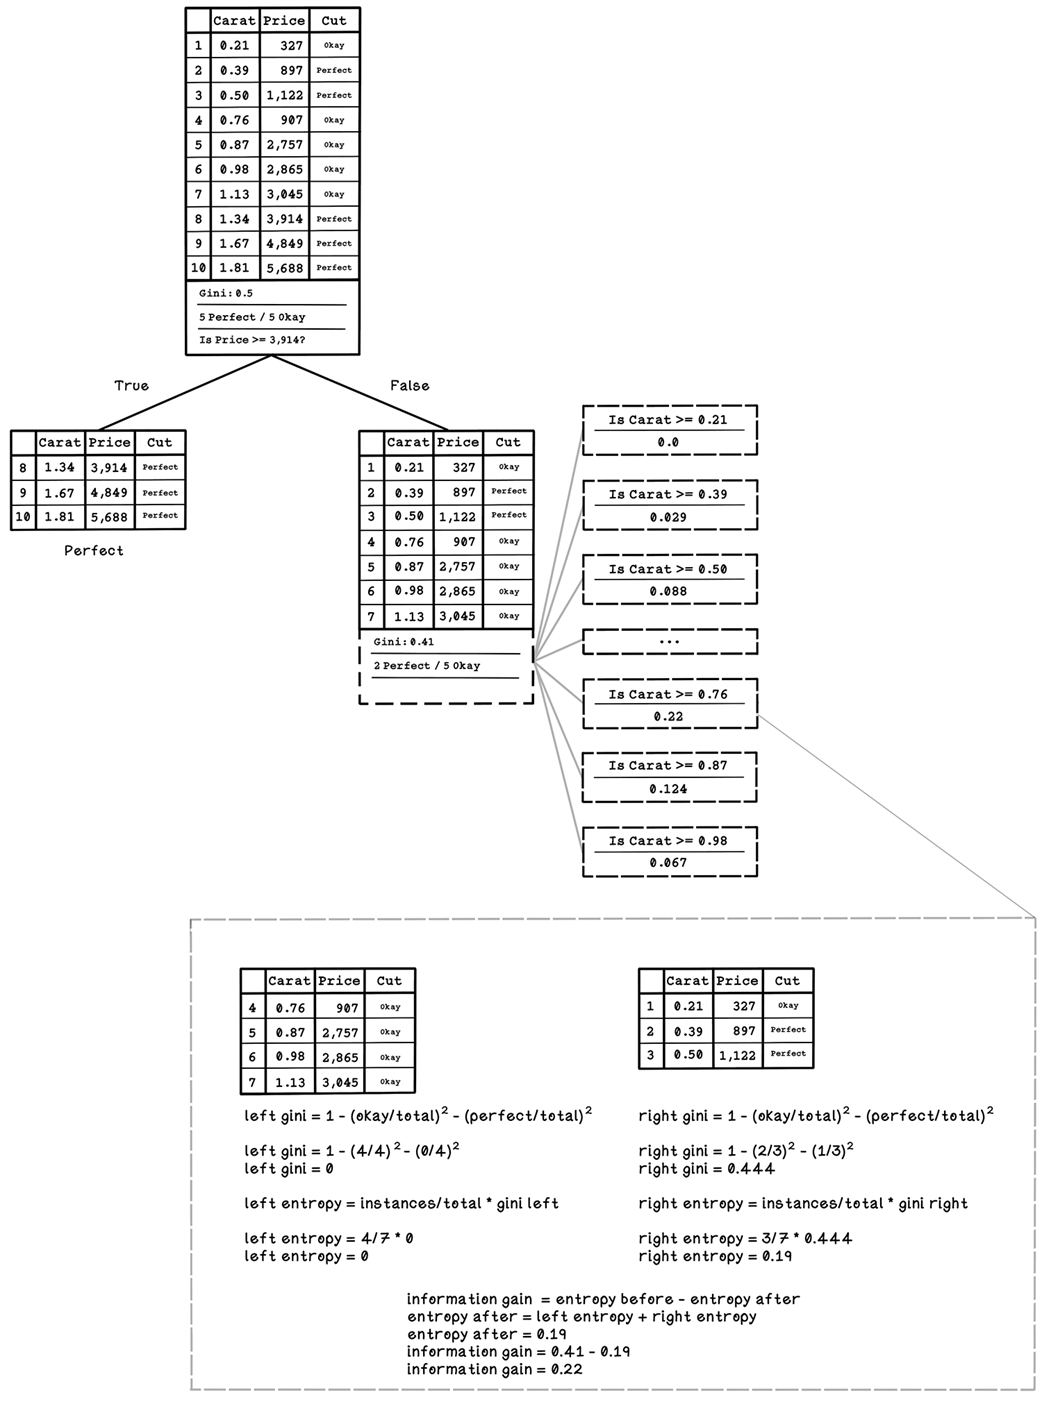
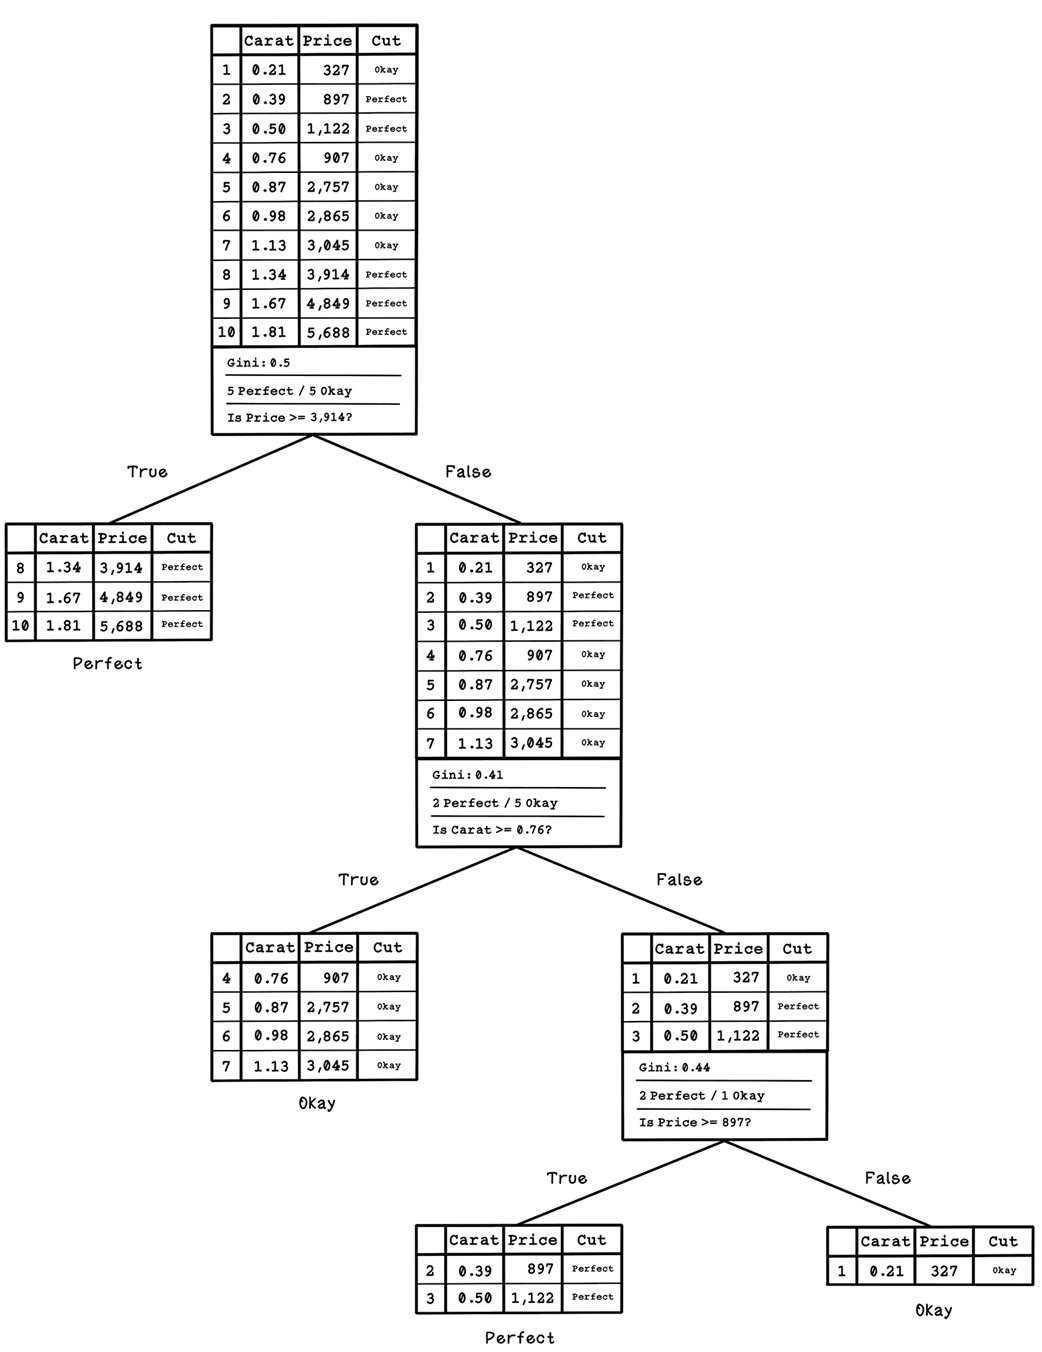
The complete trained decision tree
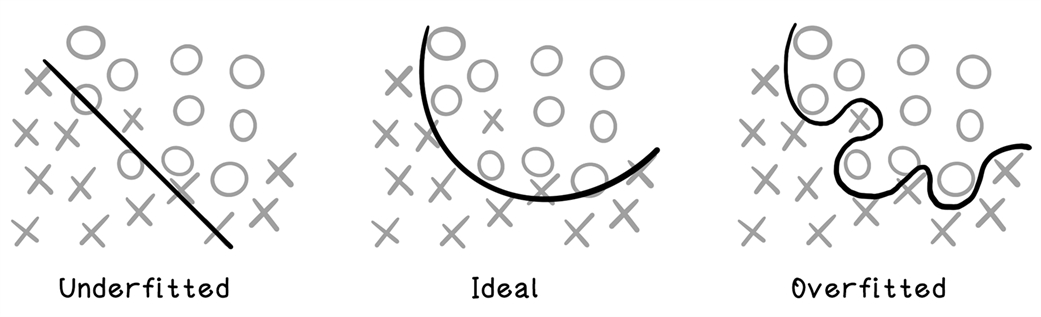
Underfitting, ideal, and overfitting
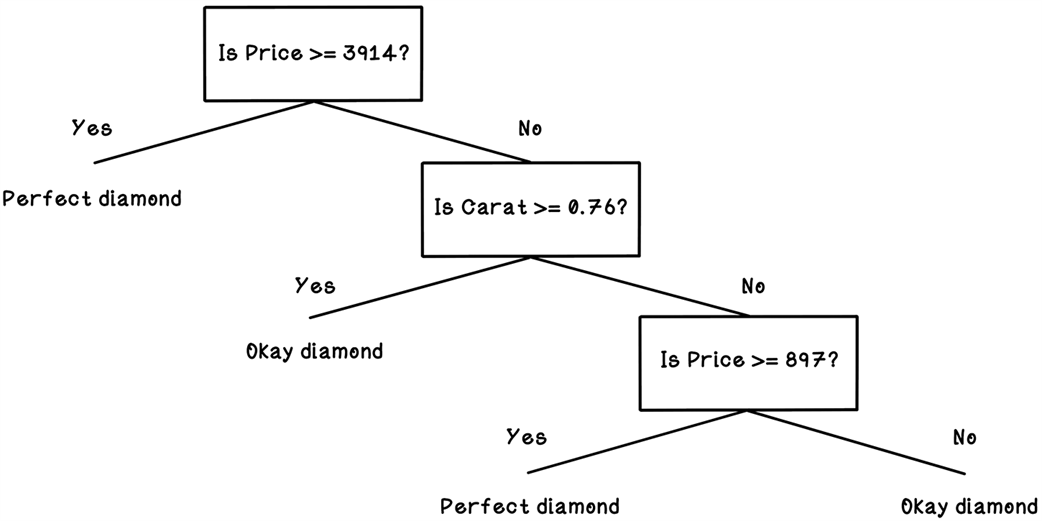
The decision tree model that will process new examples
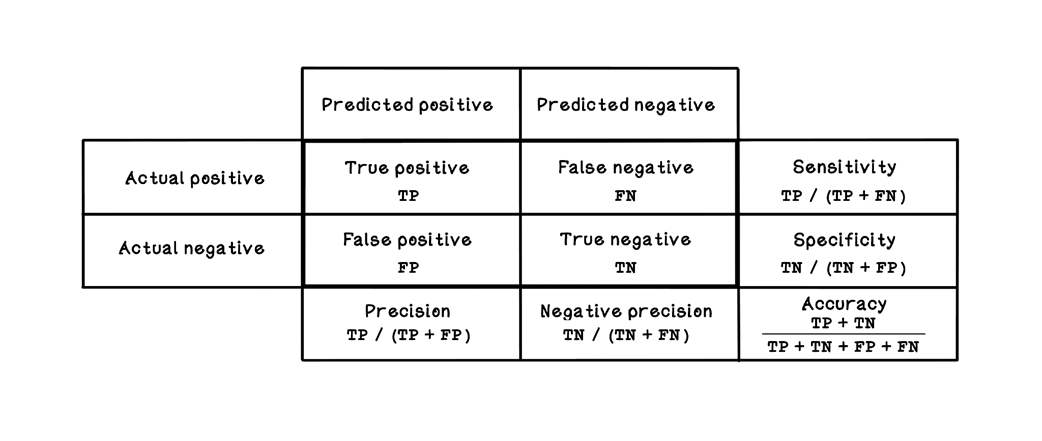
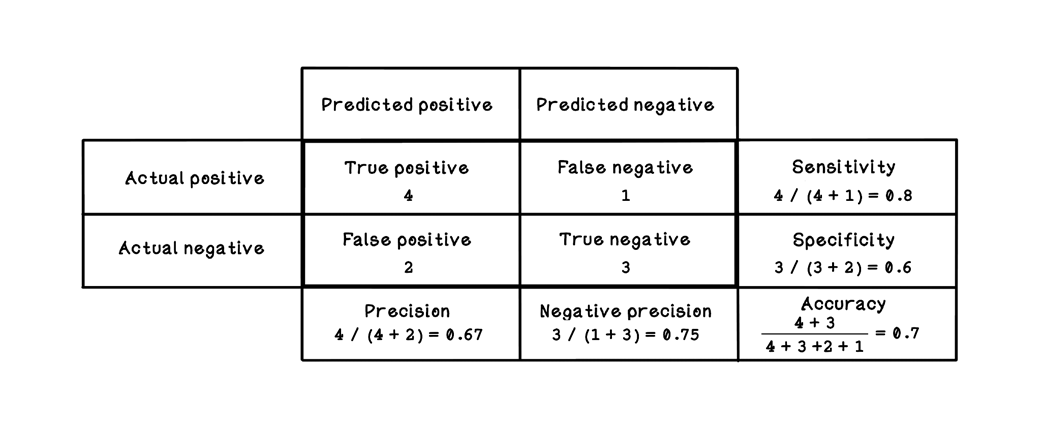
A confusion matrix
Confusion matrix for the diamond test example
A map of popular machine learning algorithms
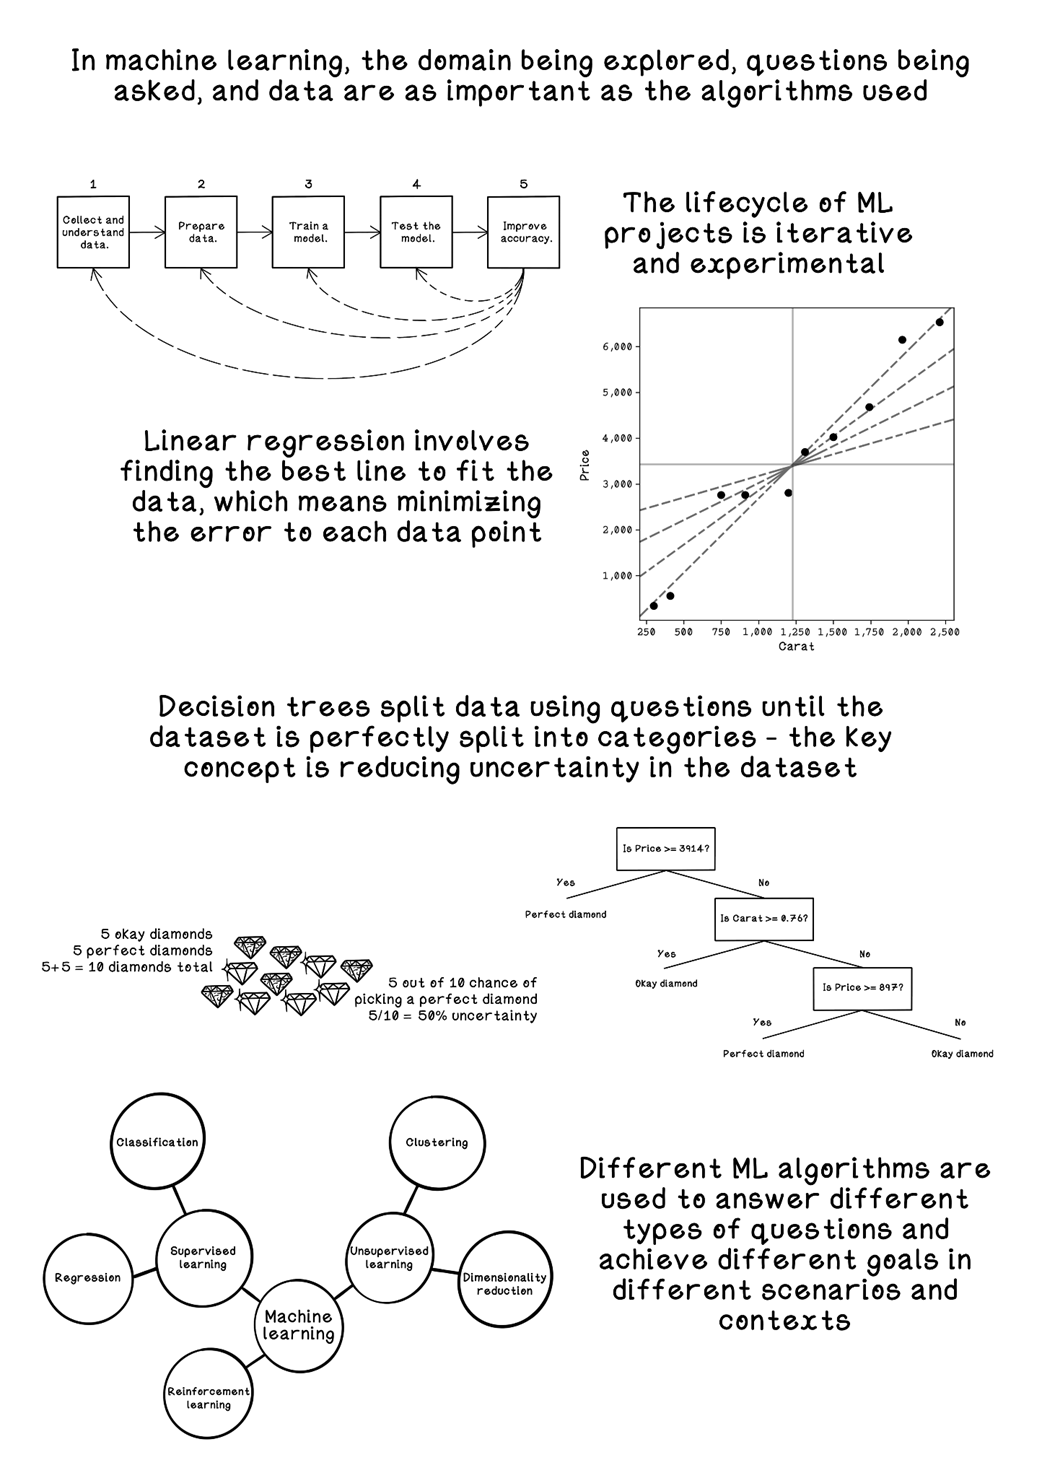
Summary of machine learning
FAQ
What kinds of problems can machine learning solve, and how are algorithms categorized?
Machine learning finds patterns in data to answer questions like “predict a value” or “assign a label.” Broad categories: - Supervised learning: learns from labeled examples (e.g., predict diamond price; classify “spam” vs “not spam”). - Unsupervised learning: finds structure without labels (e.g., cluster products that are bought together). - Reinforcement learning: trains an agent via rewards/penalties to act in an environment (e.g., game-playing, robotics).What does a typical machine learning workflow look like?
Common lifecycle: - Collect data: source and understand data in its domain context. - Prepare data: clean, fix missing/ambiguous values, encode categories, scale if needed. - Train model: select an algorithm suited to the question and data. - Test model: evaluate on unseen data to estimate real-world performance. - Improve accuracy: iterate on data, features, and algorithms based on results.What are “features,” “examples,” and the roles of x and y in datasets?
- Features: columns (attributes such as Carat, Price, Cut).- Examples: rows (individual records).
- x: independent variables (inputs we change/observe).
- y: dependent variable (target we predict or explain). For regression, you model y as a function of x.
How should I handle messy real‑world data before training?
Typical fixes: - Missing values: remove affected rows; impute with mean/median (for numeric); mode (for categorical); or use advanced estimators (k-NN, neural nets) if justified. - Ambiguous/inconsistent values: standardize (e.g., “fair” vs “Fair”). - Categorical features: one‑hot encode general categories; use label encoding only for ordered ratings to avoid unintended bias.When should I use linear regression, and what’s the basic idea?
Use linear regression to predict a continuous value (e.g., price) from one or more features (e.g., carat, dimensions). It fits a line y = c + m x (or a hyperplane for multiple features) that best captures the trend, typically using the least‑squares criterion to minimize overall error.How is the “best‑fit” regression line found with least squares?
High-level steps: - Compute means of x and y. - Measure each point’s deviations from those means. - Sum squared x deviations and x–y co‑deviations. - Compute slope m = Σ[(x−x̄)(y−ȳ)] / Σ[(x−x̄)²] and intercept c = ȳ − m x̄. - Optionally scale features (e.g., multiply carat by 1,000) for numerical convenience without changing relationships.How do I evaluate a regression model’s performance?
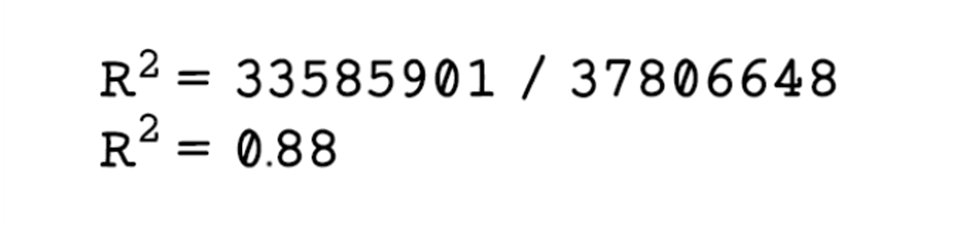
Use R² (coefficient of determination): - R² measures the proportion of variance in y explained by the model (0 to 1). - Example: R² = 0.88 means 88% of the variation in price is explained by the chosen features and model; the rest is noise or unmodeled factors.What is a decision tree, and how does it make classification decisions?
A decision tree asks a sequence of questions to split data into purer groups (e.g., “Is Price ≥ 3914?”). Training (e.g., via CART) tries many candidate splits and selects those with the highest information gain, measured using impurity metrics such as the Gini index. The process repeats recursively until splits are sufficiently pure or a stopping rule is met.What are overfitting and underfitting, and how can I reduce overfitting in trees?
- Underfitting: model is too simple; misses key patterns (poor on both train/test).- Overfitting: model memorizes training data; fails to generalize (great on train, weak on test).
- Mitigation for trees: prune overly specific branches, limit tree depth/min samples per split, use validation to tune, or switch to ensembles (e.g., random forests).

 Grokking AI Algorithms, Second Edition ebook for free
