8 Approximate Quantiles on Data Streams
This chapter explains how to estimate quantiles over unbounded data streams when exact computation is infeasible under one-pass, sublinear-memory constraints. It motivates the problem with web-site time-spent data and frames quantile queries such as the median and high percentiles that drive operations and anomaly detection. Since exact selection requires linear space in streaming settings, the chapter shifts to approximate methods and clarifies three error notions: additive error on rank, relative (multiplicative) error on rank, and relative error in the data domain. The central design goal is to maintain small, mergeable summaries that preserve roughly constant precision as the stream grows, enabling distributed computation and later aggregation.
T-digest is introduced as a practical, mergeable sketch that stores a small set of weighted centroids (clusters) ordered by value. A scale function governs where clusters may grow: it enforces many small clusters in the distribution tails and fewer, larger clusters near the center, yielding high fidelity for extreme quantiles. Updates and merges proceed by sorting centroids and greedily combining neighbors while respecting a size bound induced by the scale function; the compression parameter controls memory, which remains roughly constant irrespective of stream length. Although T-digest lacks formal worst-case bounds, it consistently shows strong empirical accuracy—especially for tail quantiles—and offers excellent speed and ease of use in streaming and distributed systems.
Q-digest predates T-digest and provides explicit worst-case guarantees. It assumes a known, bounded integer universe and compresses counts in a full binary tree by aggregating low-frequency leaves and intervals upward according to simple rules controlled by a compression parameter. The structure is mergeable, has space bounded by the parameter and log of the universe size, and yields provable additive rank-error bounds; it also naturally emphasizes frequent values. In head-to-head experiments on realistic web-site time-spent samples with similar memory budgets, T-digest produced far smaller empirical errors for the 95th and 99th percentiles and was more efficient, while Q-digest respected its theoretical guarantees. The chapter concludes that T-digest is typically preferred for accurate, fast tail quantiles in practice, whereas Q-digest remains valuable when strict error bounds and a discrete, bounded domain are paramount.
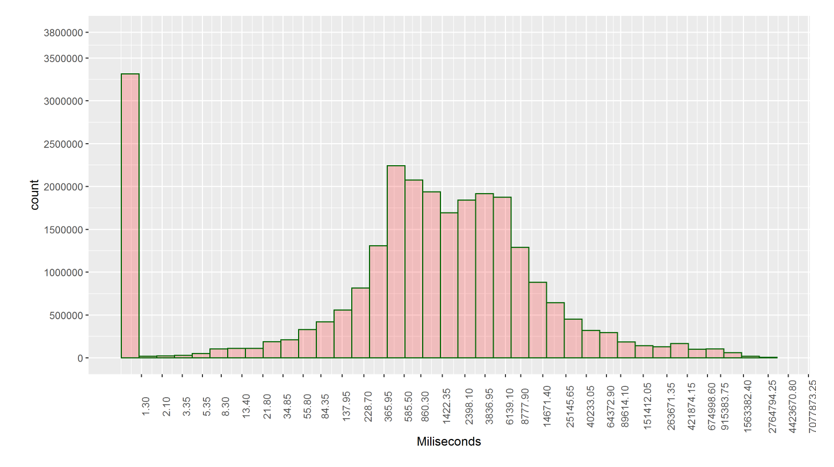
: Bar chart (manipulated histogram) of the distribution of around 26 mil. web-time-spent data points measured in milliseconds. Visitors would visit the site within a single hour. Each length of visit is logged and this is how users time – spent looks for a single hour.





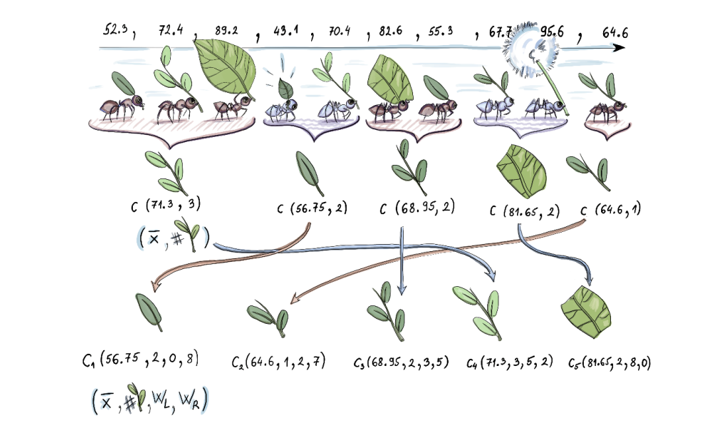
: Figure above shows a digest for 10 elements. We order the clusters according to their mean. Clusters 1, 2, 3, 4 and 5 consist of 3, 2, 2, 2, and 1 data point respectively. Each, aside from count, saves the mean value as well. Wleft and Wright are keeping the number of data items left and right from each cluster. Notice that this digest is not strongly ordered.
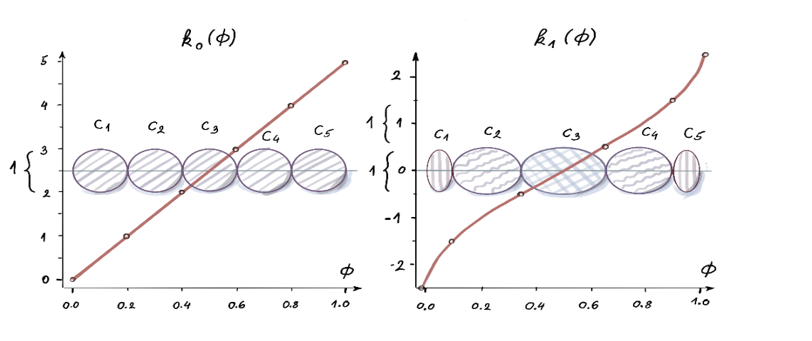
: You can see here how differ between and . The k-sizes for both functions allocate 5 clusters (both T-digests are shown as an ordered set of clusters that are fully merged, no two consecutive clusters can be combined without violating the weight bound). Clusters k-sizes in both cases are all 1, nevertheless, subintervals the clusters inform are different and for they are variable with smaller clusters around the “edges” and larger in the middle. For they inform same width subintervals of [0,1]
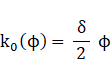
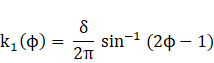
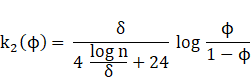
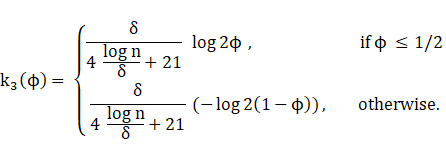
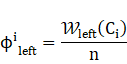
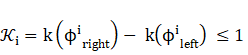
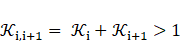
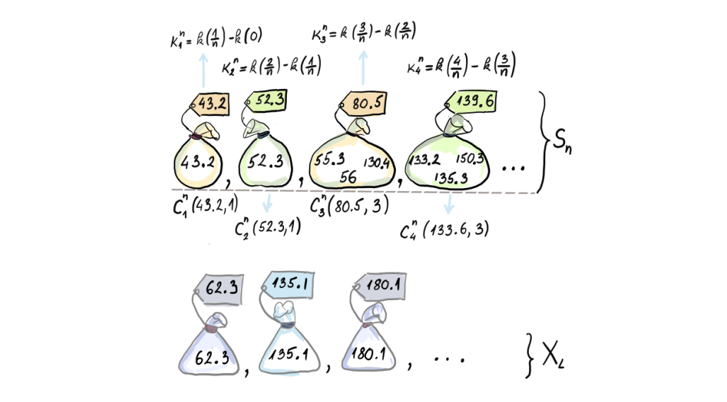
: Strongly ordered T-digest Sn (superscripts on K and C denote the number of elements from the stream seen so far). Notice that the argument of the k-function is appears in steps of 1/n (above). represents new elements that we are adding to T-digest from the stream (we are showing only the left tail of and ).
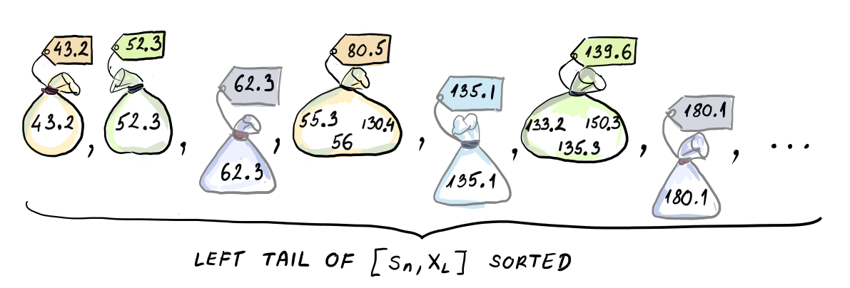
: The figure is showing sorted lower end of before the MERGE phase begins
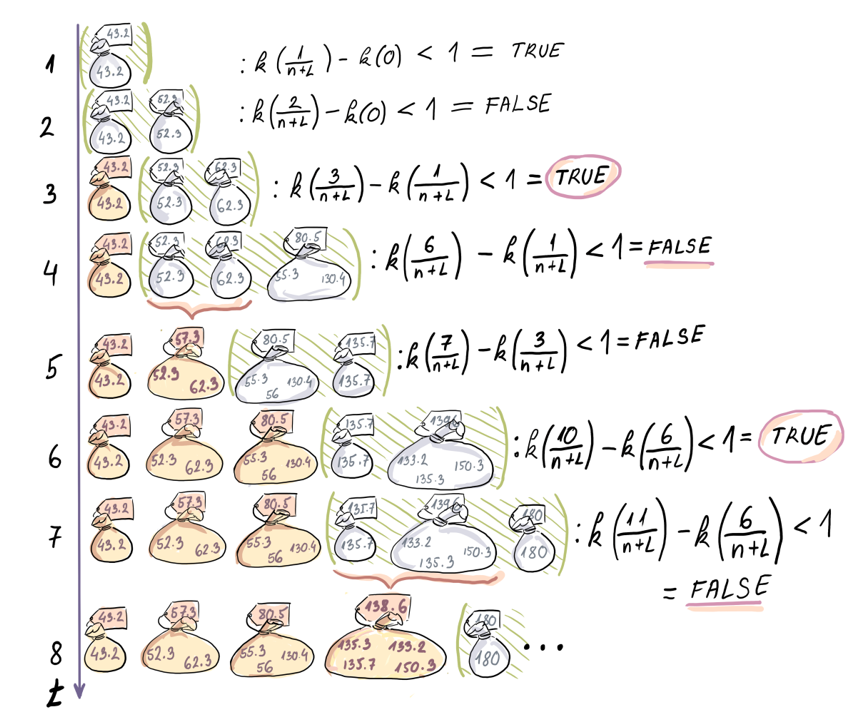
: The figure shows the merge phase of the T-digest algorithm. Each time the assimilation of the cluster to the right is not allowed (indicated by the negative answer to the k-size query) we form a new cluster (indicated by the closed yellowish bag). The current attempts to merge with the neighbor(s) to the right are indicated by the green parenthesis at each time point. The clusters at the time point 8 are the first 4 clusters of the new
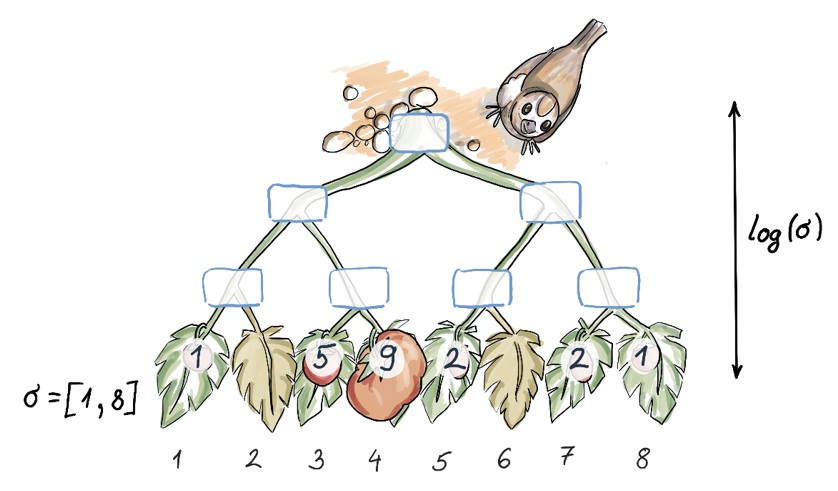
Original data and its frequencies represented through the leaves of an implicit tree.
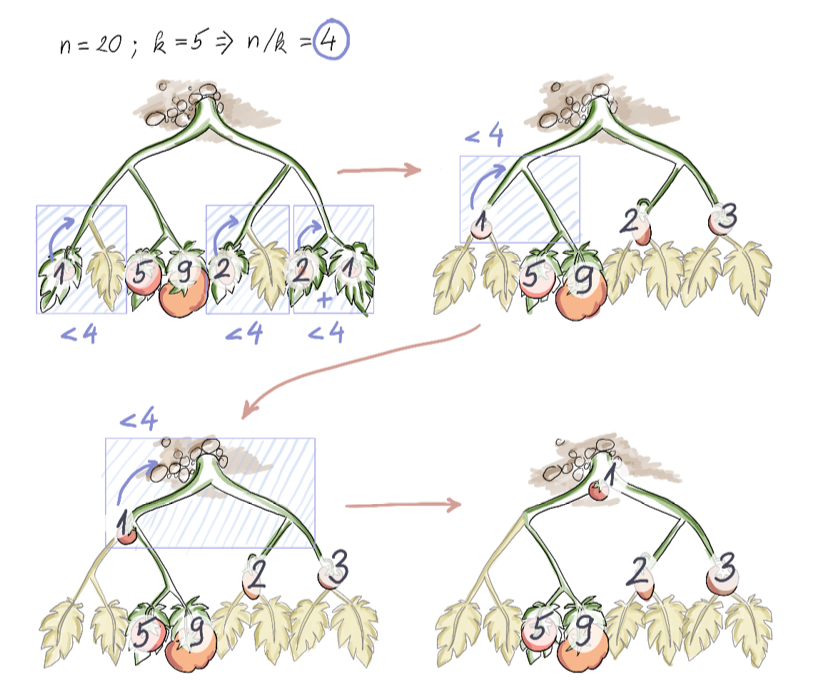
Building a Q-digest from scratch
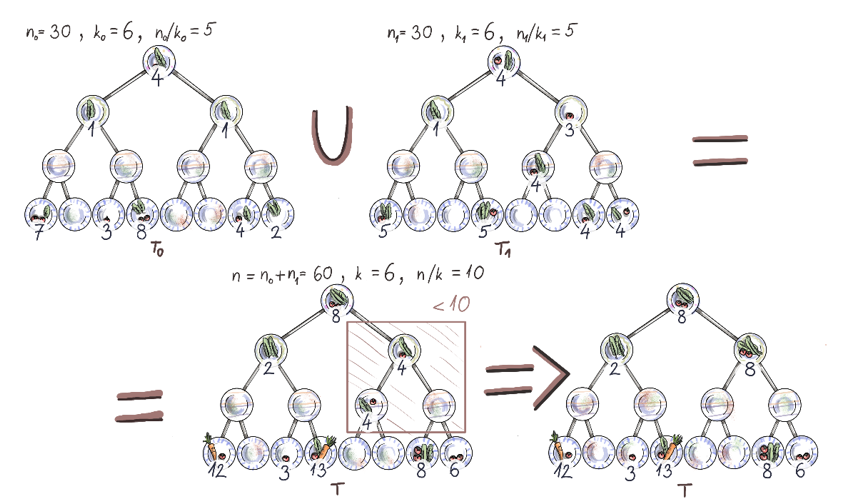
Merging two Q-digests where n1=n2=30, k1=k2=6. Because the digests are of the same sizes, the resulting Q-digest is of the same size, where the values at nodes are the sums at respective nodes. For example, the resulting Q-digest has the value 8 at the root, because the Q-digests participating in the merging operation both have the value of 4. However, this might lead to a Q-digest that is not fully merged. In this particular example, the resulting Q-digest has n=n1+n2=60, and k=k1=k2=6, so we are looking for triangles whose sum is 10 or less, and we propagate those values up to the parent, as before.


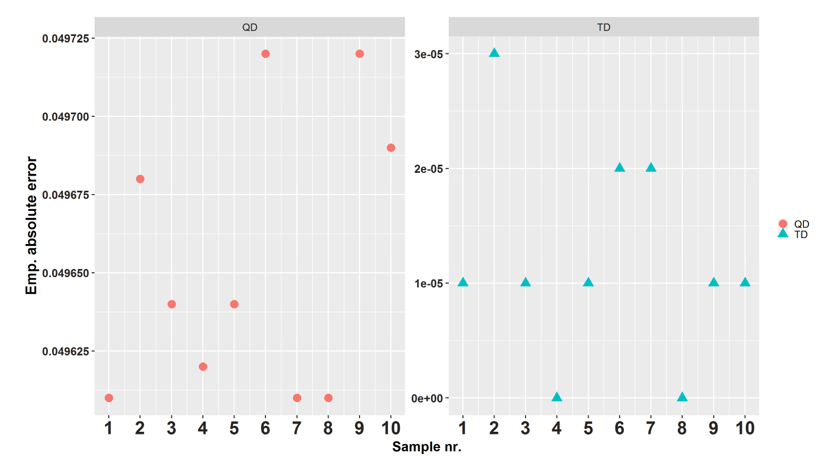
: The graphs show empirical absolute error that Q-digest (left) and T-digest (right) exhibit when estimating 95th percentile. The error in estimating is calculated as follows: if the true rank of the answer (value) that a digest provides is , then the absolute error is | r / n – q | where n is the number of elements digested so far.
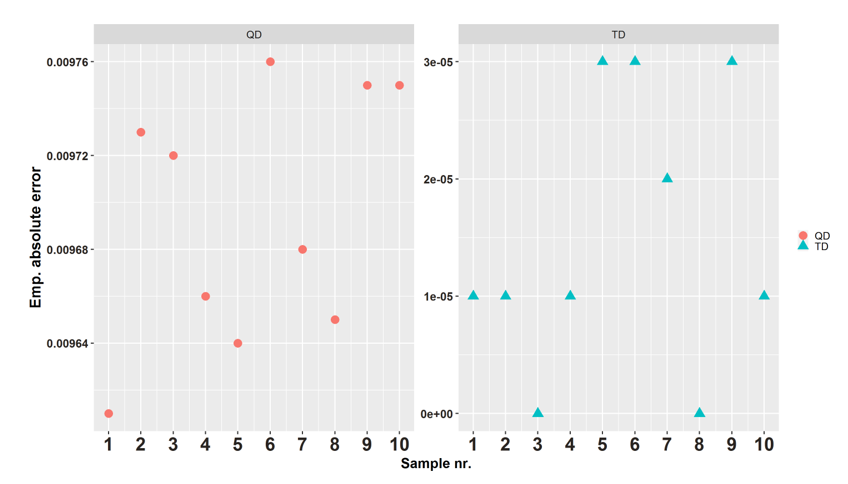
: The graphs show empirical absolute error that Q-digest (left) and T-digest (right) exhibit for estimating 99th percentile. The error in estimating is calculated as follows: if the true rank of the answer (value) that a digest provides is , then the absolute error is | r / n – q |where is the number of elements digested so far.
Summary
- Having ad-hoc approximate quantiles any time in a streaming data application, especially one that is used to detect anomalies, is very important. Having efficient online algorithms that save small summaries of the whole data and deliver answers about quantiles with some error guarantee, means being able to create a small sketch of the data distribution in the form of a histogram. This way you can keep an eye on multiple quantiles at once and set sensitive thresholds.
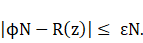
- Error with which algorithms approximating quantiles work is either additive or relative (multiplicative). Additive error
 is the same no matter which quantile we estimate. Relative error
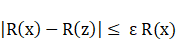
 ) is relative to the specific quantile we are interested in, so it is smaller for small quantiles and largest
 for the maximal value. Error in the data space instead of the ranks space, is sometimes called relative error as well, but it has nothing to do with the relative (multiplicative) error above.
- We have gotten to know T-digest, very popular heuristic algorithm for calculating approximate quantiles. We saw the mechanism of keeping small samples on the edges of quantile interval and larger in the middle and how k-size regulation via scale functions makes sure of this. This results in better accuracy when estimating tail quantiles like 95-th-percentile or 99-th percentile, or even finer ones close to 1. We saw how T-digest delivers very accurate estimates in those ranges, on 10 samples of realistic web-time-spent data.
- We learned what Q-digest algorithm is and how to build one from scratch, as well as how to merge two or more. Q-digest works for integers only and one needs to be familiar with the universe the data is coming from in order to use it. For streaming data this can and might not be true. In case we don’t really know the range of data we are about to see, Q-digest is of limited use. T-digest does not share that constraint and seems to perform better than Q-digest, with absolute empirical errors smaller by 2 to 3 orders of magnitude for estimating same high-end quantiles.
FAQ
Why do we need approximate (not exact) quantiles on data streams?
In a one-pass streaming model, exact selection (e.g., median) requires memory linear in the stream length N. Munro–Paterson’s lower bound shows any p-pass exact selection algorithm needs Ω(N^(1/p)) memory; with one pass (p=1) that’s Ω(N). Since N can be massive or unbounded, we give up exactness and use small-memory summaries that return quantiles with controlled error.What error notions are used for approximate quantiles?
- Additive rank error: the returned item’s rank differs from the true rank by at most εN (measured in ranks).- Relative (multiplicative) rank error: the error scales with the target rank, typically ≤ ε·(φN) for φ-quantiles.
- Relative error in the value domain: |returned_value − true_value| ≤ ε·true_value (applies only to numeric data).
Note: Additive error grows with N; rank-based errors are agnostic to the data’s numeric scale.
What does an ε-approximate φ-quantile guarantee mean?
Given N items and φ in [0,1], an ε-approximate φ-quantile returns an element whose rank lies in [⌈(φ−ε)N⌉, ⌈(φ+ε)N⌉]. If the algorithm is randomized, this guarantee holds with probability at least 1−δ (small failure probability).When is relative (multiplicative) error preferable to additive error?
Relative error is crucial for tail quantiles (e.g., 99th, 99.9th) where small rank misplacements correspond to large value jumps in long-tailed data. It scales with the target rank instead of N, yielding higher fidelity in the extremes. However, it’s harder to guarantee; algorithms that achieve relative error also satisfy additive error, but not vice versa.What is a T-digest, conceptually?
A T-digest is a compact summary of the distribution formed by ordered clusters. Each cluster stores:- a centroid (mean of values it represents), and
- a weight (number of represented items).
Clusters are arranged by centroid and can be strongly or weakly ordered. Queries estimate ranks (or values at quantiles) by accumulating cluster weights around the target.
How do T-digest scale functions and the compression parameter control accuracy?
Scale functions map quantile positions to a “k-scale” that bounds cluster k-sizes (differences on the k-scale). With compression parameter δ, T-digest allows clusters to grow until their k-size reaches 1; because good scale functions change more steeply near 0 and 1, clusters stay small in the tails and larger near the center. Result: higher tail resolution (better high/low quantiles) under fixed memory.How are T-digests updated and merged, and what is mergeability?
- Update: buffer new items, sort by value, sweep left-to-right merging adjacent clusters while the k-size bound permits; merged clusters get weighted means and summed weights.- Merge: treat clusters from multiple digests as one sorted list and apply the same sweep-merge step.
Mergeability lets you build digests on partitions (e.g., by geography or node) and combine them (MapReduce style) without blowing up error.
What are T-digest space characteristics and trade-offs?
- Space: O(δ) clusters, each storing O(1) metadata (centroid, weight). Space is independent of stream length N (constant w.r.t. N).- Trade-offs: Larger δ yields more clusters and better accuracy, especially in tails. T-digest offers excellent empirical error but lacks a universal worst‑case error proof.
What is a Q-digest, when can I use it, and how is it built?
Q-digest summarizes integer data with a known bounded universe U (e.g., IDs, milliseconds). It uses an implicit full binary tree over [0..U−1] and “pushes up” small counts from leaves to ancestors according to two rules controlled by a compression factor k. Only nodes that carry counts are stored. Low-frequency neighboring values are aggregated, preserving range mass while saving space.How do Q-digest queries, errors, merging, and space guarantees compare to T-digest?
- Quantile queries: post-order the stored nodes (intervals), scan accumulating counts until reaching φN; return the right endpoint of the interval where you cross φN.- Error: additive rank error is O((log U)/k) fraction of N (i.e., relative rank error ≤ (log U)/k). This is a worst‑case guarantee.
- Space: O(k log U) key–value pairs.
- Merging: sum corresponding nodes from two digests (same universe), then reapply the rules (compress).
- Practice vs. T-digest: On long‑tailed “time spent” web data in the chapter, T-digest was much faster and had orders‑of‑magnitude smaller empirical errors for 95th/99th percentiles, while Q-digest honored its (looser) worst‑case bounds.

 Algorithms and Data Structures for Massive Datasets ebook for free
