4 LLM-driven data science
The chapter shows how LLMs can turn plain-language business questions into practical data science workflows, using pharmaceutical data as a concrete example. It begins with choosing a usable dataset, comparing real-world and synthetic sources, and favoring the larger, messier real dataset because it offers more meaningful insight, even if it requires more cleaning. The core lesson is that AI can help identify data sources, compare trade-offs, and generate notebooks or scripts quickly, making analytics accessible even to people without deep Python or machine learning experience.
It then walks through exploratory analysis and feature engineering, emphasizing that LLMs are useful for both open-ended discovery and tightly scoped tasks. When the question is vague, the model can suggest useful analyses such as manufacturer concentration, price patterns, and discontinuation rates; when the question is specific, it can generate code that answers exactly what is needed. The chapter also highlights the importance of inspecting raw fields carefully, using AI to interpret ambiguous columns, and improving parsing logic after checking results, since even seemingly successful outputs can hide missing values or subtle extraction errors.
Finally, the chapter builds two predictive systems: a regression model for drug price estimation and a text-based classifier that flags high-risk medicines. It explains the usual ML pipeline of splitting data, encoding categories, training models, and evaluating them, while showing how prompts can generate and refine the full implementation. The discussion closes with a strong warning about validation: good-looking metrics can still come from leakage, duplication, or overfitting, so threshold tuning, cross-validation, and external sanity checks are essential. Overall, the chapter frames vibe engineering as a fast way to build data science systems, but only when paired with careful human judgment and verification.
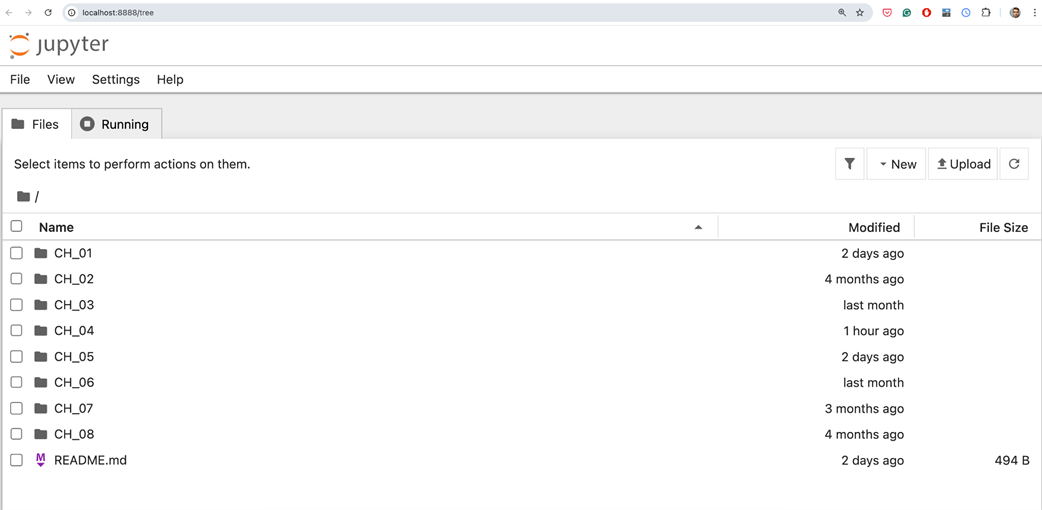
```The jupyter notebook listing view
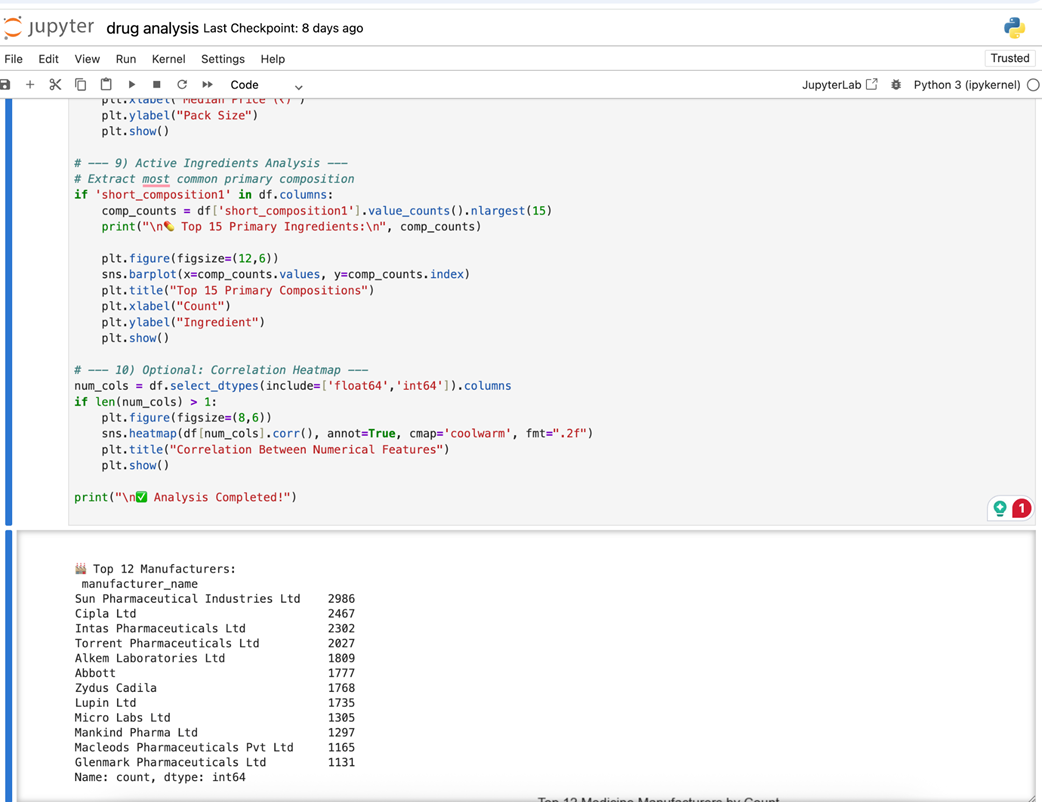
The jupyter notebook showing the analysis of drugs and the top manufacturers' results.
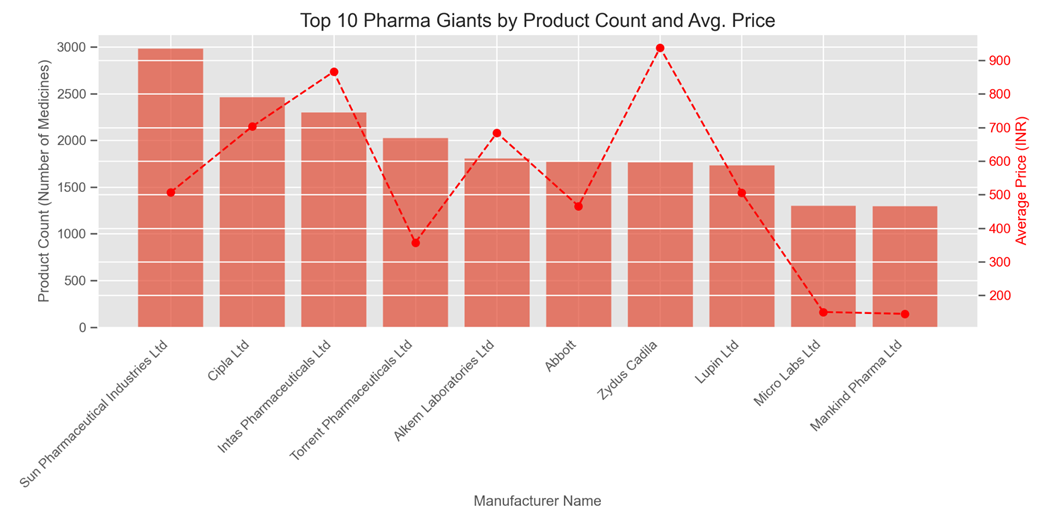
Top 10 drug manufacturers ranked by number of products sold, with each manufacturer’s average drug price shown alongside.
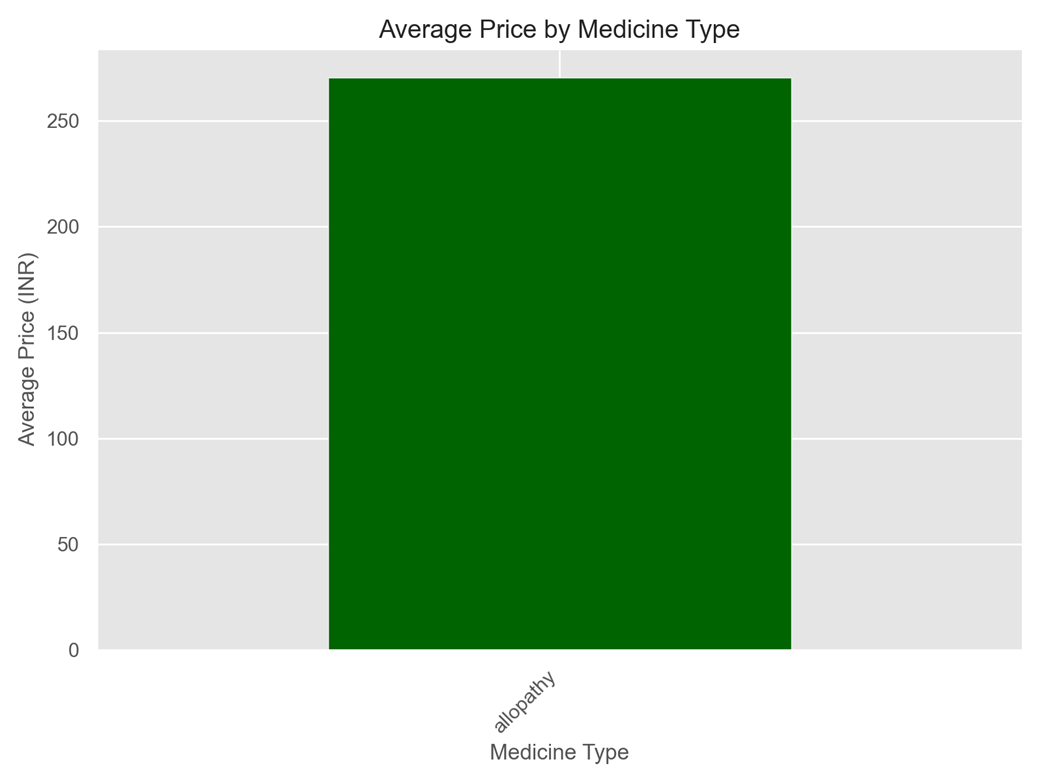
The average price per medicine type
The test/train split of the data.
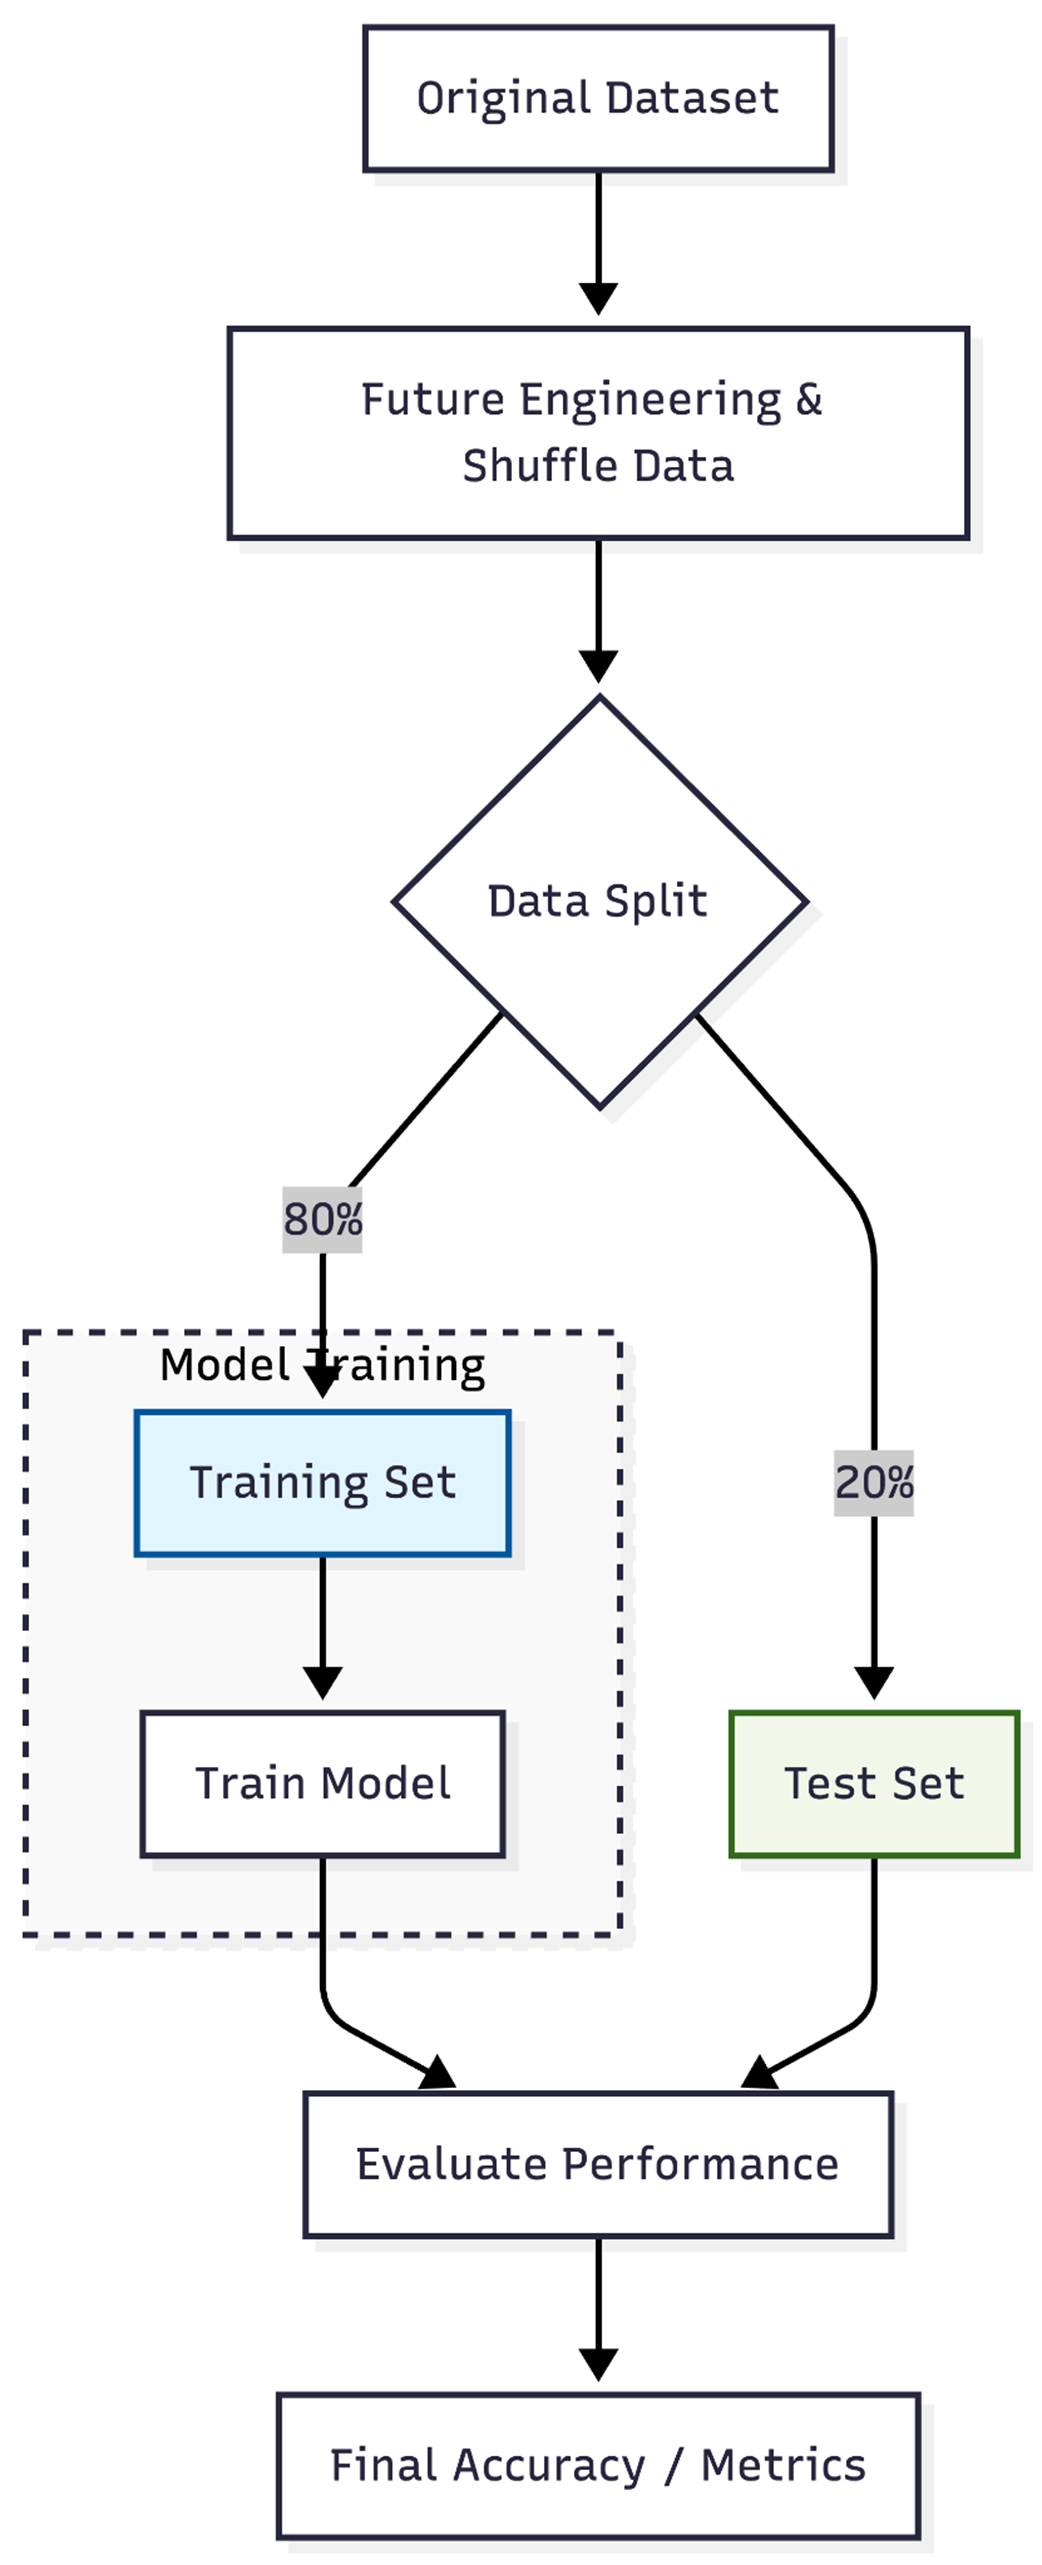
The full prediction of the price ML pipeline.
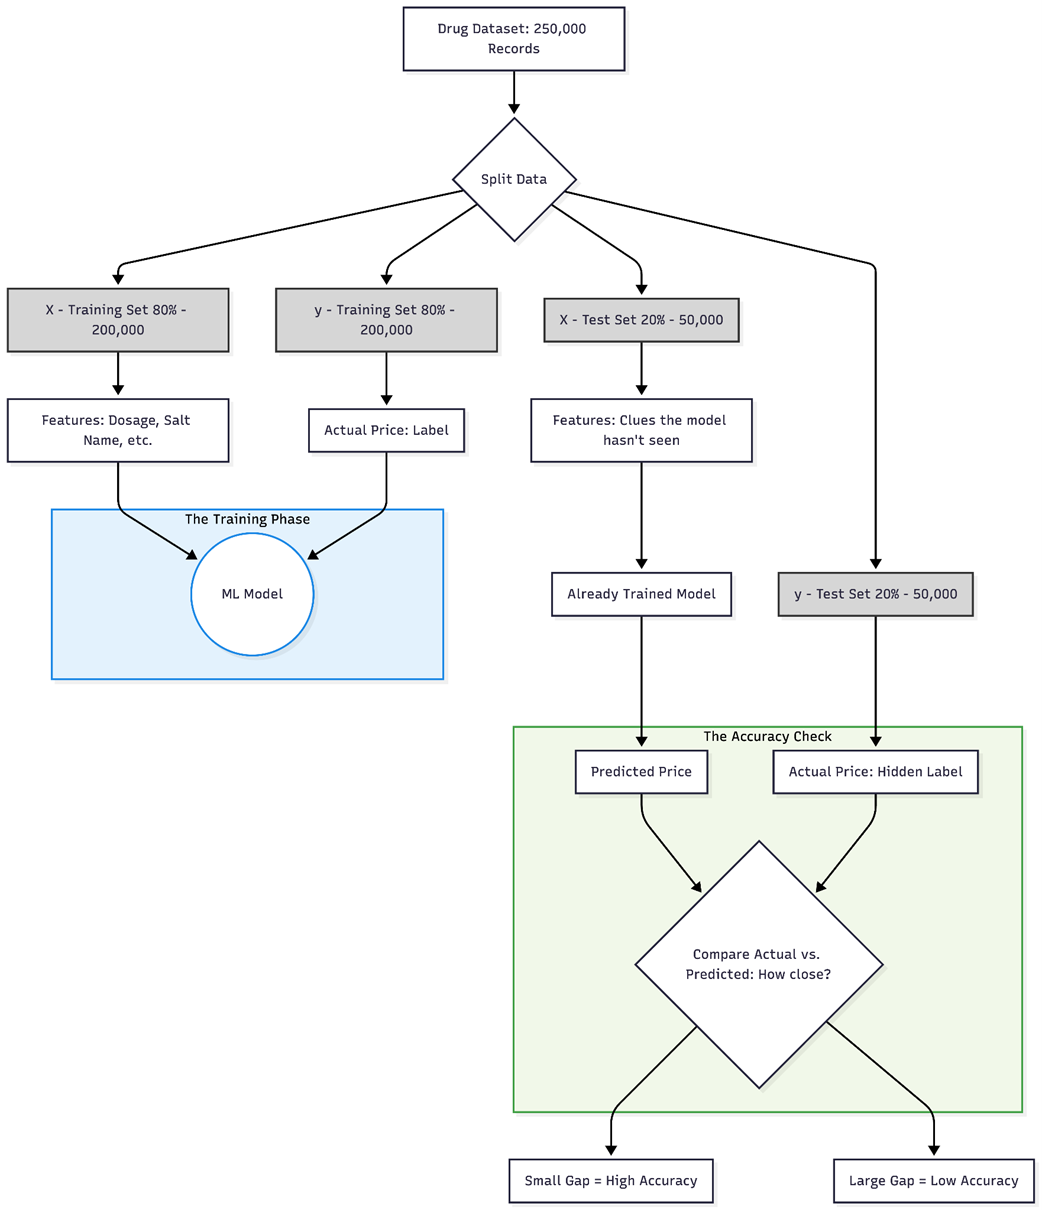
One-hot encoding of the Salt_Name column value.

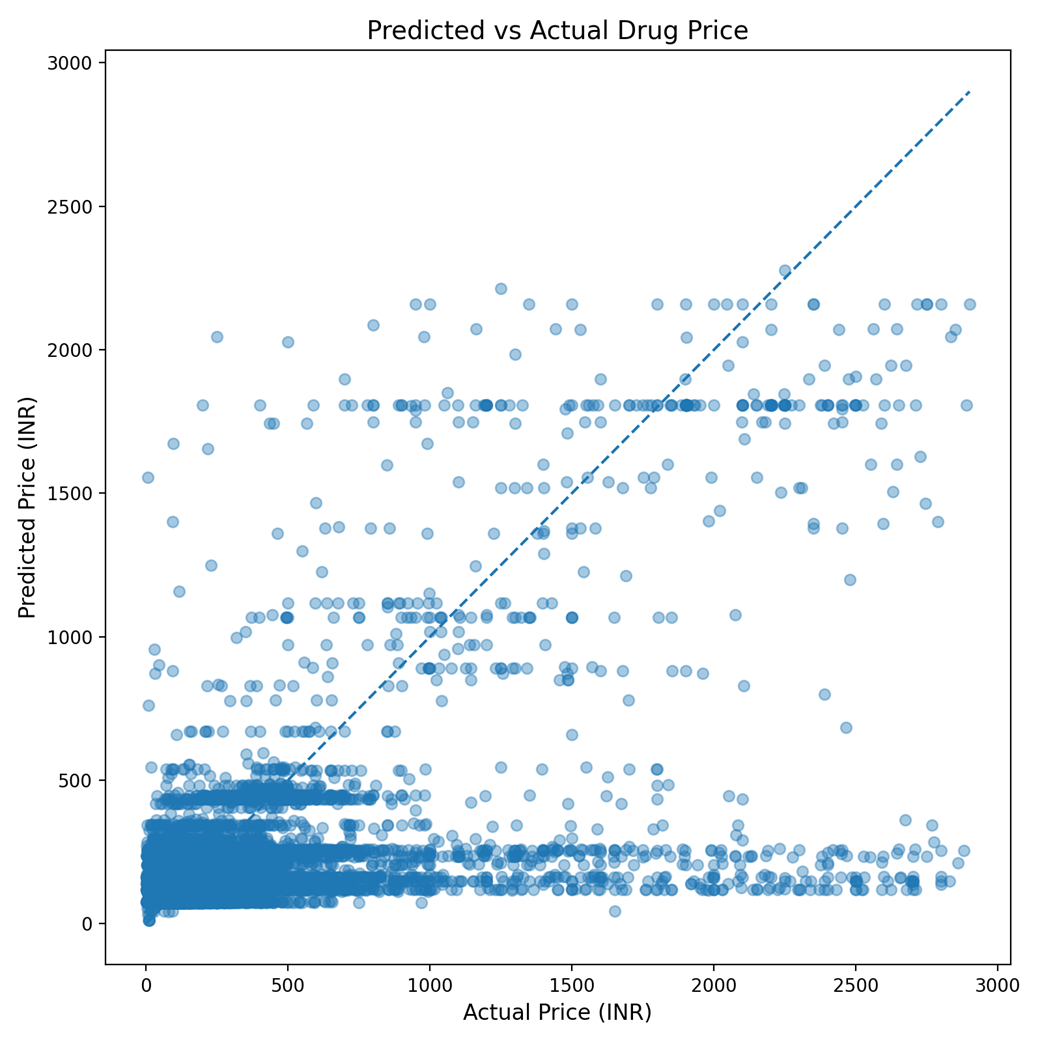
Predicted vs. Actual Drug Price: This visualization compares actual drug prices against the model's predictions. The dashed identity line represents perfect accuracy, while the blue dots show real-world performance. The plot illustrates a high concentration of accurate predictions for low-cost medications, with increasing variance and under-prediction as actual drug prices rise.
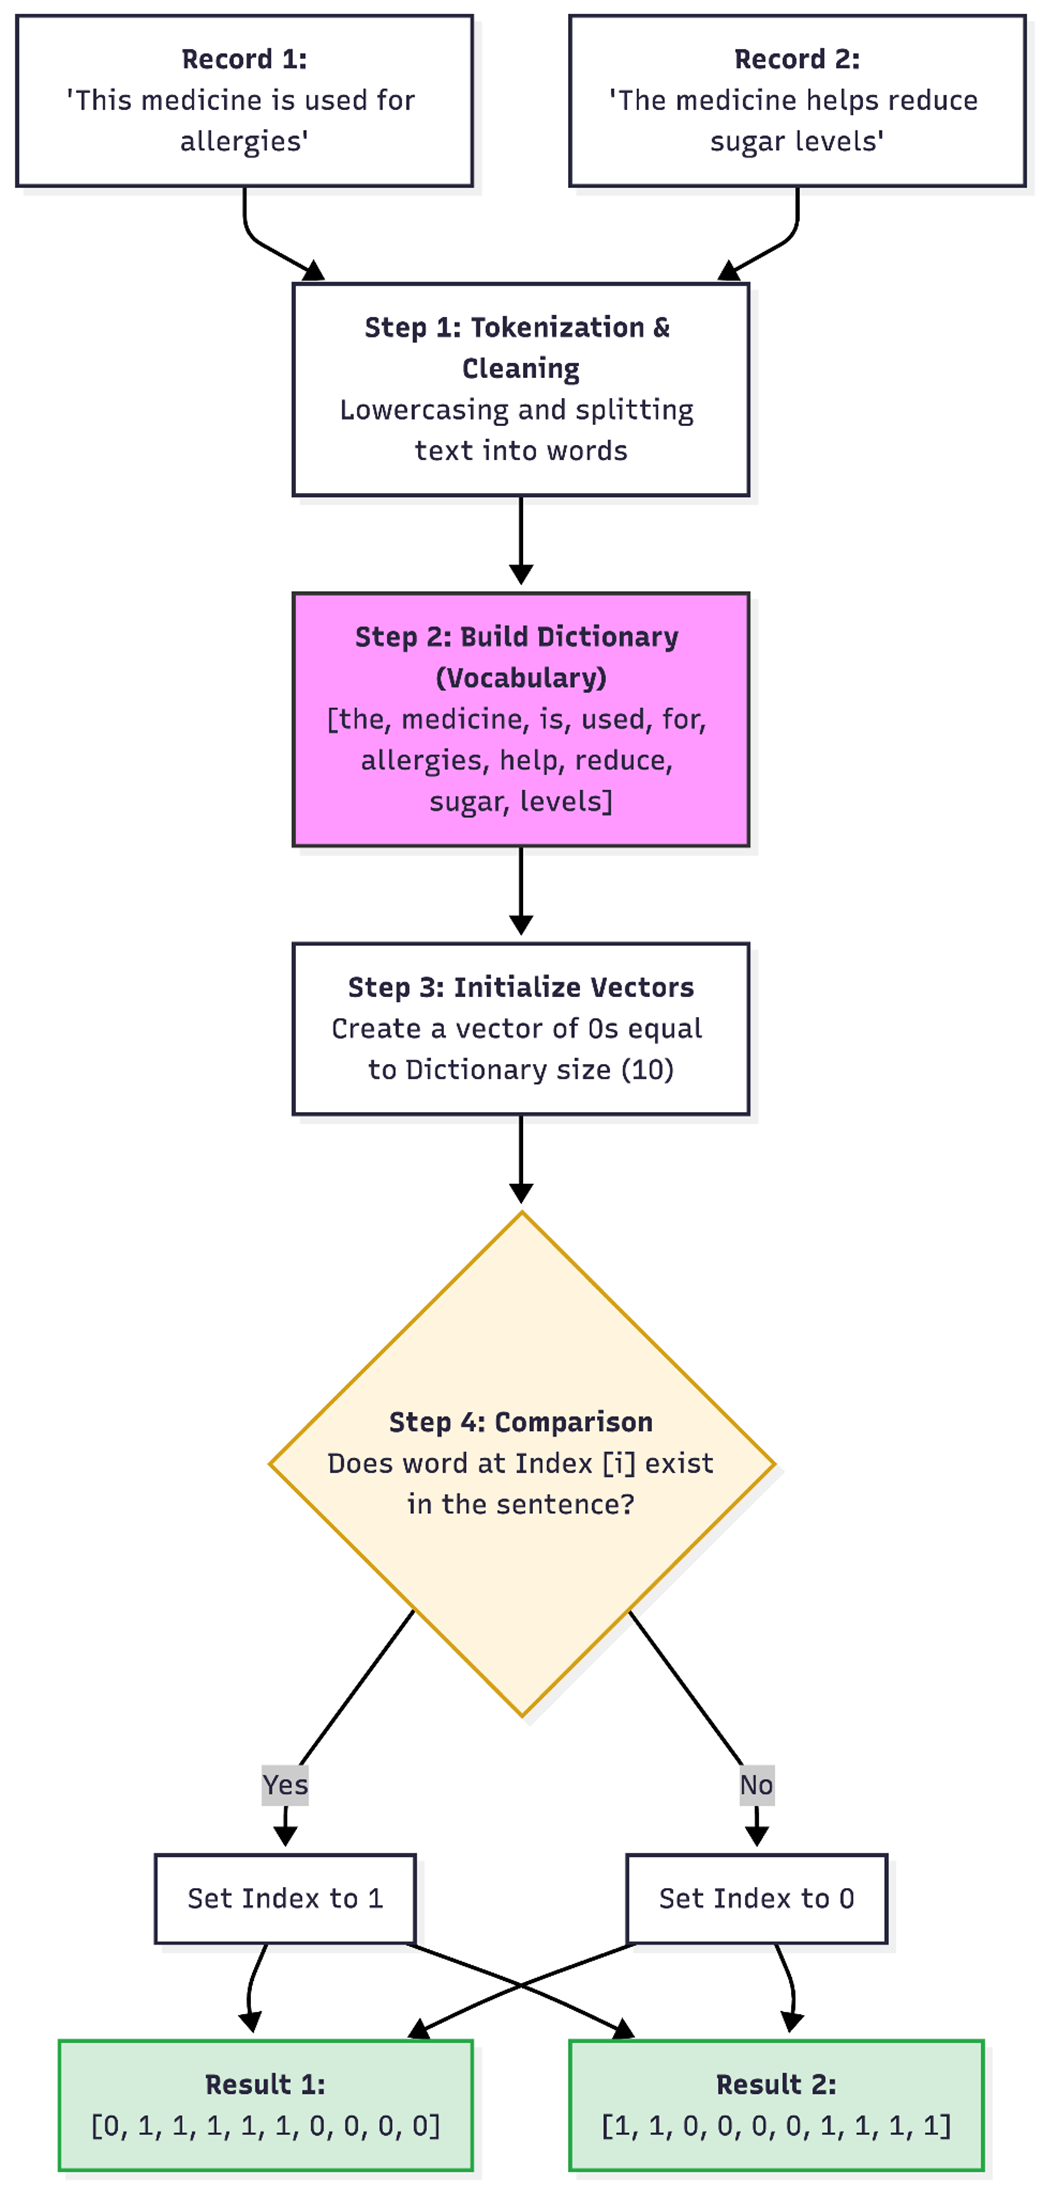
The tokenization process
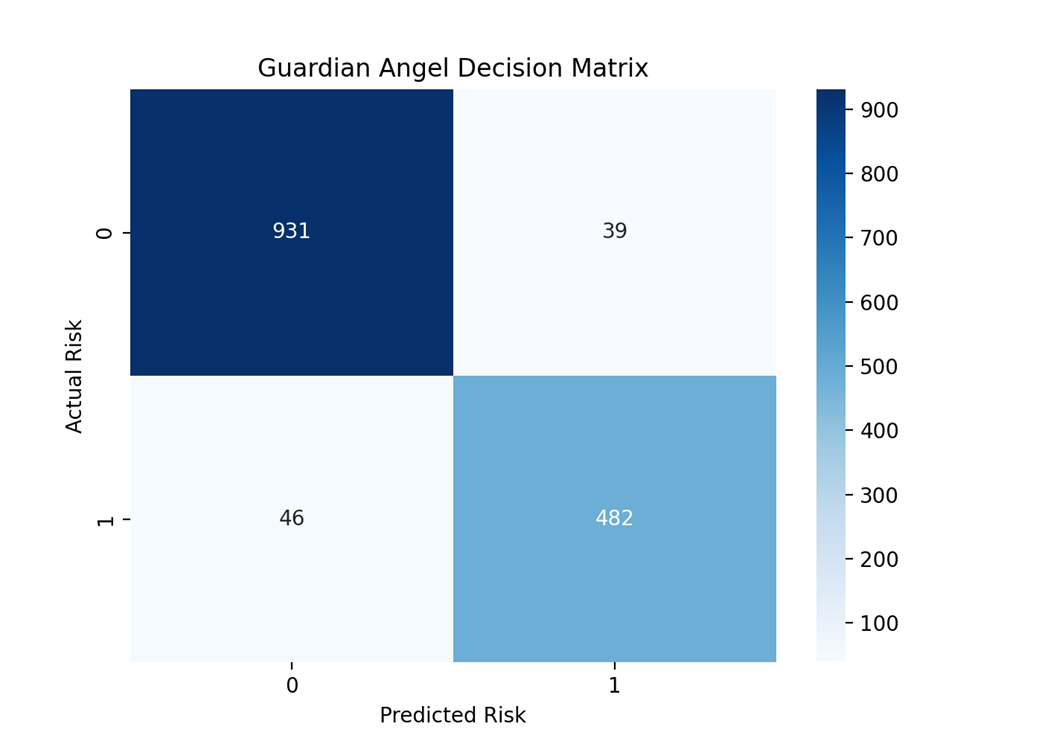
The classification accuracy: confusion matrix shows that most (931) of the actual false values were predicted as false, and most of the true values (491) were predicted as true.
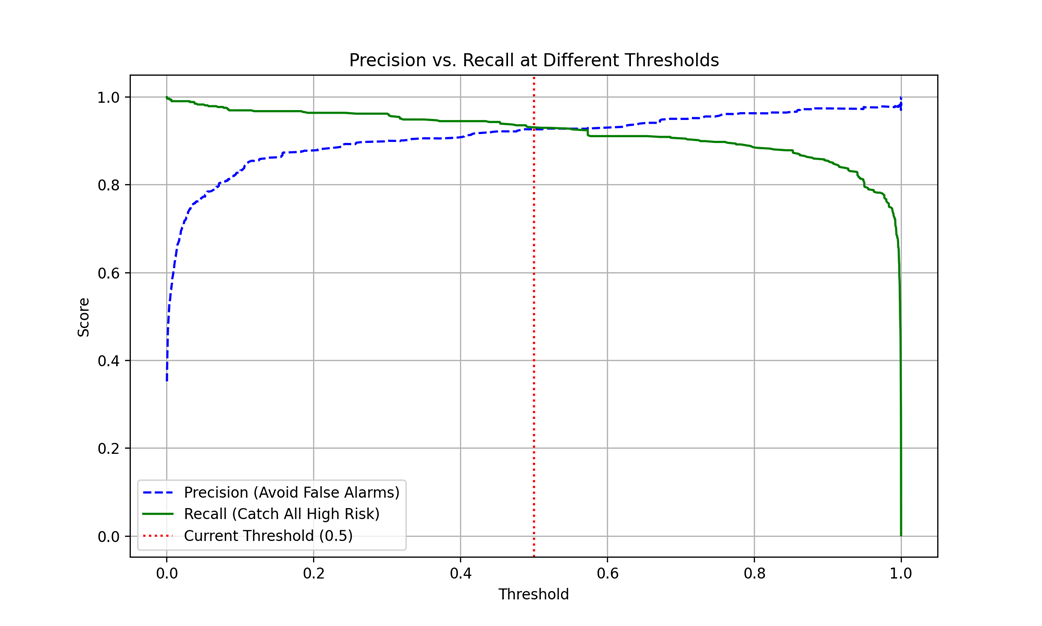
Precision vs. Recall at Different Thresholds.
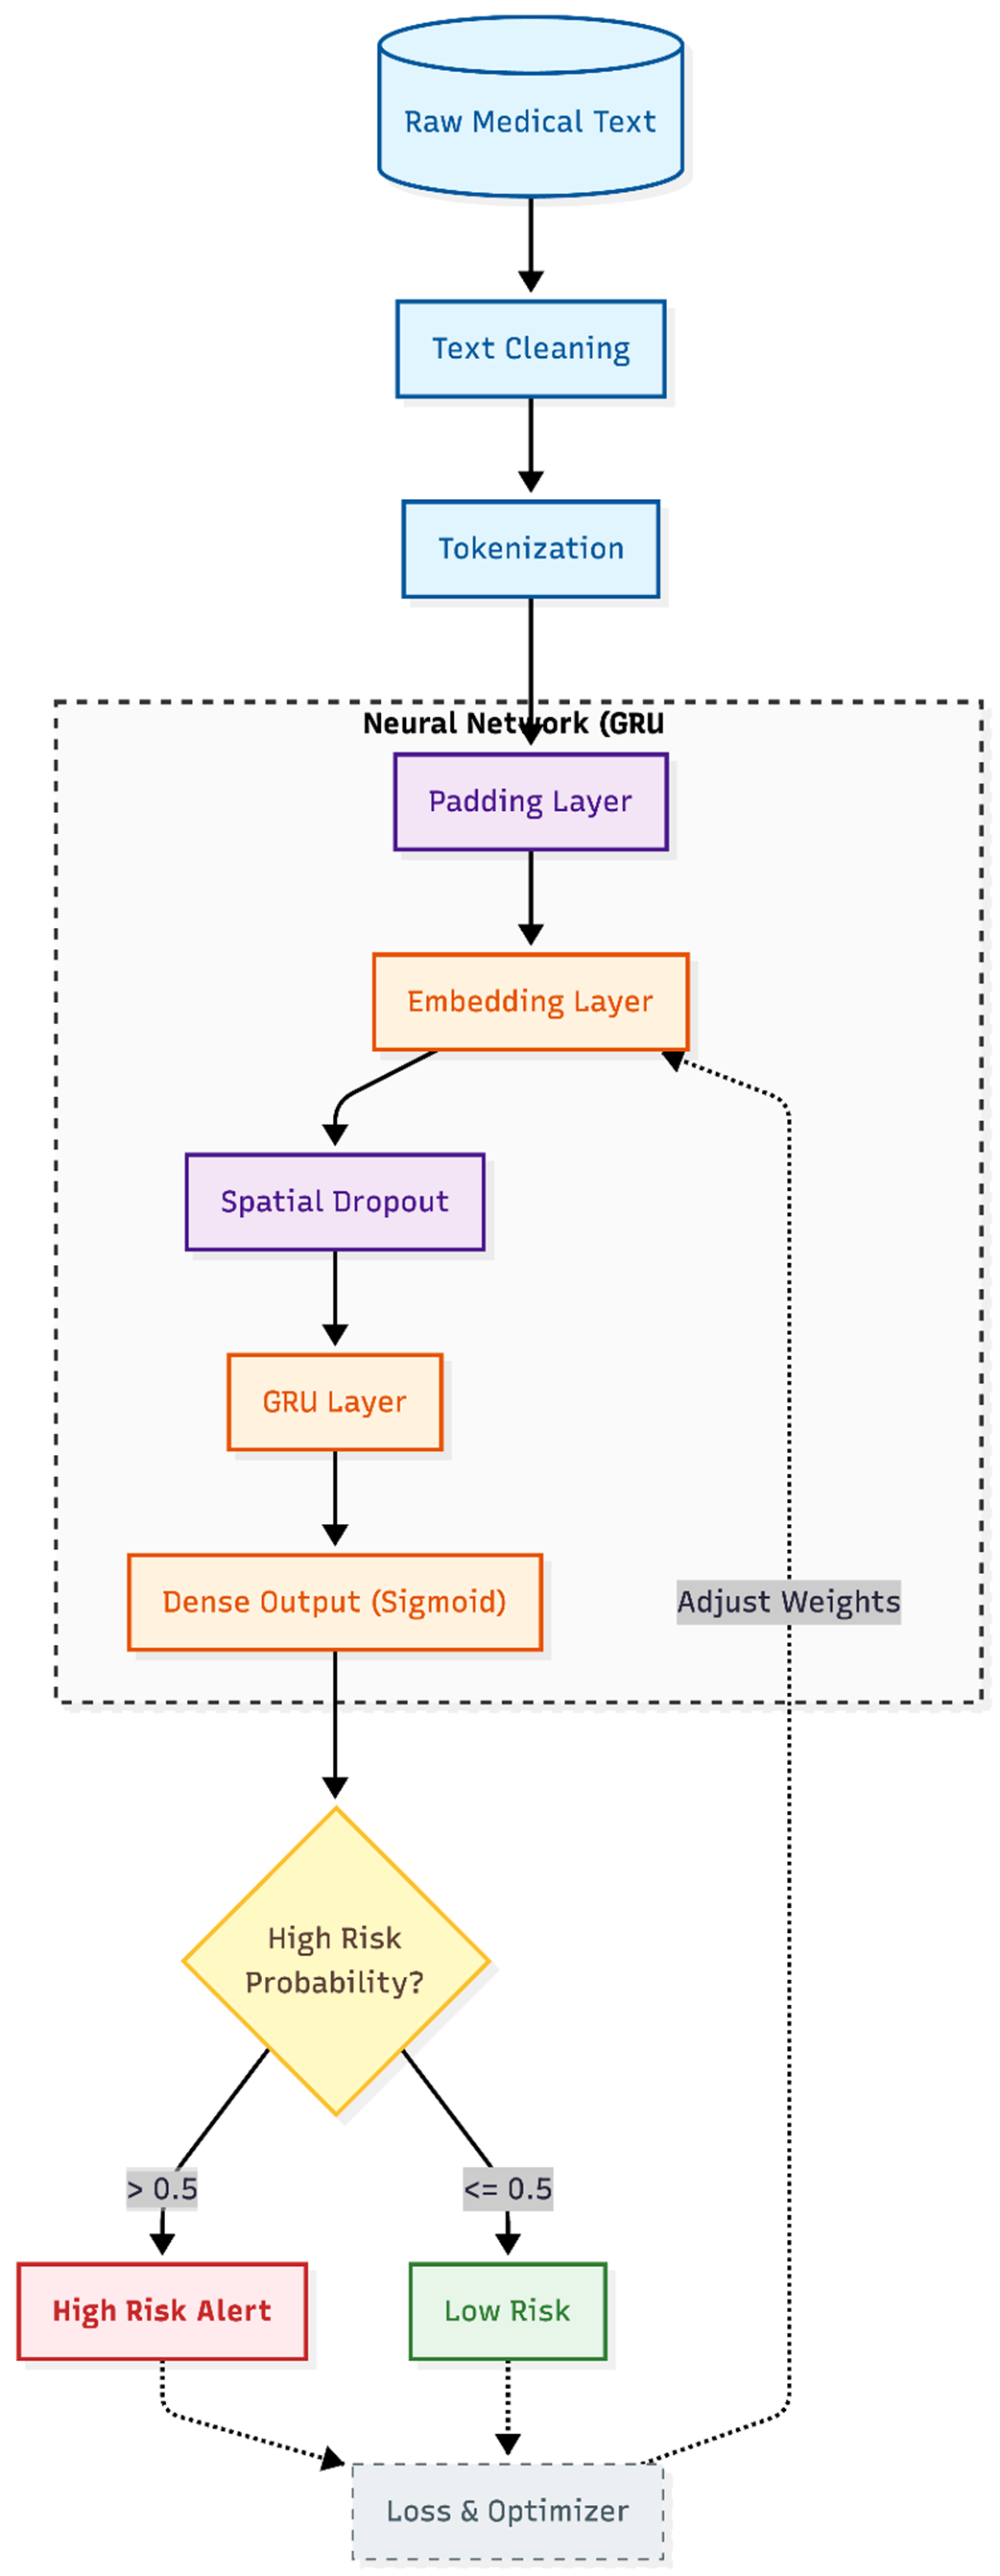
The classification pipeline architecture
Summary
- With the power of LLM-Driven Data Science, the barrier between a business question and a sophisticated technical solution has virtually disappeared. By shifting the focus from "how to code" to "what to ask," you can build robust analytics, feature engineering pipelines, and deep learning models using Vibe Engineering techniques.
- While synthetic datasets are "clean," they often lack the messy distributions and outliers of the real world. Using LLMs to find and compare real-world datasets (like the Indian Medicine Dataset) ensures your models are grounded in actual market behavior and alleviates the mistake of creating models that won’t be useful in real-world use cases.
- There is a trade-off between using LLMs as explorers (letting the AI suggest what's interesting) or executors (giving specific business questions). The best results often come from an iterative mix: letting the AI show you the data "vibe" first, then refining with targeted questions.
- The most time-consuming part of data science - parsing strings and normalizing units - is where LLMs shine. However, a "trust but verify" approach is essential; small prompt adjustments can move extraction accuracy from 88% to 99%. Leaving everything to LLMs can cost us a lot of lost data that, where each of the data points is priceless.
- Building a price estimator taught us that features are "clues" and labels are "answers." Even with a "black box" approach, understanding metrics like R2 and MAE (Mean Absolute Error) is vital to know if your model is a "crystal ball" or just a ballpark estimator.
- We transitioned from simple statistics to Deep Learning by teaching the AI to "feel the vibe" of drug descriptions. This showed that complex architectures (Embeddings, GRUs) can be implemented without writing a single line of code, provided you understand the flow of data.
- We learned the trade-off between precision and recall for classification tasks, using the example of High Risk vs. Low Risk. The default 0.5 threshold is rarely optimal. Using LLMs to visualize the Precision-Recall curve allows you to tune the model for specific business needs—prioritizing safety, avoiding false alarms, and choosing the trade-offs wisely.
FAQ
What is the main goal of LLM-driven data science in this chapter?
The main goal is to use an LLM to translate plain-English business questions into runnable data analysis and machine learning workflows, even for people with little or no Python or ML/DL experience.Why is choosing the right dataset so important?
The dataset determines whether the analysis will be meaningful, large enough, and usable for real-world insights. The chapter recommends selecting a dataset with enough records and real-world relevance, rather than relying on small or synthetic data.Why does the chapter prefer real-world pharmaceutical data over synthetic data?
Real-world data reflects actual market behavior, prices, manufacturers, and messy conditions that models must handle in practice. Synthetic data may be cleaner, but it can produce unrealistically good results that do not transfer well to real analysis.What are the risks of using synthetic data for analytics?
Synthetic data can hide important challenges like outliers, malformed records, and inconsistent formatting. That can lead to models or analyses that look accurate in testing but fail on real-world data.How can an LLM help create a Jupyter notebook for exploratory data analysis?
You can ask the LLM to suggest useful analyses and generate a notebook automatically. In the chapter, this includes tasks like price distribution, manufacturer analysis, discontinuation trends, and composition-based exploration.What does “trust but verify” mean in LLM-driven data science?
It means you should not blindly trust outputs just because they run successfully. In data science, flawed AI-generated code can still produce plausible-looking charts or numbers, so you must validate results against the domain and the data.What feature engineering steps are used before building the price prediction model?
The chapter creates fields such asSalt_Name, Dosage_Value, Dosage_Unit, and Is_Multi_Salt. These features help turn messy text-like medicine information into structured inputs for machine learning.Why is the short_composition field preferred for analysis over salt_composition?
short_composition is more structured and better suited for extracting individual ingredients and dosage values. salt_composition is more human-readable and useful for display, but less ideal as a primary analytical feature.
 Vibe Engineering ebook for free
