7 Investigating locks in multithreaded architectures
Multithreaded applications are powerful but notoriously tricky: synchronization constructs prevent data races while simultaneously introducing lock contention, stalls, and subtle performance pathologies. The chapter equips you to monitor threads, identify what locks them and why, and analyze cases where threads are actively waiting. With a grounding in Java thread states and synchronization, the emphasis is on gaining visibility into execution so you can catch inefficiencies early and turn hunches into evidence.
Using a simple producer–consumer example that shares an ArrayList guarded by synchronized blocks, the chapter demonstrates a practical workflow: start with sampling to spot symptoms (for example, total time exceeding CPU time implies waiting), then switch to instrumentation to trace exactly which monitors and threads are involved. VisualVM and JProfiler show alternating execution where one thread runs while the other is blocked on the same monitor, with balanced lock counts that indicate fairness and no starvation. Grouping events by thread or monitor helps pinpoint hotspots, while interpreting self time versus CPU time clarifies whether a method is executing or merely stuck. The broader takeaway is to minimize lock duration, reduce contention, and, where appropriate, rebalance work (e.g., batching or adjusting producer/consumer roles) based on measured behavior.
The chapter then contrasts locked threads with waiting threads and evaluates a wait/notify variant of the same workflow. Although making consumers wait when the list is empty and producers wait when it is full sounds reasonable, profiling shows it performs worse: there are fewer lock acquisitions but far longer overall execution because time shifts into prolonged waits. The lesson is clear—never trust an optimization by intuition alone; always measure the actual impact with a profiler, verify fairness and throughput against your goals, and iterate. When investigations grow complex, exporting profiler data and using automated analysis can speed diagnosis and help you focus on the changes that truly improve performance.
The app starts two threads that we refer to as “the producer” and “the consumer.” Both threads use a common resource: they change a list instance of type ArrayList. The producer generates random values and adds them to the list, while the consumer concurrently removes the values added by the producer.
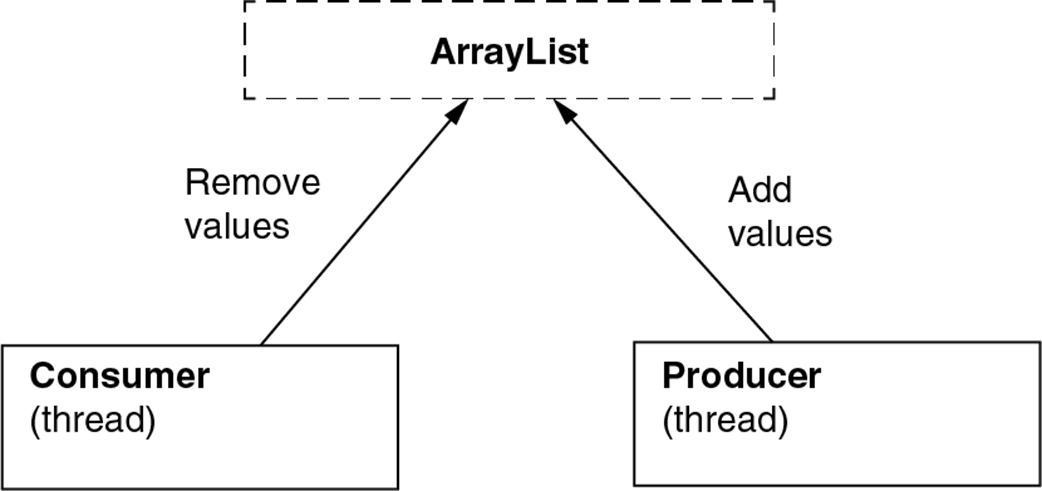
Only one thread at a time can be in the synchronized block. Either the producer executes the logic defined in its run() method or the consumer executes its logic.
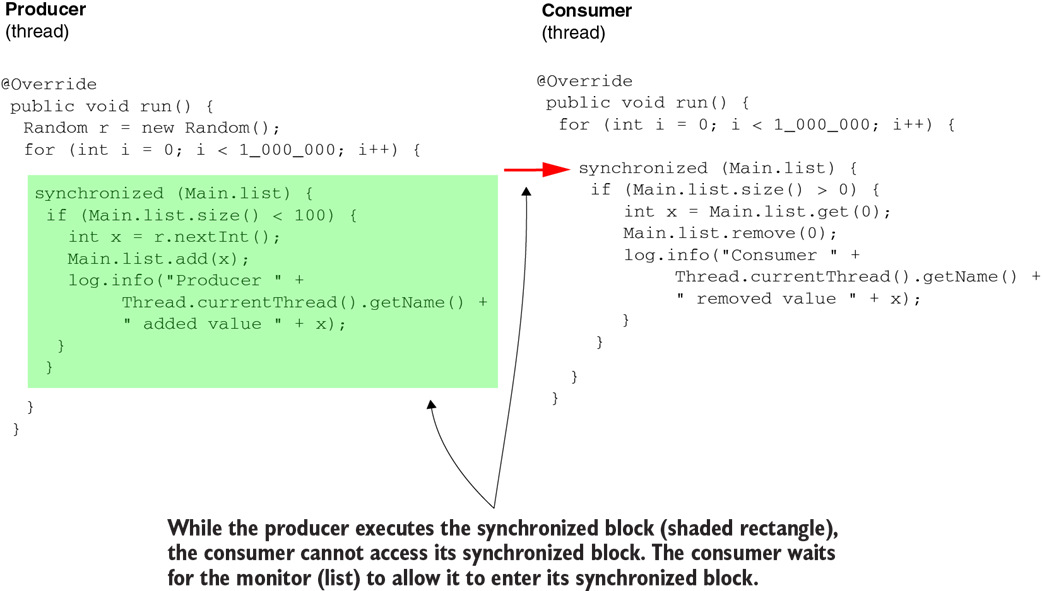

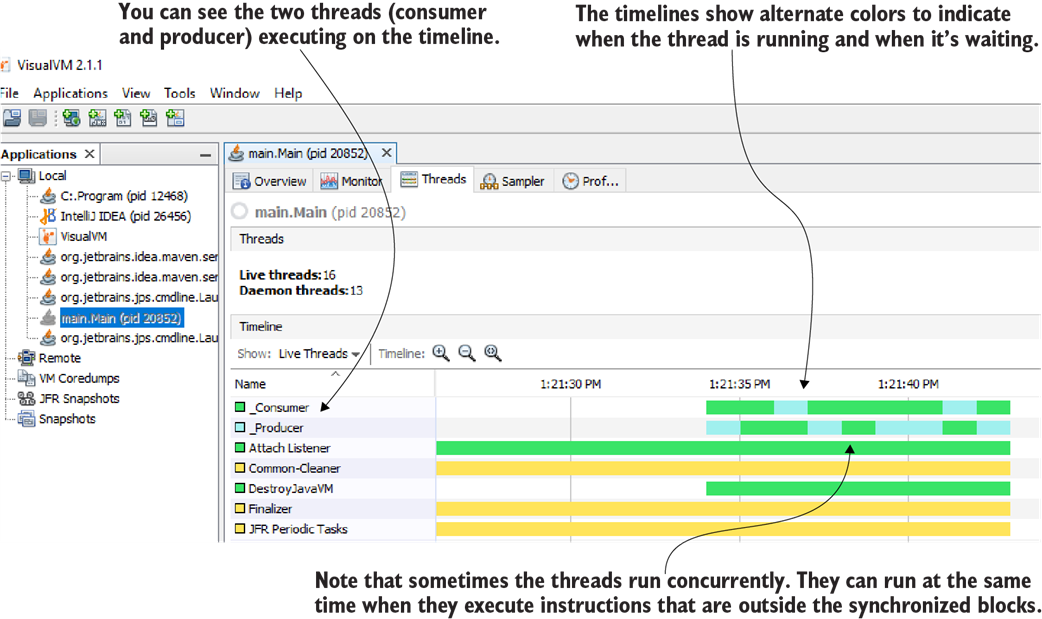
In most cases, the threads will sequentially lock each other and execute their synchronized blocks of code. The two threads can still concurrently execute the instructions, which are outside the synchronized block.
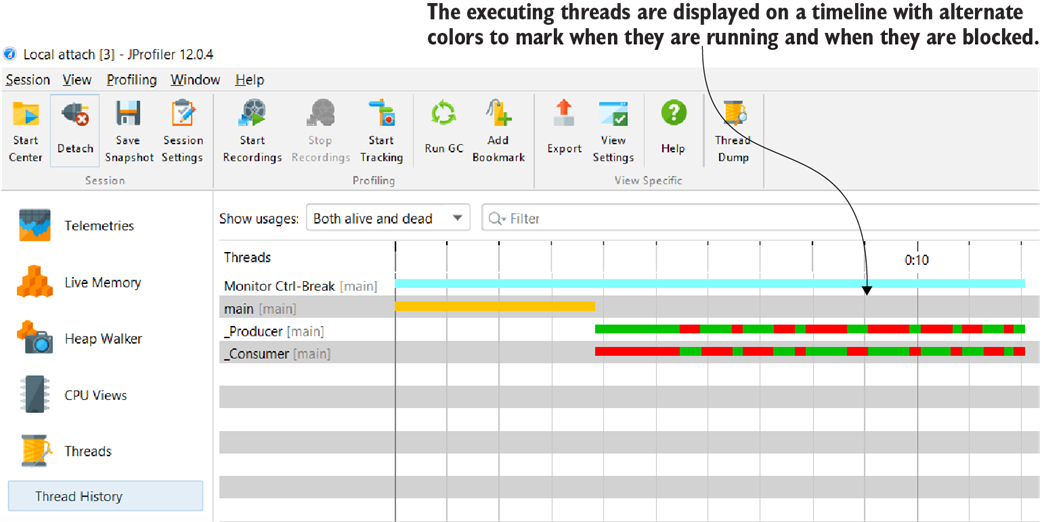
You can use other profilers instead of VisualVM. Here, you see the way thread timelines are displayed in JProfiler.
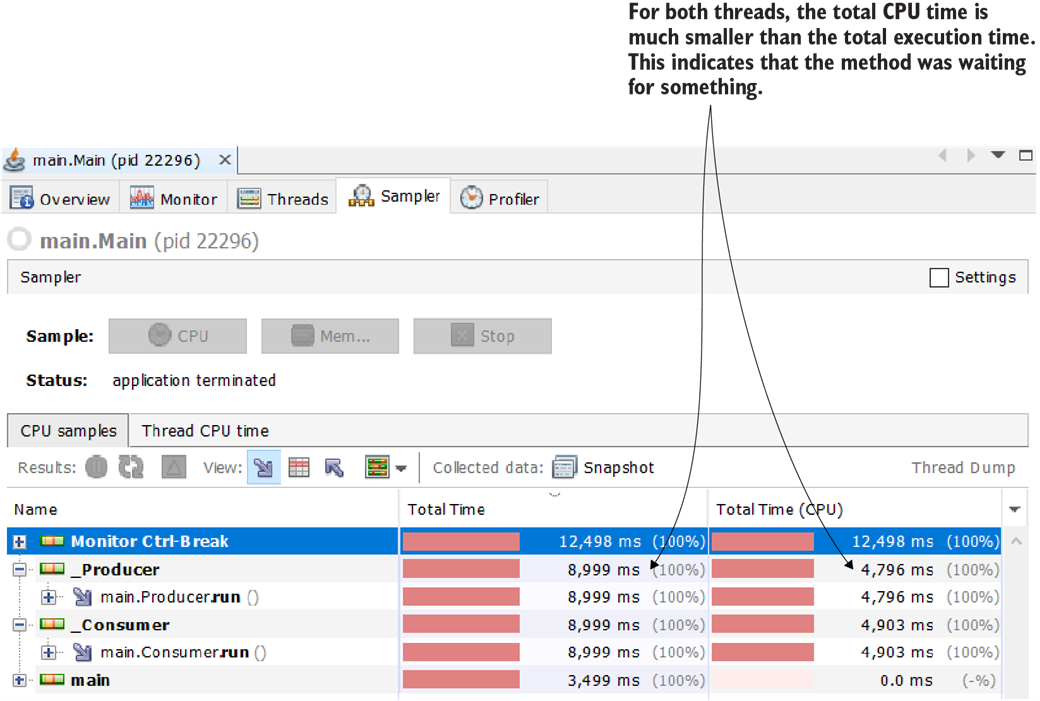
When the total CPU time is shorter than the total execution time, it means the app is waiting for something. We want to figure out what the app waits for and if this time can be optimized.
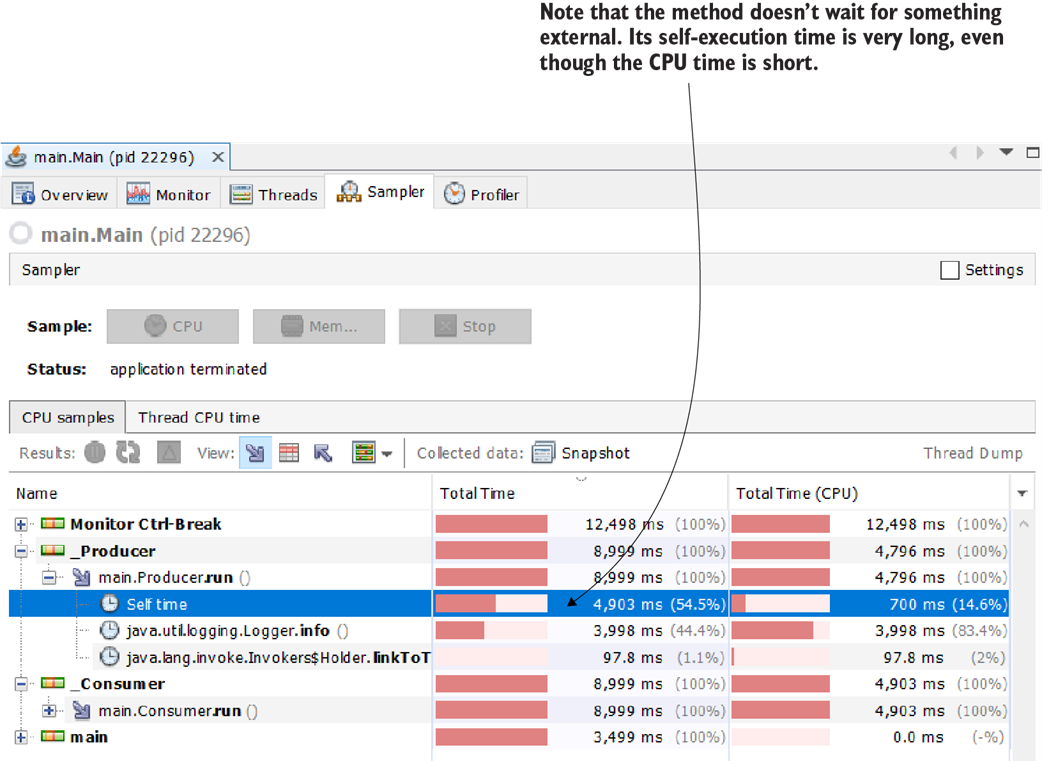
The method doesn’t wait for something, but instead it waits for itself. We observe that its self-execution time is longer than the total CPU time, which usually means that the thread is locked. The thread could have been blocked by another thread.
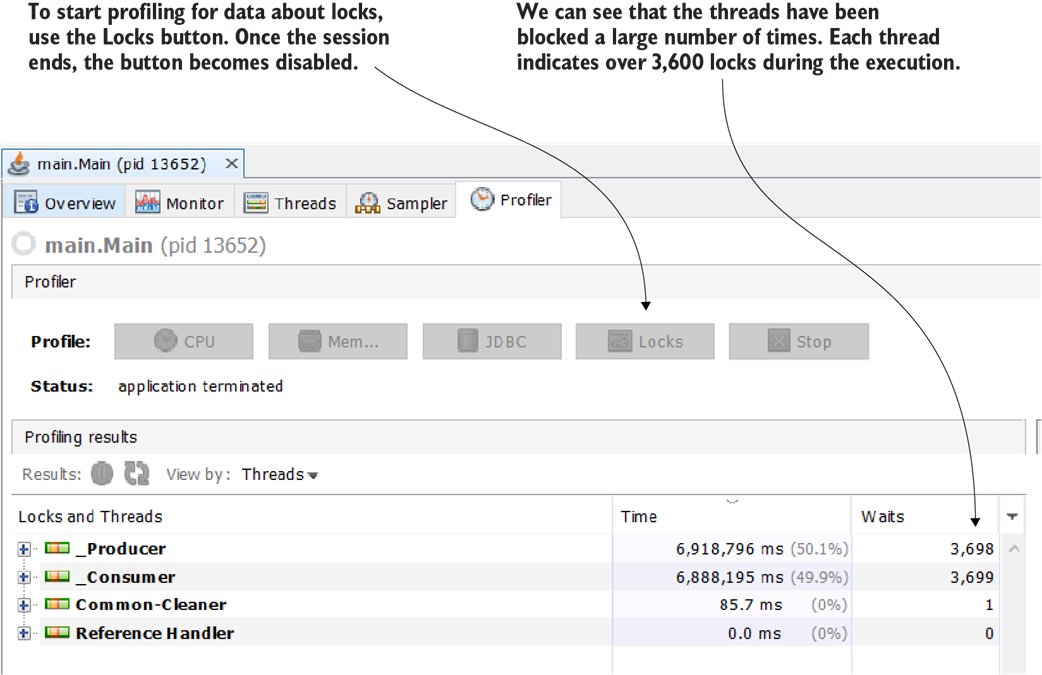
To start profiling for locks, use the Locks button in the Profiler tab. At the end of the profiling session, we observe more than 3,600 locks on each of our producer and consumer threads.
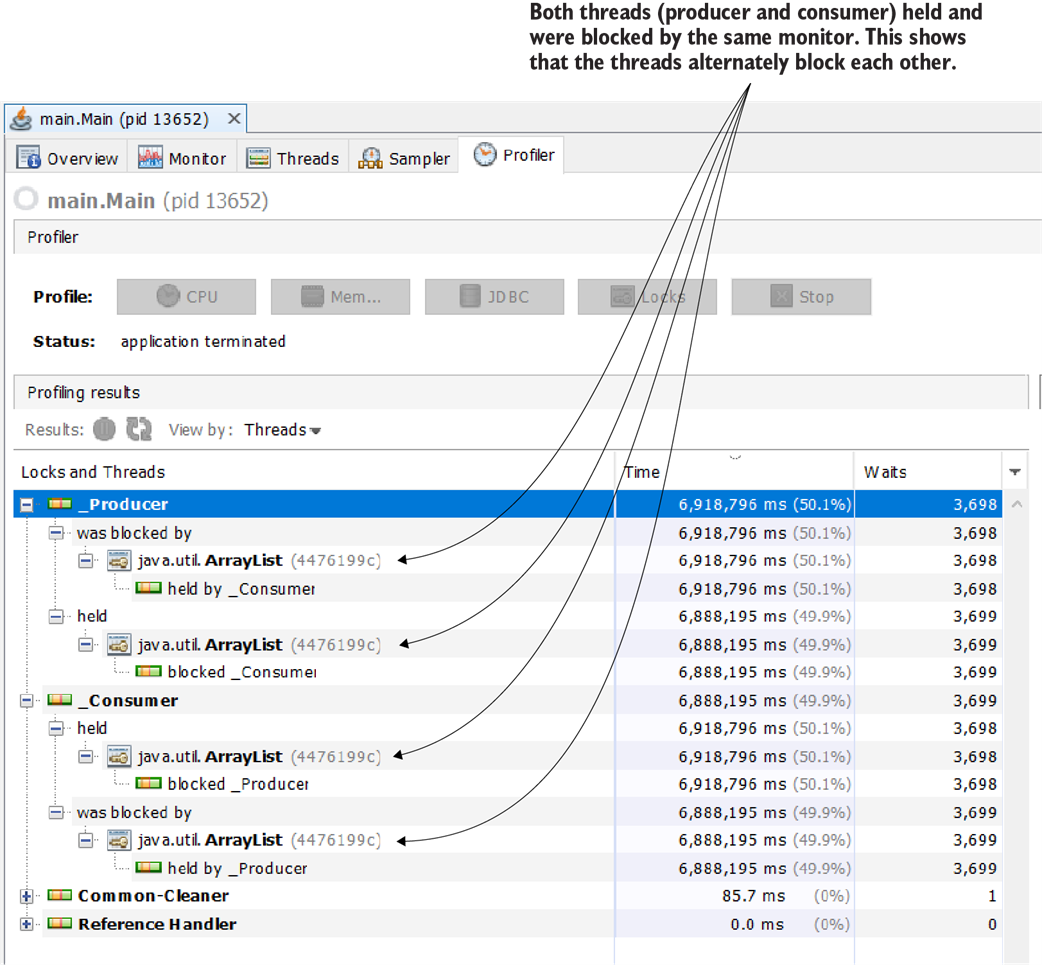
The profiling results give us a good understanding of what creates locks and what is affected by them. We see that there’s only one monitor the producer thread works with. Also, the consumer thread blocked the producer thread 3,698 times using the monitor. Using the same monitor instance, the producer blocked the consumer for a similar number of times: 3,698.
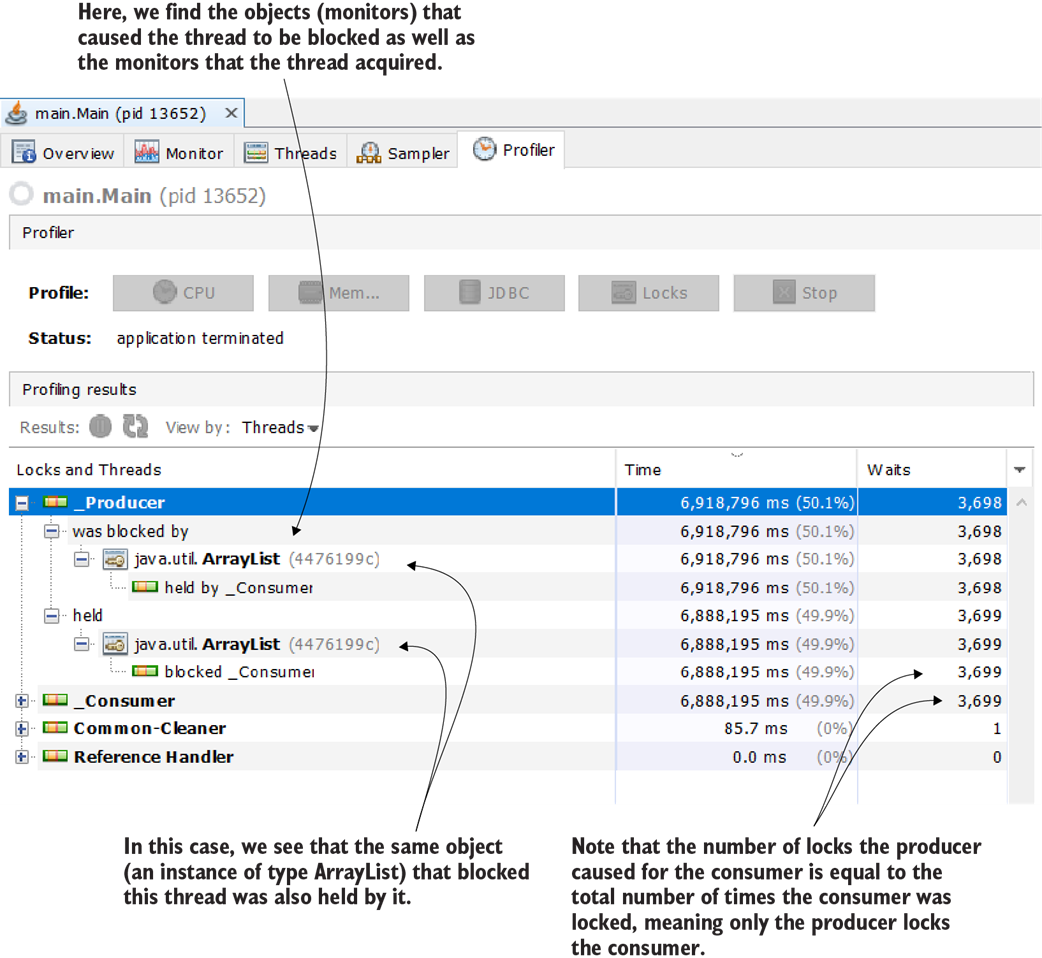

Both threads use the same monitor to block each other. While one thread executes the synchronized block with an ArrayList instance monitor, the other waits. This way, one thread is locked for 3,698 times and the other for 3,698.
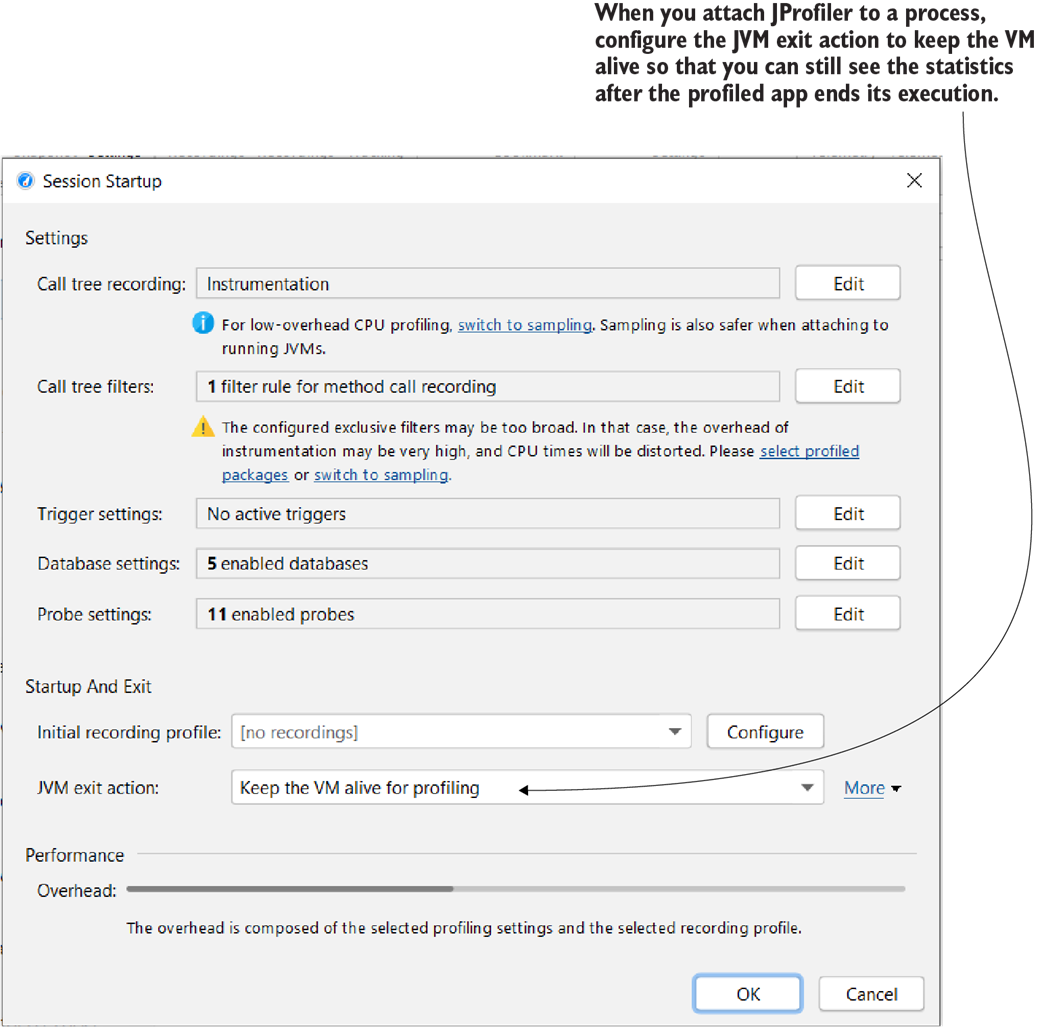
When starting the profiling session with JProfiler, remember to set the JVM action to Keep the VM Alive for Profiling so that you can see the profiling results after the app finishes its execution.
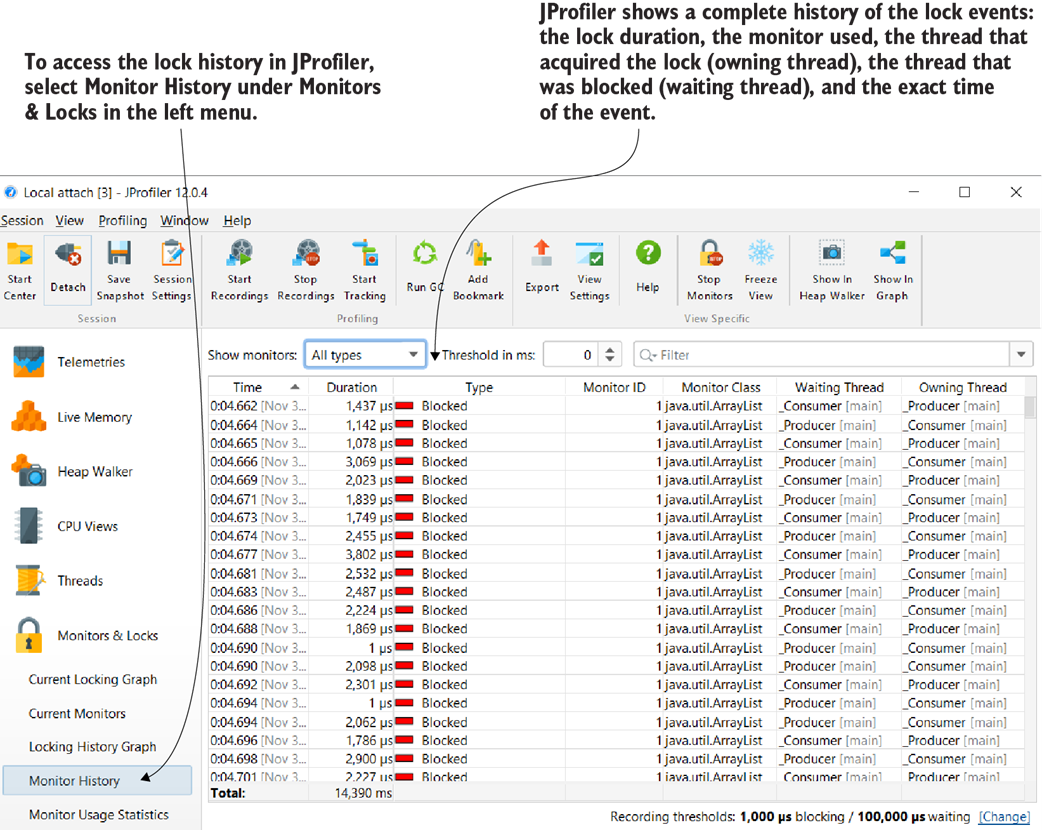
JProfiler shows a detailed history of all the locks the app’s threads encountered. The tool displays the exact time of the event, the event duration, the monitor that caused the lock, and the threads that were involved.
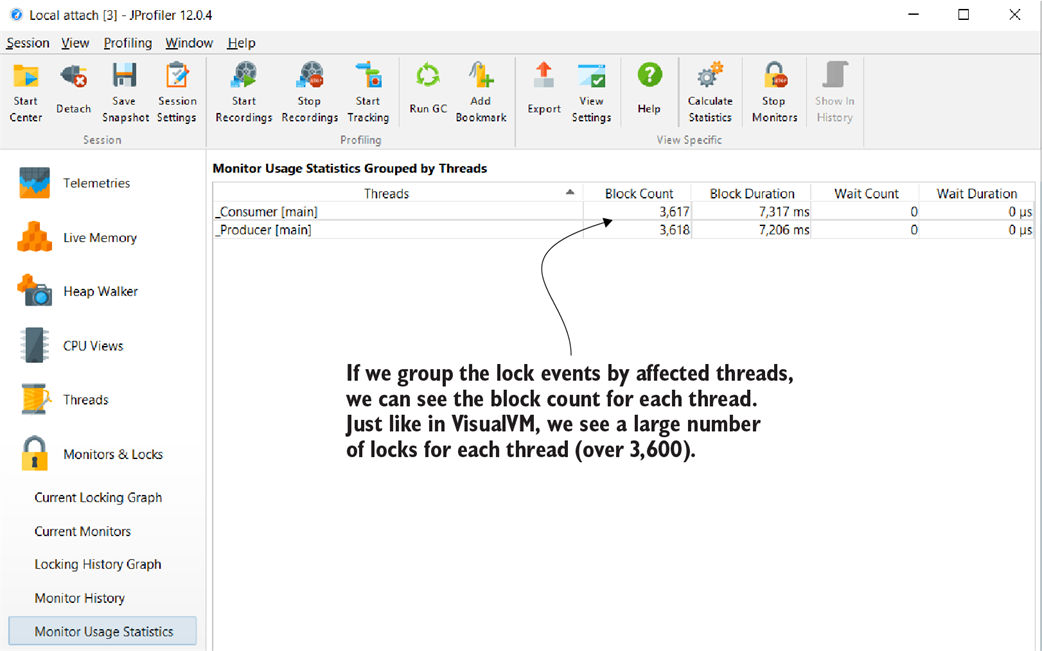
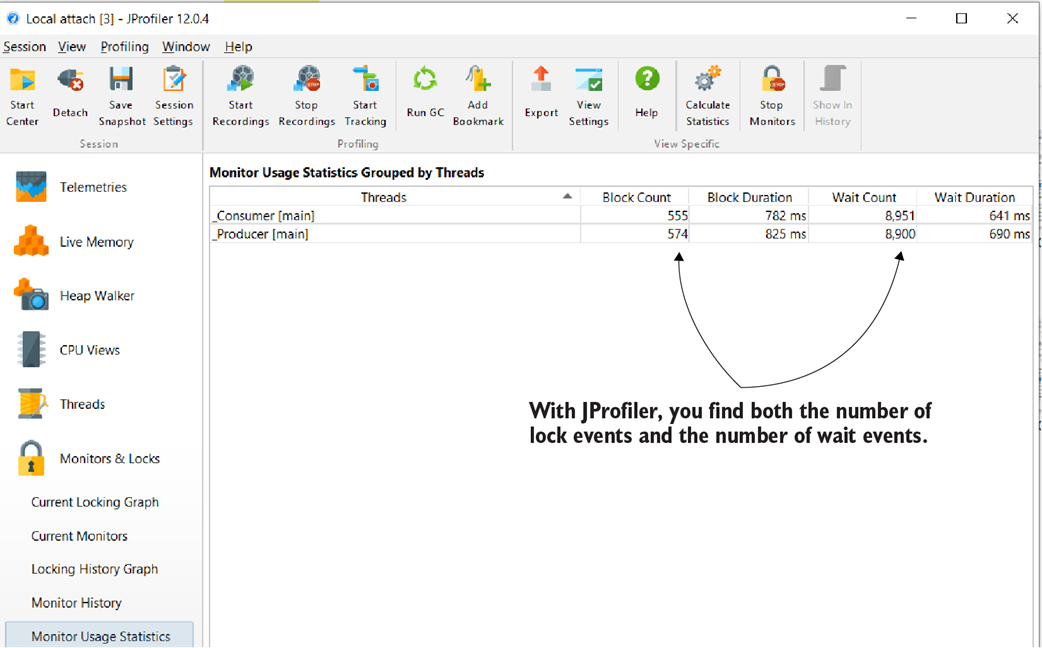
You can group the lock events by threads involved or by monitors using the Monitor Usage Statistics section. You can use the aggregated view to understand which threads are more affected and what affects them or which monitor causes the threads to stop more often.
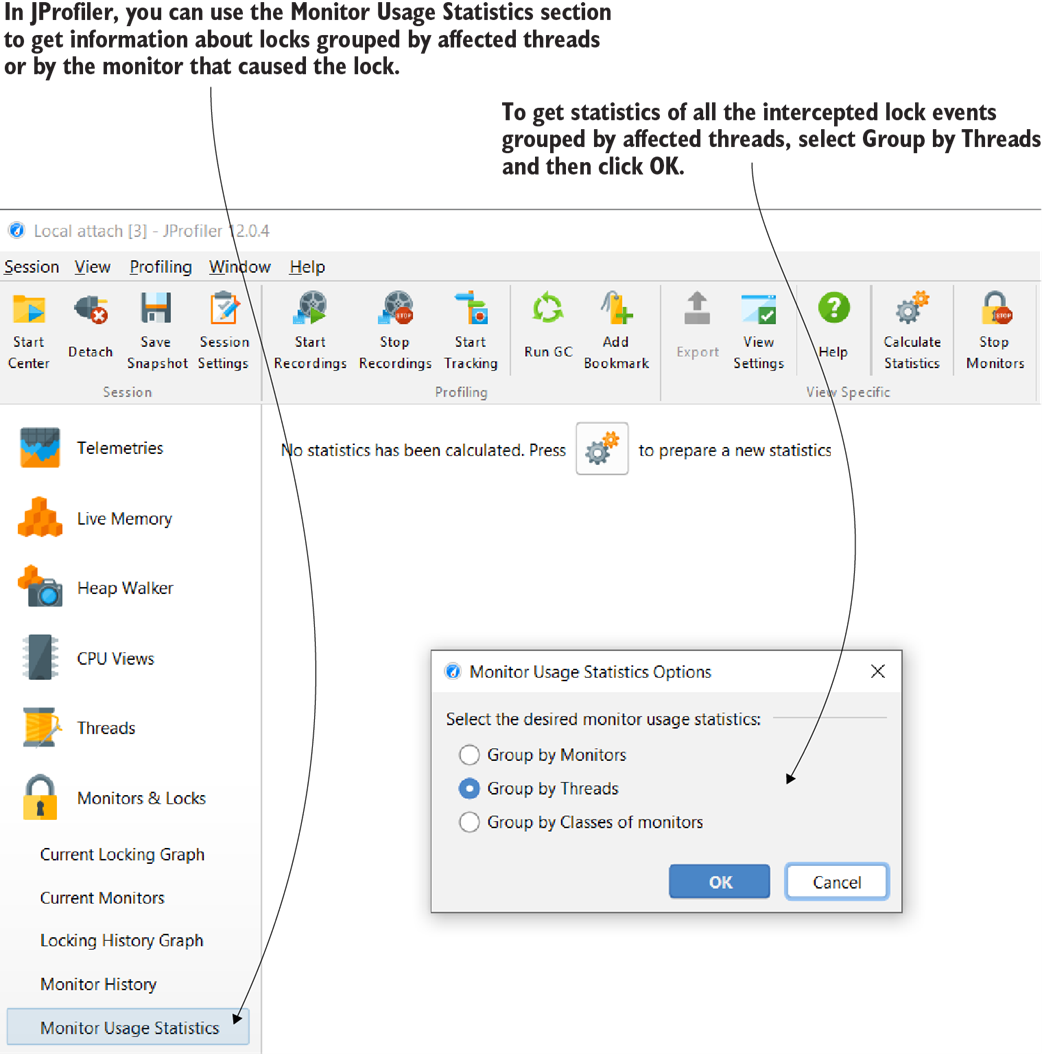
Grouping the lock events by threads provides you with an aggregated view showing how many times each of the threads locked during its execution.
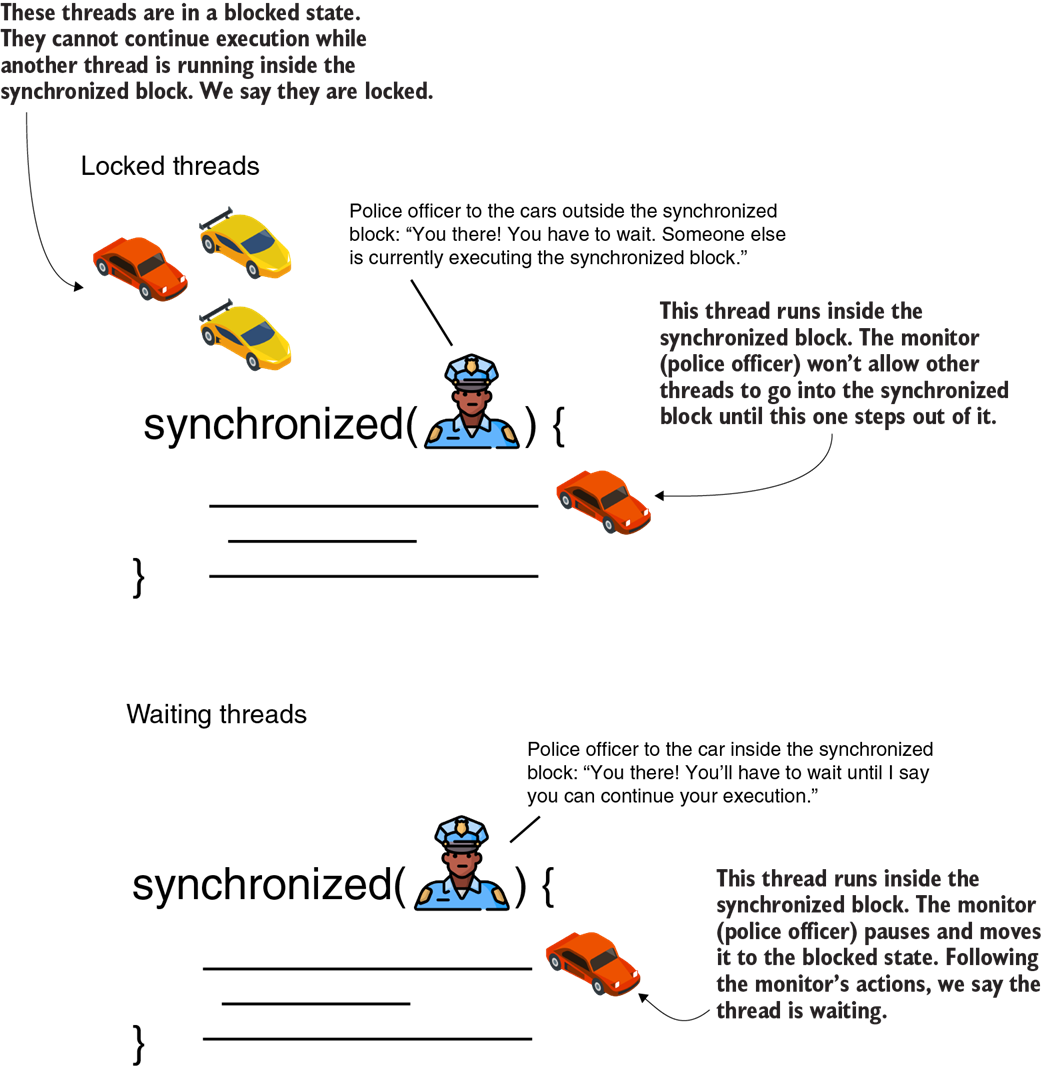
Locked threads versus waiting threads. A locked thread is blocked at the entrance of a synchronized block. The monitor won’t allow a thread to enter a synchronized block while another thread actively runs inside the block. A waiting thread is a thread that the monitor has explicitly set to the blocked state. The monitor can make any thread inside the synchronized block it manages wait. The waiting thread can continue its execution only after the monitor explicitly tells it that it can proceed with its execution.
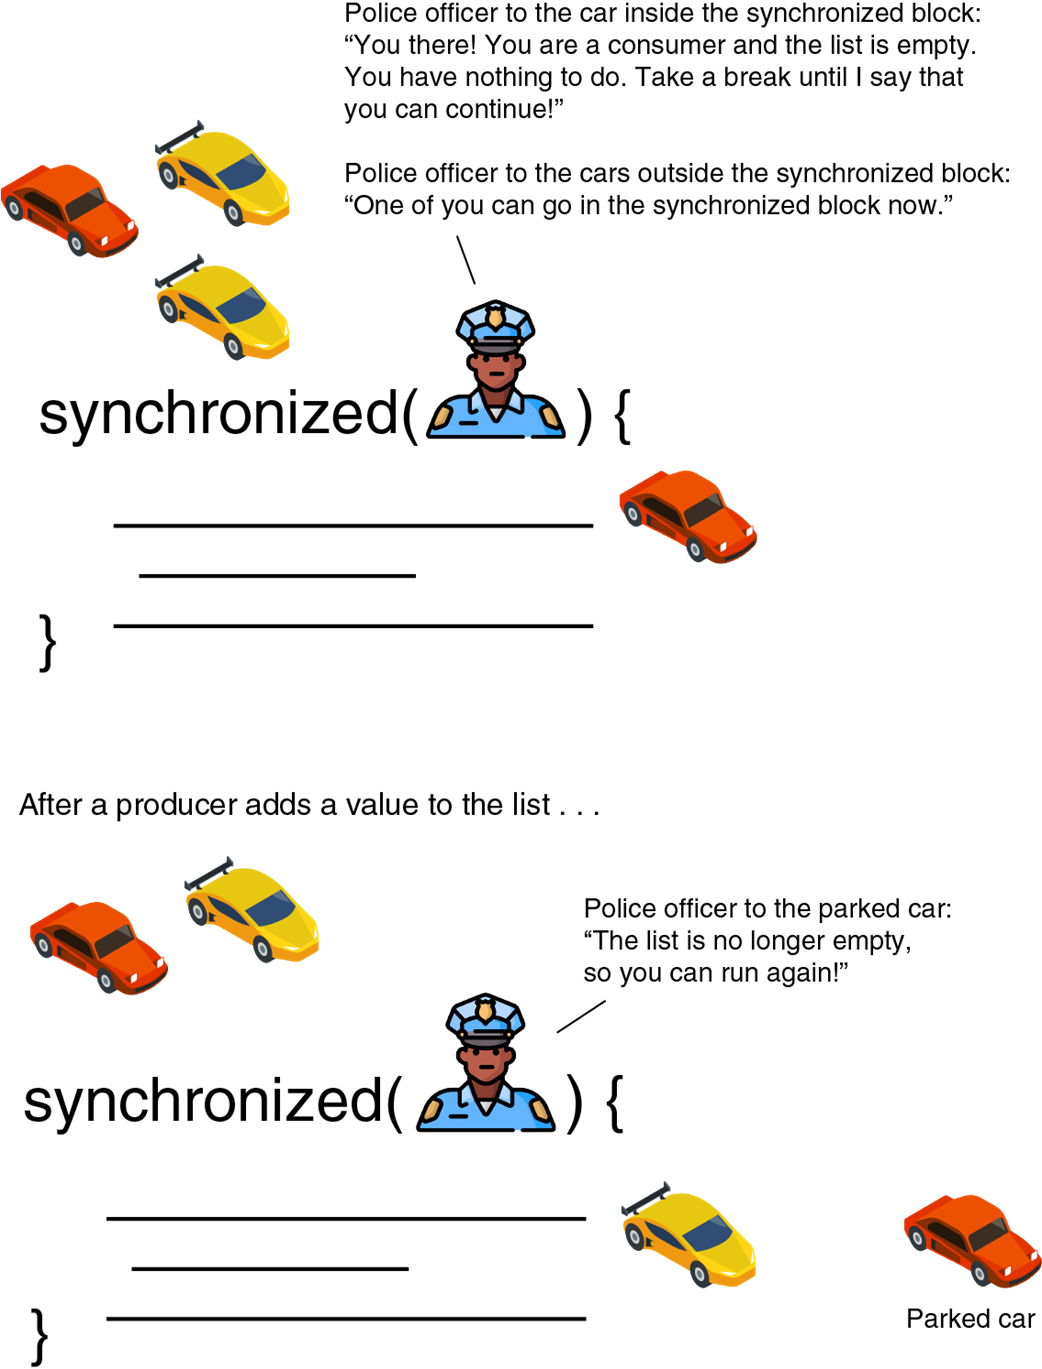
Some of the cars are consumer threads, and others are producer threads. The police officer orders a consumer to wait if the list doesn’t have values that can be consumed, allowing producers to work and add values. Once the list contains at least a value that can be consumed, the officer orders the waiting consumer to continue its execution.

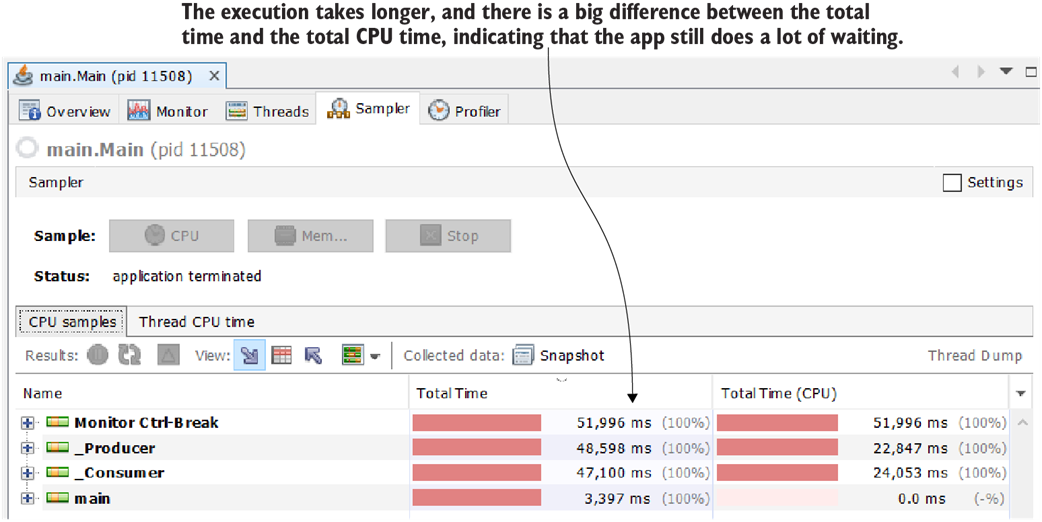
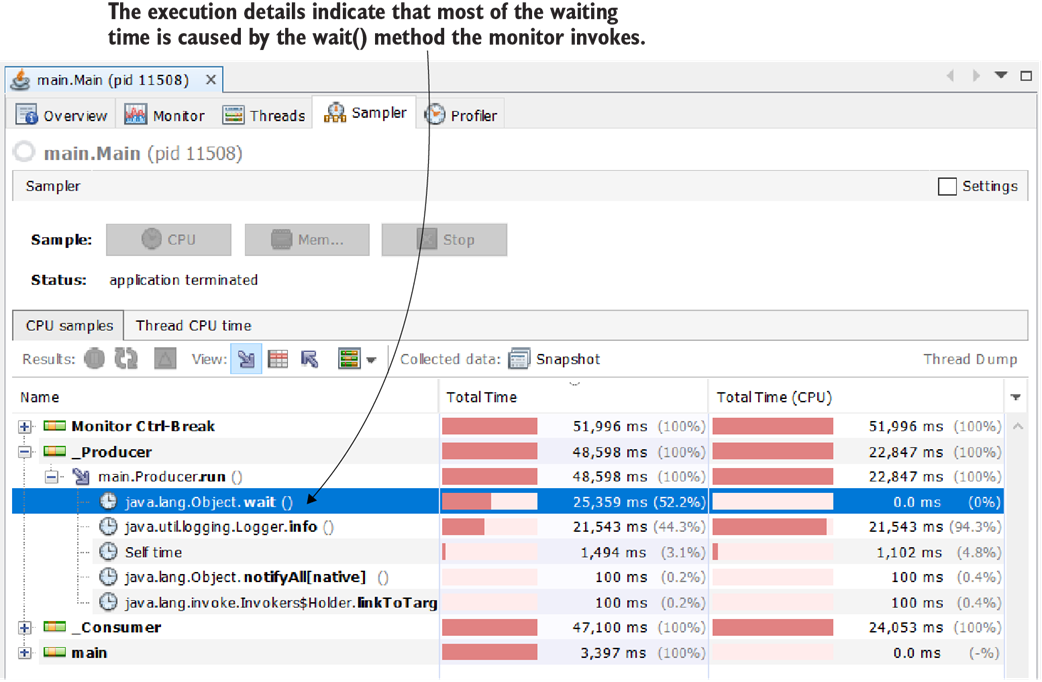
By sampling the execution, we see that the execution time is slower than before we made threads wait.
By analyzing the details, we can see that the self execution time is not that long, but the thread is blocked and thus waits for a longer time.
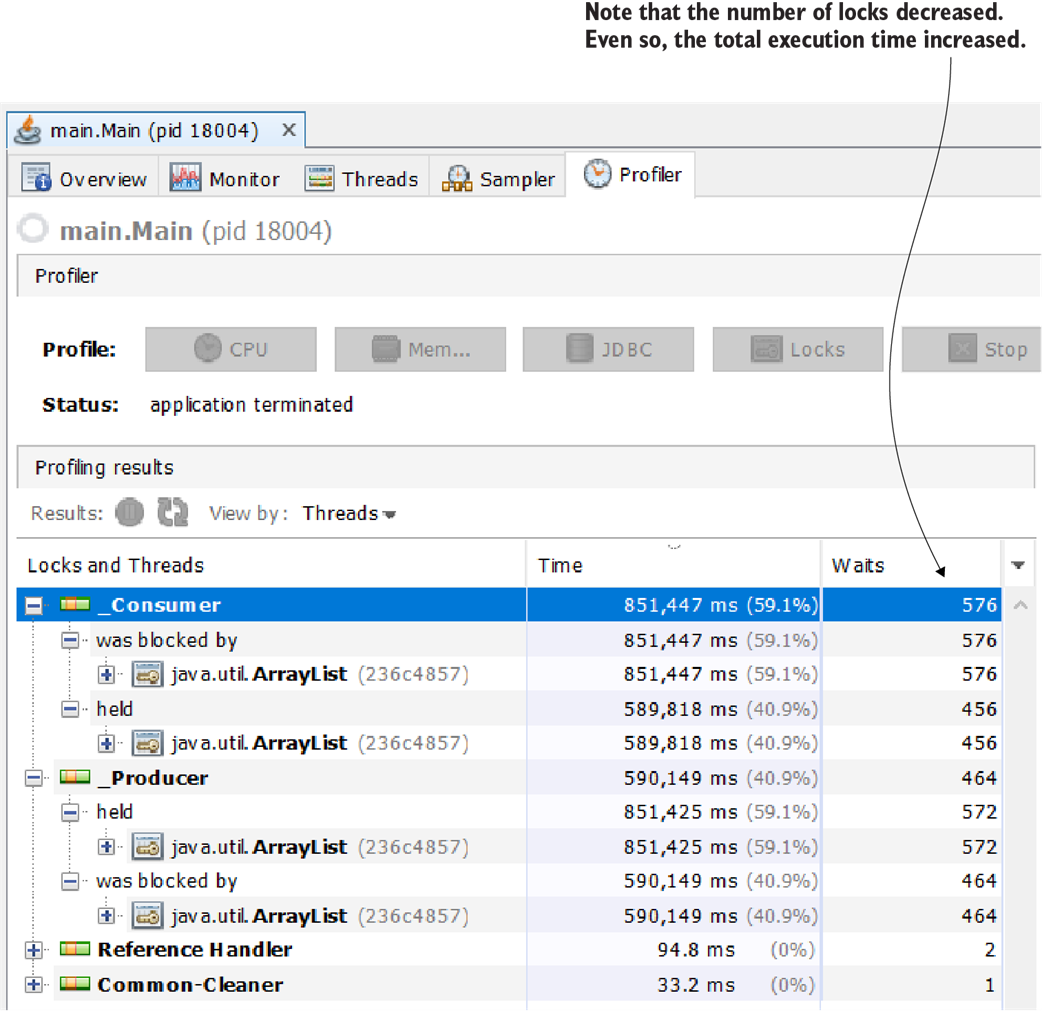
The lock pattern is similar to our previous results, but the threads are locked less frequently.
We get the same details using JProfiler. Fewer threads are locked, but now they are blocked for a much longer time.
Summary
- A thread can be locked and forced to wait by a synchronized block of code. Locks appear when threads are synchronized to avoid changing shared resources at the same time.
- Locks are needed to avoid race conditions, but sometimes apps use faulty thread synchronization approaches, which can lead to undesired results such as performance issues or even app freezes (in the case of deadlocks).
- Locks caused by synchronized code blocks slow down the app’s execution because they force threads to wait instead of letting them work. Locks may be needed in certain implementations, but it’s better to find ways to minimize the time an app’s threads are locked.
- We can use a profiler to identify when locks slow down an app, how many locks the app encounters during execution, and how much they slow down performance.
- When using a profiler, always sample the execution first to figure out if the app’s execution is affected by locks. You’ll usually identify locks when sampling by observing that a method is waiting on itself.
- If you find by sampling that locks may be affecting the app’s execution, you can continue investigating using lock profiling (instrumentation), which will show the threads affected, the number of locks, the monitors involved, and the relationship between locked threads and threads that cause the locks. These details help you decide if the app’s execution is optimal or if you can find ways to enhance it.
- Each app has a different purpose, so there’s no unique formula for understanding thread locks. In general, we want to minimize the time threads are locked or waiting and make sure threads are not unfairly excluded from execution (starving threads).
FAQ
What is a thread lock and why is it used?
A thread lock prevents multiple threads from accessing the same resource at the same time. It preserves data consistency and ordering but, if misused, can cause long waits, freezes, or deadlocks. Keep synchronized regions small and targeted to minimize contention.How can I tell from sampling that threads are waiting because of locking?
Look for total execution time being noticeably larger than total CPU time. In method-level samples, if a method’s self execution time greatly exceeds its CPU self time, it’s likely blocked by a monitor rather than waiting on an external operation.What’s the difference between a locked thread and a waiting thread?
- Locked: The thread is blocked at the entrance of a synchronized block until another thread releases the monitor.- Waiting: The thread was inside a synchronized block and called wait(), releasing the monitor and suspending until notify/notifyAll is called on the same monitor.
How do synchronized blocks and monitors work in the producer–consumer example?
Both threads synchronize on the same shared list object. Only one thread at a time can enter the synchronized block; the other blocks at the entry. Code outside synchronized (for example, the loop counter) can still run concurrently.How do I use VisualVM to investigate locks and interpret the results?
- Open the Profiler tab and start Locks profiling.- Review per-thread lock counts; expand a thread to see which monitor objects blocked it (class and identity) and which thread held the monitor.
- Use these relationships to map who blocks whom and how often.
Can JProfiler show the same lock information? What setup matters?
Yes. Attach JProfiler and set the JVM exit action to “Keep the VM Alive for Profiling.” Use Monitor History for event timelines (timestamps, durations, monitor identity, threads) and Monitor Usage Statistics to aggregate by threads or by monitors.How do I detect fairness issues or starvation risk in the results?
Compare per-thread CPU time and lock counts. In a balanced producer–consumer, both threads should be locked a similar number of times and have comparable active CPU time. Large disparities can signal unfairness or potential starvation.Why did adding wait/notify make the example slower?
The change reduced lock acquisitions but increased waiting time. With wait/notify, threads often spend longer blocked, and notifyAll can wake multiple threads unnecessarily. In the example, total runtime grew significantly despite fewer locks—measure before and after to validate any optimization.What workflow should I follow to investigate thread locks?
- Start with sampling to spot where time is spent and whether code is waiting vs executing CPU work.- Switch to instrumentation to collect detailed lock/wait data.
- Group events by thread or monitor, track monitor identities, and correlate blocking relationships.
How can I optimize an imbalanced producer–consumer workload?
- Reduce consumer lock frequency by batching removals.- Add more producers or adjust buffer size to match throughput.
- Minimize synchronized regions and avoid doing heavy work while holding a lock.
- Consider higher-level concurrency constructs (for example, BlockingQueue) instead of manual wait/notify.

 Troubleshooting Java, Second Edition ebook for free