12 Uncovering system-level failures and service communication issues
This chapter presents a pragmatic guide to diagnosing and fixing failures that emerge not from a single Java service, but from the interactions among many. It frames multi-service troubleshooting as a system problem, showing how seemingly unrelated symptoms—timeouts, retries, or slowdowns—can echo across APIs, queues, and background workers. The emphasis is on cultivating system-level visibility and thinking so that you can trace a request’s journey, connect symptoms to root causes, and stop localized glitches from turning into outages.
The discussion begins with service communication patterns—REST, gRPC, and messaging—highlighting their trade-offs and the subtle failure modes they introduce, from unclear contracts and weak typing to ordering, duplication, and delivery guarantees. It explains the foundations of distributed tracing—trace IDs, spans, and propagation—and how tools built on OpenTelemetry, together with backends like Jaeger or Zipkin, help reconstruct end-to-end request timelines. The chapter complements tracing with error monitoring (e.g., capturing exceptions and context), then dives into serialization and versioning pitfalls across JSON, Protobuf, and Avro, including how schema changes break consumers. It offers practical safeguards such as selective payload logging, redaction, CI-based schema compatibility checks, and schema registries to prevent silent data loss and deserialization errors.
Finally, it examines systemic failure modes that magnify small issues: cascading failures that exhaust thread pools, retry storms that overwhelm struggling services, timeout mismatches that create false failures, and misbehaving circuit breakers. You learn how to spot these patterns using thread dumps, structured logs, service metrics, and distributed traces, with particular attention to percentiles (P95/P99) for uncovering tail latencies. The guidance centers on correlating signals across tools, aligning client/server timeouts, applying backoff and jitter to retries, tuning pools and limits, and treating observability as core infrastructure. The closing message is clear: effective troubleshooting in distributed Java systems blends the right instrumentation with disciplined investigation to turn chaos into clarity.
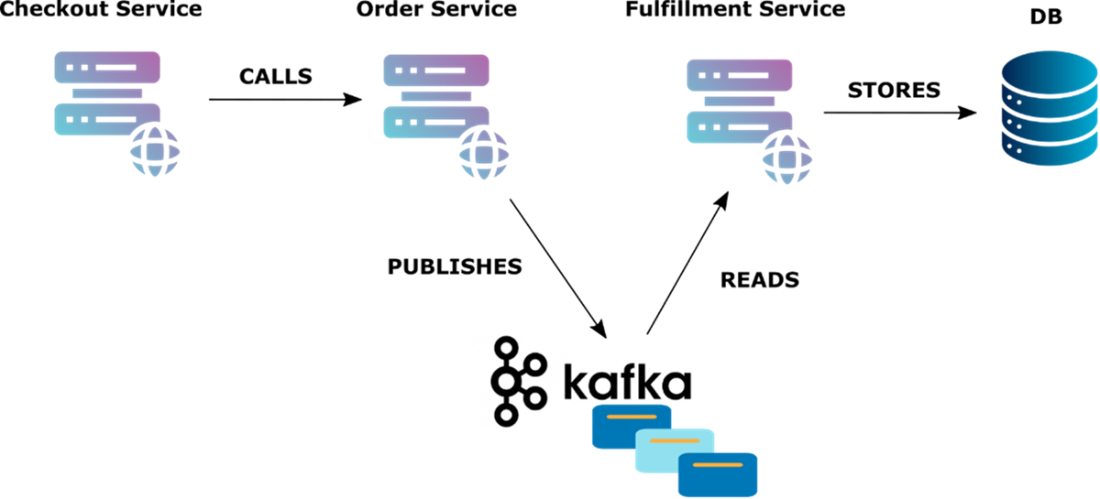
An overview of the system for our scenario. The checkout service calls the order service via REST while the order service asynchronously talks to the fulfillment service through a Kafka topic. The fulfillment service stores details in a database.
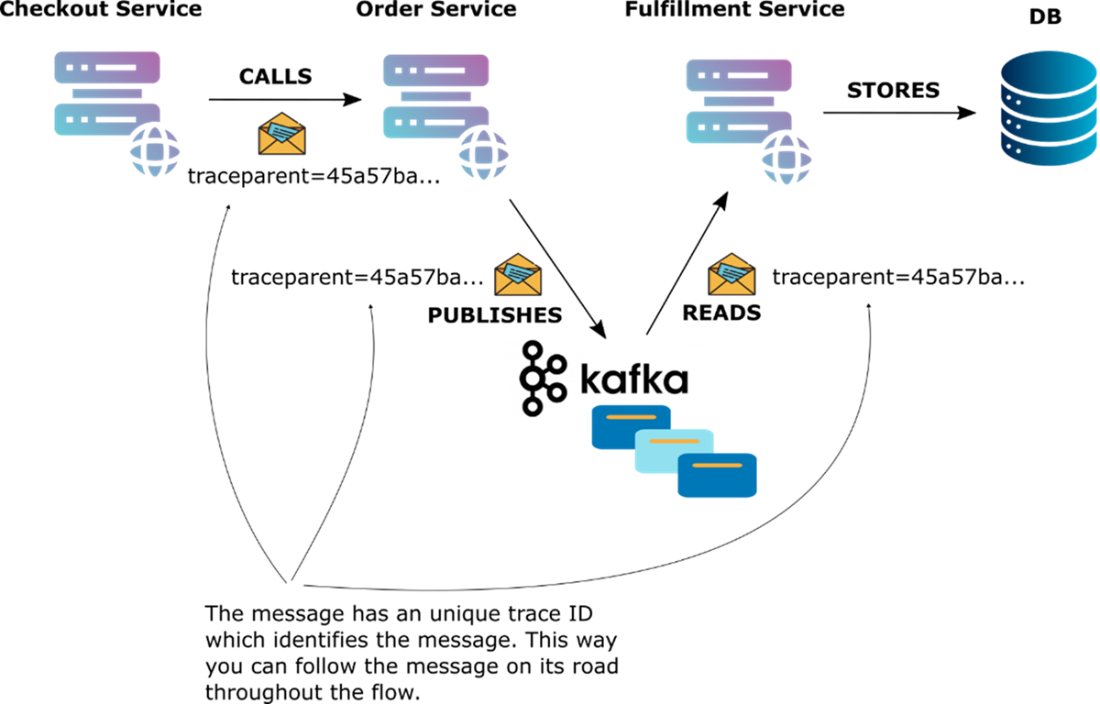
A trace ID identifies each message so you can follow it throughout its road between multiple services.
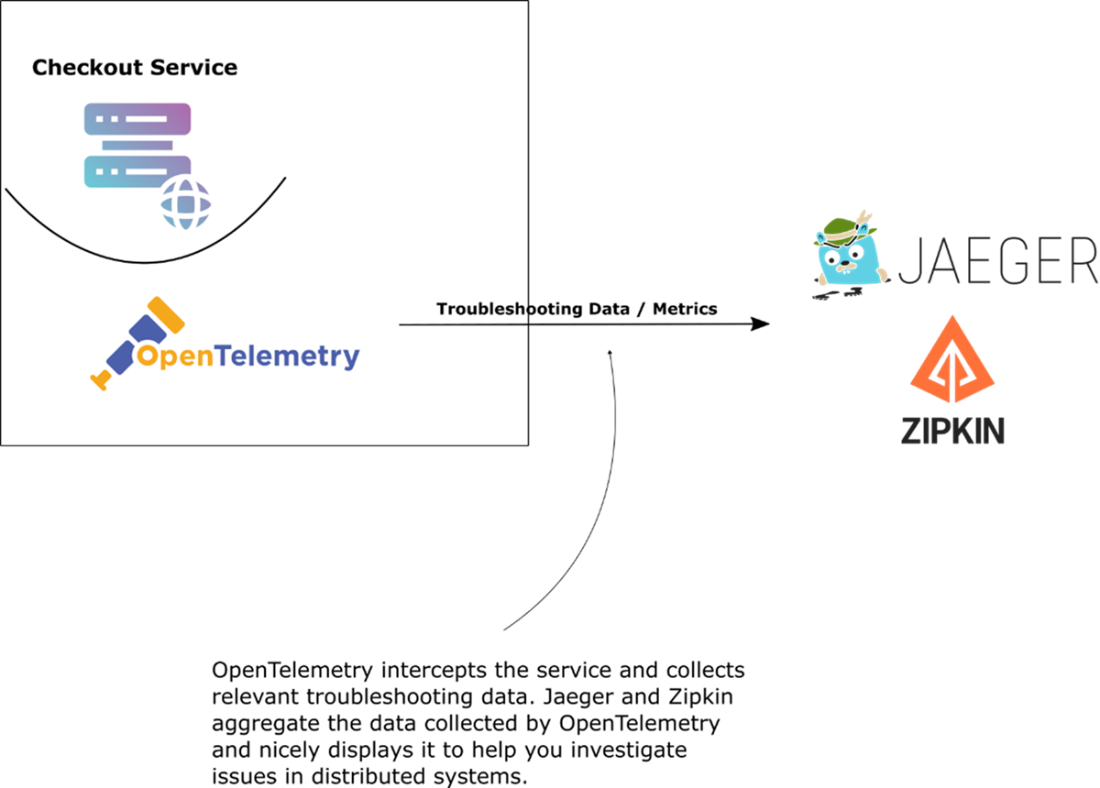
OpenTelemetry collects relevant data from the running service. Jaeger and Zipkin are tools that aggregate and display nicely this data to help you easily troubleshoot the system.
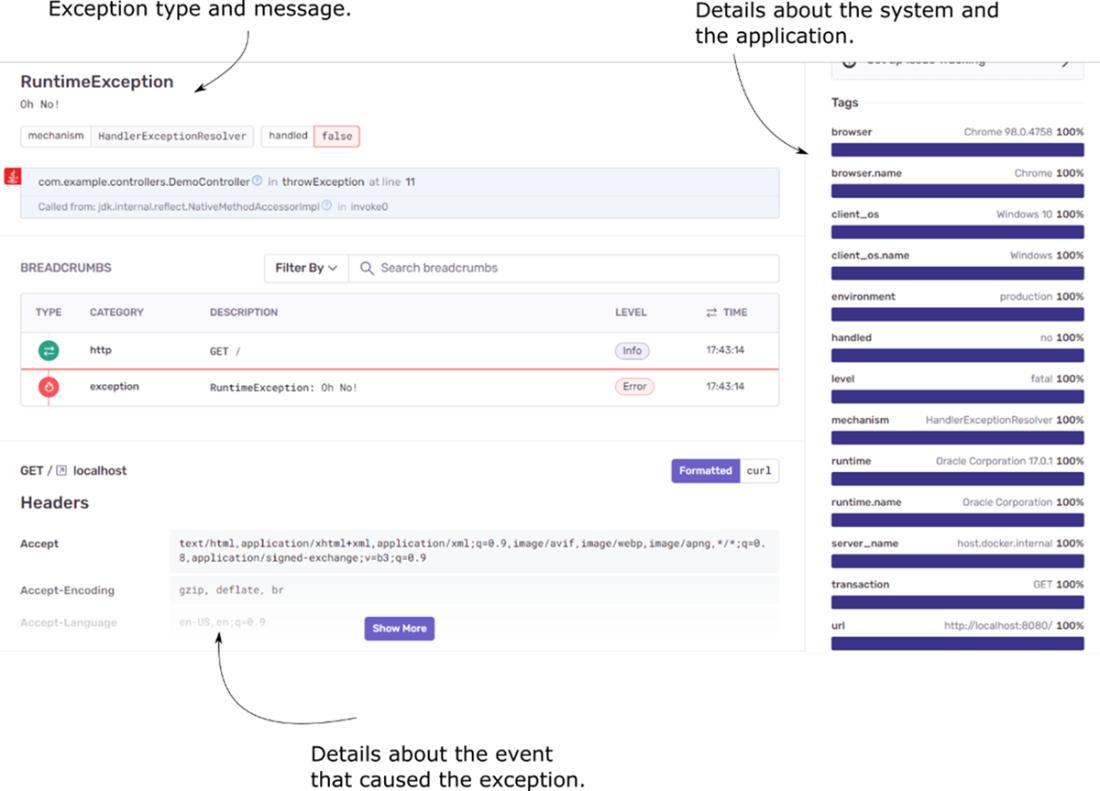
Sentry aggregates and shows events such as exceptions providing a large field of details for each of these.
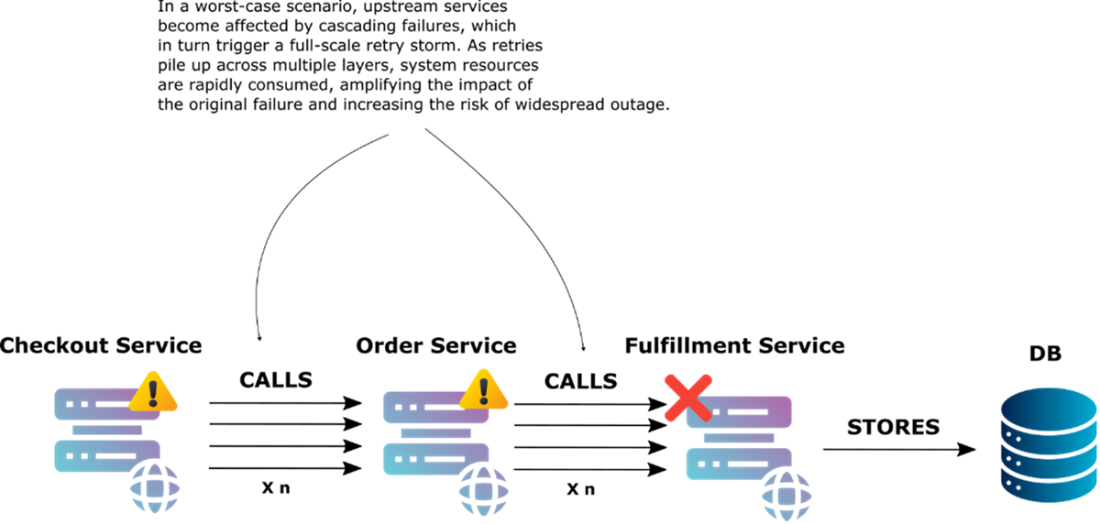
A failure or slowdown in one service (e.g., due to high latency, blocked resources, or an overloaded dependency) can propagate through the system. Upstream services that rely on it may begin to stall, exhaust thread pools, or trigger retries—eventually causing multiple services to degrade or fail, even if they were functioning correctly on their own.
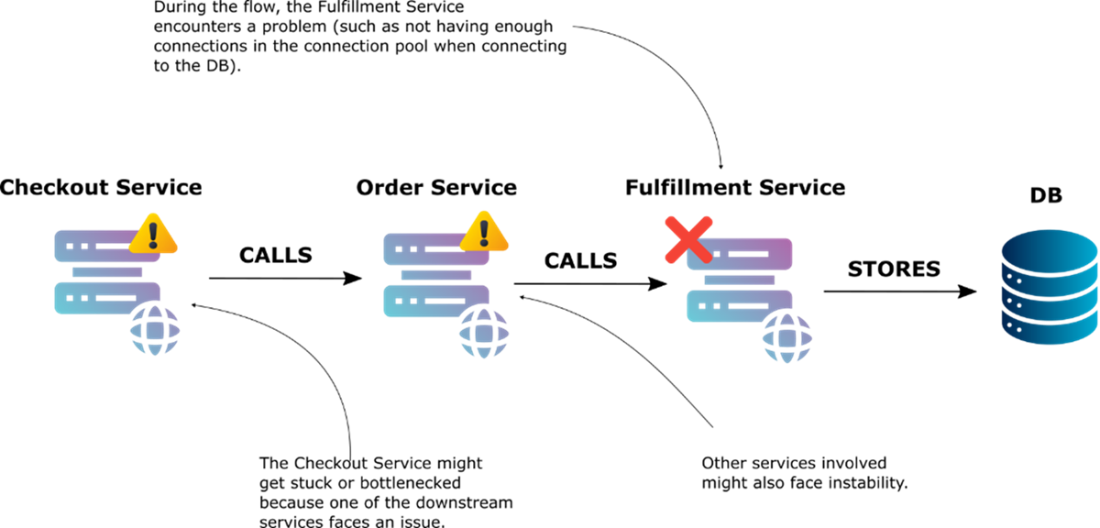
A retry storm. Due to a failing operation, an app uncontrollably retries the execution of an action, putting a larger part of the system in danger.
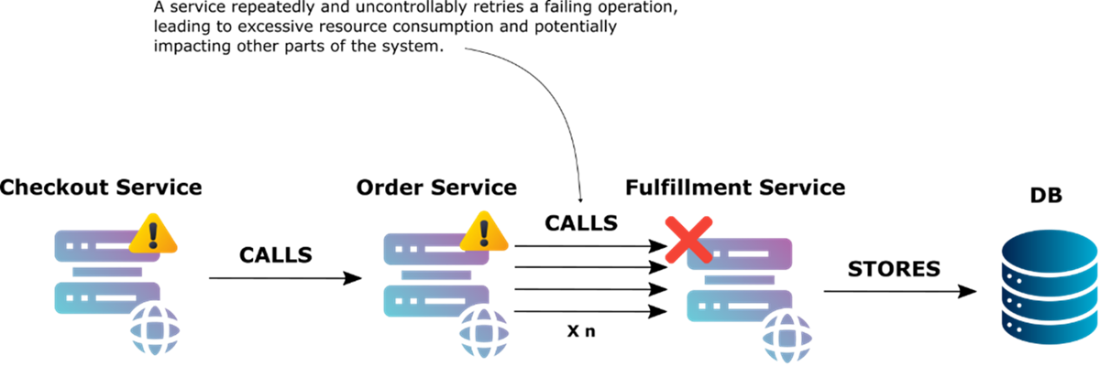
When a downstream service becomes unresponsive, upstream services may begin retrying requests excessively. This amplifies load across the system, consuming resources and potentially turning a localized failure into a widespread outage.
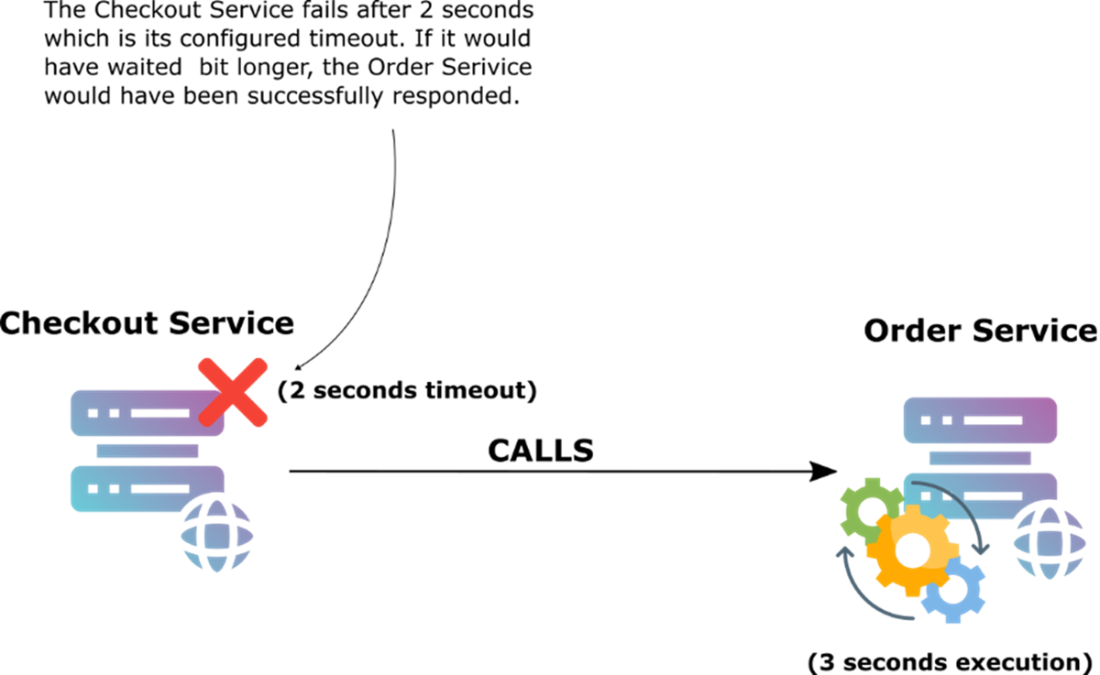
The Checkout Service aborts the request after 2 seconds due to its configured timeout, while the Order Service completes its task in 3 seconds. This mismatch results in a failed request, even though the downstream service performs correctly—highlighting the need for consistent timeout configuration across services.
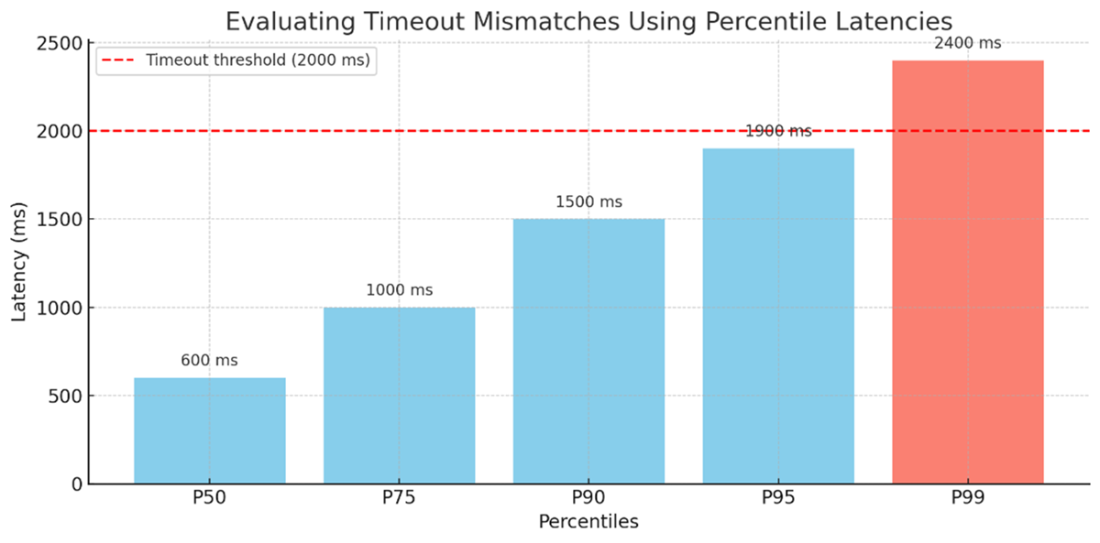
Identifying Timeout Mismatches Using Percentiles. P95 and P99 latencies approach or exceed the 2000 ms timeout threshold, revealing that some requests are likely to fail—despite the service working as expected.
Summary
- Distributed failures often don’t stay local—troubleshooting them requires system-level visibility and tools.
- Examine trace IDs and spans to reconstruct request paths, detect missing steps, and isolate problematic services in multi-hop flows. Use distributed tracing tools (like Jaeger or Zipkin) to follow a request across services and identify where time is lost or failures originate.
- In cases of serialization issues, log decoded payloads carefully, validate schemas in CI, and use tools like protoc, grpcurl, and jq to inspect data outside of the application.
- Detect cascading failures by analyzing thread dumps for repeating stack traces stuck on remote calls—often a sign of thread pool exhaustion.
- Identify retry storms by looking for repeating requests in logs, short retry spans in tracing tools, and sudden spikes in internal traffic without increased user load.
- Investigate timeout mismatches by comparing client and server span durations—if clients time out while servers keep processing, your configuration is misaligned.
- Watch for duplicate request IDs as a signal that clients are retrying unnecessarily due to mismatched expectations or timeouts.
- AI assistants can assist with analyzing logs, interpreting stack traces, spotting anomalies in traces, or offering context on unfamiliar errors, helping you troubleshoot faster and with more confidence.
FAQ
How do trace IDs and spans help troubleshoot multi-service issues?
- A trace ID uniquely tags a request as it travels across services (HTTP, gRPC, messaging). Every unit of work is recorded as a span.
- By propagating the same trace ID, you can reconstruct the end-to-end path in tools like Jaeger or Zipkin, see where time was spent, and pinpoint which hop failed.
- Look for missing spans to find broken links (e.g., a message published but never consumed). Compare parent/child spans to localize bottlenecks.
- Ensure headers/metadata are propagated consistently (e.g., W3C
traceparentor B3) across HTTP, gRPC metadata, and message payloads.
Which tooling should I deploy to enable distributed tracing in Java microservices?
- Instrumentation: OpenTelemetry Java SDK or Java Agent (auto-instruments Spring, HTTP clients, JDBC, gRPC, etc.).
- Exporter/collector: OTLP exporter, optionally OpenTelemetry Collector to fan out to multiple backends.
- Backend UI: Jaeger or Zipkin to store, query, and visualize traces.
- Correlation: Structured logging that includes the trace ID for pivoting between logs and traces.
- Optional: Sentry (errors), metrics stack (Prometheus/Grafana, or a commercial platform) for a full observability picture.
How do I follow a request that flows through REST, Kafka, and gRPC?
- Propagate the trace context end-to-end: inject/extract via HTTP headers, gRPC metadata, and include trace IDs in message headers/payloads for Kafka.
- Use Jaeger/Zipkin to verify spans for: inbound HTTP, publish to topic, consumer processing, and downstream calls.
- If a consumer span is missing, check the broker UI for lag/offsets and the consumer group status.
- Validate the consumer logs for deserialization or schema errors that can silently drop or park messages.
What common serialization/versioning pitfalls should I watch for, and how do I prevent them?
- Pitfalls: renamed or removed fields, type changes, new enum values (e.g.,
SHIPPING_METHOD_DRONE) unknown to consumers, incompatibleserialVersionUIDin Java serialization. - Prevention: design for backward/forward compatibility; add fields as optional; never reuse field numbers in Protobuf; avoid changing types.
- Automation: run compatibility checks in CI (Buf for Protobuf, avro-tools for Avro) against the main branch or a schema registry.
- Runtime: use a Schema Registry (e.g., Confluent) to validate messages on publish/consume.
How can I safely log payloads for debugging without leaking sensitive data or flooding logs?
- Prefer decoded, selective fields over full raw blobs; redact PII/secrets; cap size/truncate large fields.
- Sample only a small percentage in production; log more in dev/staging.
- Use structured logging (JSON) so you can query specific fields and always include the trace ID.
- Avoid dumping binary payloads (e.g., Protobuf) unless decoded and redacted.
How do I identify a cascading failure using thread dumps, metrics, and traces?
- Thread dumps: many threads in WAITING/TIMED_WAITING on HTTP/gRPC calls, connection pools, or I/O reads indicate upstream blockage.
- Metrics: thread pool utilization near 100%, request queues growing, outbound call latency/timeouts rising.
- Traces: fast upstream spans with most time spent in a slow downstream span.
- Act quickly: shed load, tighten/align timeouts, use bulkheads and circuit breakers; then fix the true downstream bottleneck (DB connections, CPU, third‑party API limits, etc.).
What is a retry storm, how do I spot it, and how do I stop it?
- Definition: many clients retrying the same failing operation concurrently, overwhelming the target and amplifying the outage.
- Signals: sudden load/CPU spike without real user traffic increase, repetitive “Retrying...” log lines, multiple short retry spans in traces, duplicate request IDs.
- Mitigations: exponential backoff with jitter, cap max retries, implement circuit breakers, rate limit/throttle upstreams, make operations idempotent, return proper status codes (e.g., 429/503 with Retry-After).
How do I detect and fix timeout mismatches between services?
- Detection: in traces the client span ends with a timeout at 2s while the server span runs ~3s and completes; client logs show timeouts but server logs show success.
- Validate configurations: client HTTP/gRPC deadlines, server/container timeouts, proxy timeouts.
- Guidelines: set coherent budgets—your service’s inbound timeout should exceed the sum of its downstream timeouts plus overhead; outbound timeouts should be less than your inbound budget to avoid overruns; tune using P95/P99, not averages.
- Watch for queue growth and duplicate request IDs—both hint that callers are giving up too soon.
How do Sentry and distributed tracing complement each other during incidents?
- Tracing answers “where and when” across services; Sentry answers “what failed” with full exception context, stack traces, environment, and release info.
- Correlate by including the trace ID in Sentry events and logs, so you can jump from an error group to the exact trace.
- Use tracing to find the failing hop, then Sentry to see the precise error (e.g., deserialization exception) and its frequency, users affected, and code location.
What’s a practical playbook when “orders disappear” in an event-driven pipeline?
- Confirm the symptom and grab a trace ID from the entry service logs.
- Open Jaeger/Zipkin: verify HTTP spans (checkout → order), publish span to the topic, and look for consumer spans.
- If consumer spans are missing, check the broker UI: is the message in the topic? consumer lag? group healthy?
- Inspect consumer logs for schema/enum/compatibility errors; validate schemas (CI tools or registry) and align versions.
- Fix the contract or consumer, redeploy, and reprocess affected messages (from DLQ or offsets) while monitoring traces, error rates, and lag.

 Troubleshooting Java, Second Edition ebook for free
