4 From evidence to decisions: Neyman, Pearson, and the principles of hypothesis testing
The chapter introduces the Neyman-Pearson approach as a way to turn statistical evidence into disciplined action. Building on earlier foundations from Bayes and Fisher, it emphasizes that inference alone cannot decide what to do; instead, a separate decision framework is needed to balance the risks of false positives and false negatives. Neyman and Pearson supplied that framework by requiring hypotheses, error rates, and decision rules to be fixed in advance, making statistical conclusions transparent, reproducible, and tied to explicit control of error.
The core of the chapter is a seven-step hypothesis-testing process: state the null and alternative hypotheses, choose a significance level, select an appropriate test, compute the test statistic, establish the decision rule, make a binary decision, and then draw a contextual conclusion. The chapter shows that each choice depends on the problem at hand, the data type, and the consequences of being wrong. It also explains how significance levels, Type I and Type II errors, critical regions, p-values, and test power fit together, and why changing the rules after seeing the data undermines the validity of the test.
Through examples in manufacturing, aviation safety, and a small clinical trial, the chapter demonstrates that the same framework applies across very different settings even when the specific test changes. A quality-control example leads to rejection of the null, a safety-monitoring example prompts precautionary inspection, and a borderline medical trial result shows that failing to reject the null is not proof that it is true. The chapter closes by stressing the enduring importance of the Neyman-Pearson framework: it is not just a set of statistics procedures, but a general method for making sound decisions under uncertainty across science, engineering, business, and modern data science.
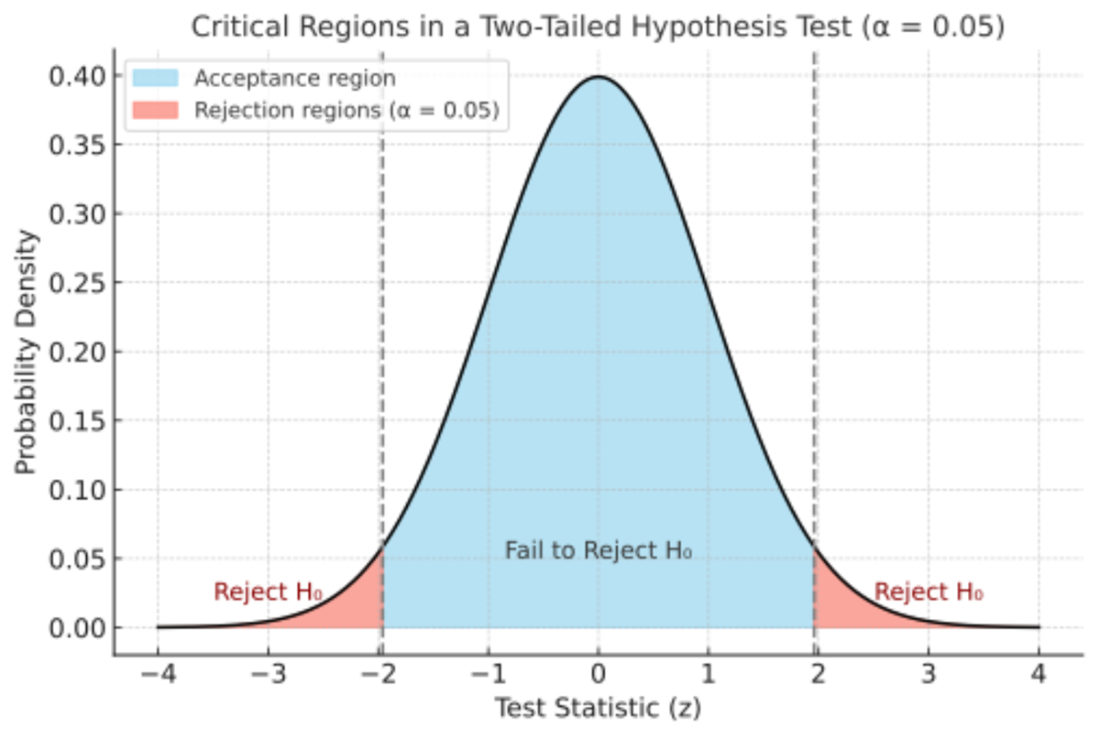
Illustration of critical regions in a two-tailed hypothesis test at the 5% significance level. The curve represents the distribution of the test statistic under the null hypothesis. In a two-tailed test, the rejection regions are placed symmetrically in both extremes of the distribution, with 2.5% in each tail, so that results unusually far from the center in either direction would lead to rejecting the null. By contrast, a one-tailed test would place the entire 5% rejection region on only one side of the distribution, used when deviations are meaningful only in a single direction. This figure provides one example of how critical regions formalize the decision rule in hypothesis testing.
Summary
- Neyman and Pearson transformed hypothesis testing from a collection of statistical techniques into a formal framework for decision-making under uncertainty. By introducing a disciplined, stepwise procedure that explicitly balanced the risks of error, they advanced statistical inference beyond simply measuring evidence to determining when that evidence is sufficient to justify a statistical conclusion and a course of action.
- Although Neyman and Pearson presented their ideas as a mathematical framework rather than a seven-step procedure, their methodology follows a disciplined sequence of interdependent steps and decisions. Organizing the framework into sequential steps highlights that each step builds upon the one before it, thereby creating a systematic, transparent, and reproducible process for transforming statistical evidence into objective decisions.
- The seven-step procedure naturally divides into three phases: designing the hypothesis test before the data is analyzed, evaluating the evidence according to the pre-specified design, and interpreting the results to reach a statistical conclusion and an informed decision. This structure reinforces that each step depends on those before it, ensuring that the framework remains disciplined, transparent, and resistant to subjective interpretation.
- At the heart of the Neyman–Pearson framework is the explicit management of uncertainty. Rather than attempting to eliminate uncertainty, the framework acknowledges that every statistical decision carries the possibility of error. By controlling Type I and Type II errors and specifying acceptable risk before the data is analyzed, it provides a rational basis for balancing competing consequences and making disciplined decisions when certainty is unattainable.
- Objectivity and reproducibility are defining strengths of the Neyman–Pearson framework. Because statistical conclusions are governed by explicit decision rules rather than individual judgment, different researchers applying the same framework to the same data should reach the same conclusion. This emphasis on transparency has become even more important in the era of modern data science, where analytical flexibility can otherwise lead to post hoc reasoning, p-hacking, and results that fail to replicate.
- Although the Neyman–Pearson framework requires disciplined, sequential execution, its underlying principles are remarkably durable. The same process applies across scientific disciplines, research questions, and statistical methods, regardless of whether the objective is scientific discovery, quality control, safety monitoring, or predictive modeling. Individual statistical tests may differ, but the framework that governs their application remains unchanged, providing a universal methodology for transforming statistical evidence into disciplined decisions under uncertainty.
- The enduring legacy of the Neyman–Pearson framework lies in the fact that it is not tied to any particular statistical method or application. New statistical methods, machine learning algorithms, and AI systems will continue to be developed, but the fundamental challenge of determining when evidence is sufficiently strong to justify a statistical conclusion and, ultimately, a course of action remains unchanged. For nearly a century, the Neyman–Pearson framework has provided a timeless foundation for disciplined decision-making under uncertainty, and its principles remain as relevant today as when they were first introduced.
FAQ
What problem did Neyman and Pearson’s hypothesis testing framework solve?
It solved the problem of turning statistical evidence into a disciplined decision under uncertainty. Rather than just estimating or measuring evidence, the framework specifies in advance how to decide whether to reject a null hypothesis while controlling error rates.
What are the null hypothesis and the alternative hypothesis?
The null hypothesis (H0) is the reference statement, often representing no effect, no change, or the status quo. The alternative hypothesis (H1) represents a meaningful departure from that baseline and is the claim supported if the null is rejected.
Why must the hypotheses be stated before looking at the data?
They must be fixed in advance so the rules of the test are not adjusted after the results are known. Changing hypotheses after seeing the data can bias the conclusion and undermine the objectivity of the inference.
What is the significance level, and why is it important?
The significance level, α, is the maximum acceptable probability of a Type I error, meaning rejecting a true null hypothesis. It matters because it sets the standard for how strong the evidence must be before the null is rejected.
What is the difference between a Type I error and a Type II error?
A Type I error is a false positive: rejecting a null hypothesis that is actually true. A Type II error is a false negative: failing to reject a false null hypothesis. Choosing α involves balancing the risks of these two errors.
How do you choose the right statistical test in the Neyman-Pearson framework?
You choose the test based on the research question, the type of data, and the assumptions the test requires. For example, comparing means, proportions, relationships, or distributions generally calls for different procedures such as t-tests, chi-square tests, correlation, regression, or ANOVA.
What does the test statistic do?
The test statistic summarizes the observed data in a single numerical value that can be compared against what would be expected under the null hypothesis. It converts the sample information into a standardized measure of evidence.
What is the critical region, and how is it related to the p-value?
The critical region is the range of test statistic values that would lead to rejecting the null hypothesis. The p-value is another way of expressing the same decision rule: if the p-value is less than or equal to α, the result falls in the rejection region.
Does failing to reject the null hypothesis mean the null is true?
No. Failing to reject the null means only that the data did not provide sufficient evidence against it under the chosen testing procedure. The null may still be false, especially if the sample is small or the test has low power.
Why is the Neyman-Pearson framework still important today?
It remains important because many fields still need a transparent, reproducible way to make decisions from uncertain evidence. Its logic is used in science, engineering, clinical trials, quality control, business analytics, and modern data science whenever evidence must be translated into action.

 Timeless Algorithms, The Foundational Ideas ebook for free
