5 Fitting a logistic regression
This chapter presents logistic regression as a practical, supervised approach for predicting binary outcomes. It explains how a linear combination of predictors is transformed by the sigmoid function into probabilities between 0 and 1, which are then thresholded (commonly at 0.5) to yield class labels. The discussion highlights how coefficients quantify effects on the log-odds of the outcome, contrasts logistic and linear regression, and sets the stage for a complete workflow: data exploration, model fitting, interpretation, and performance evaluation using standard classification metrics.
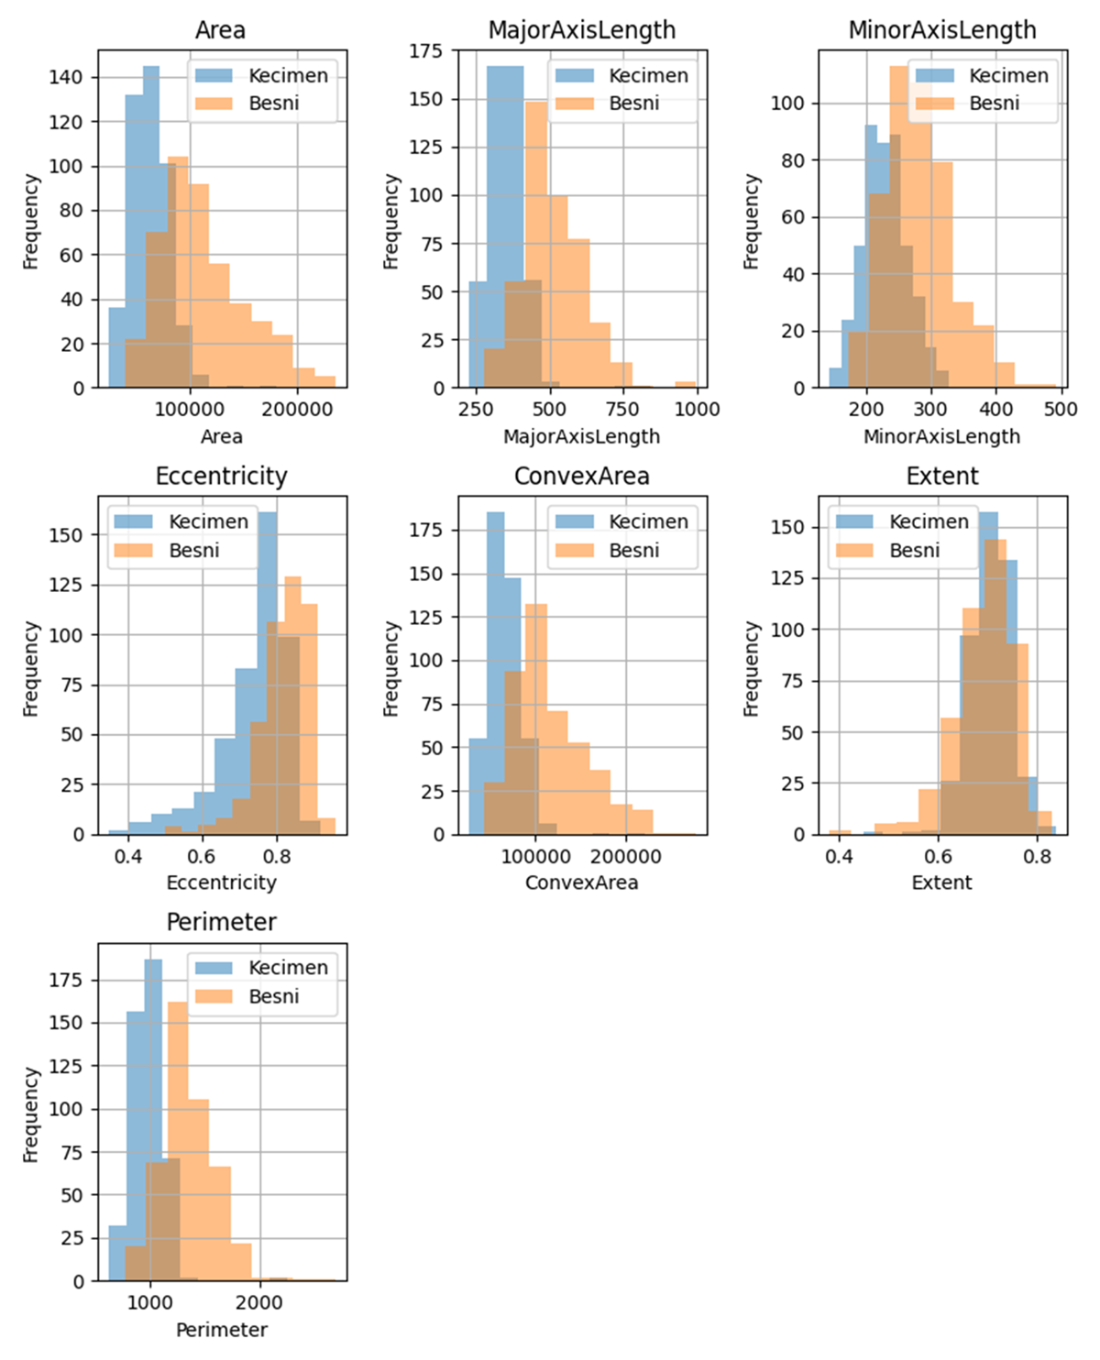
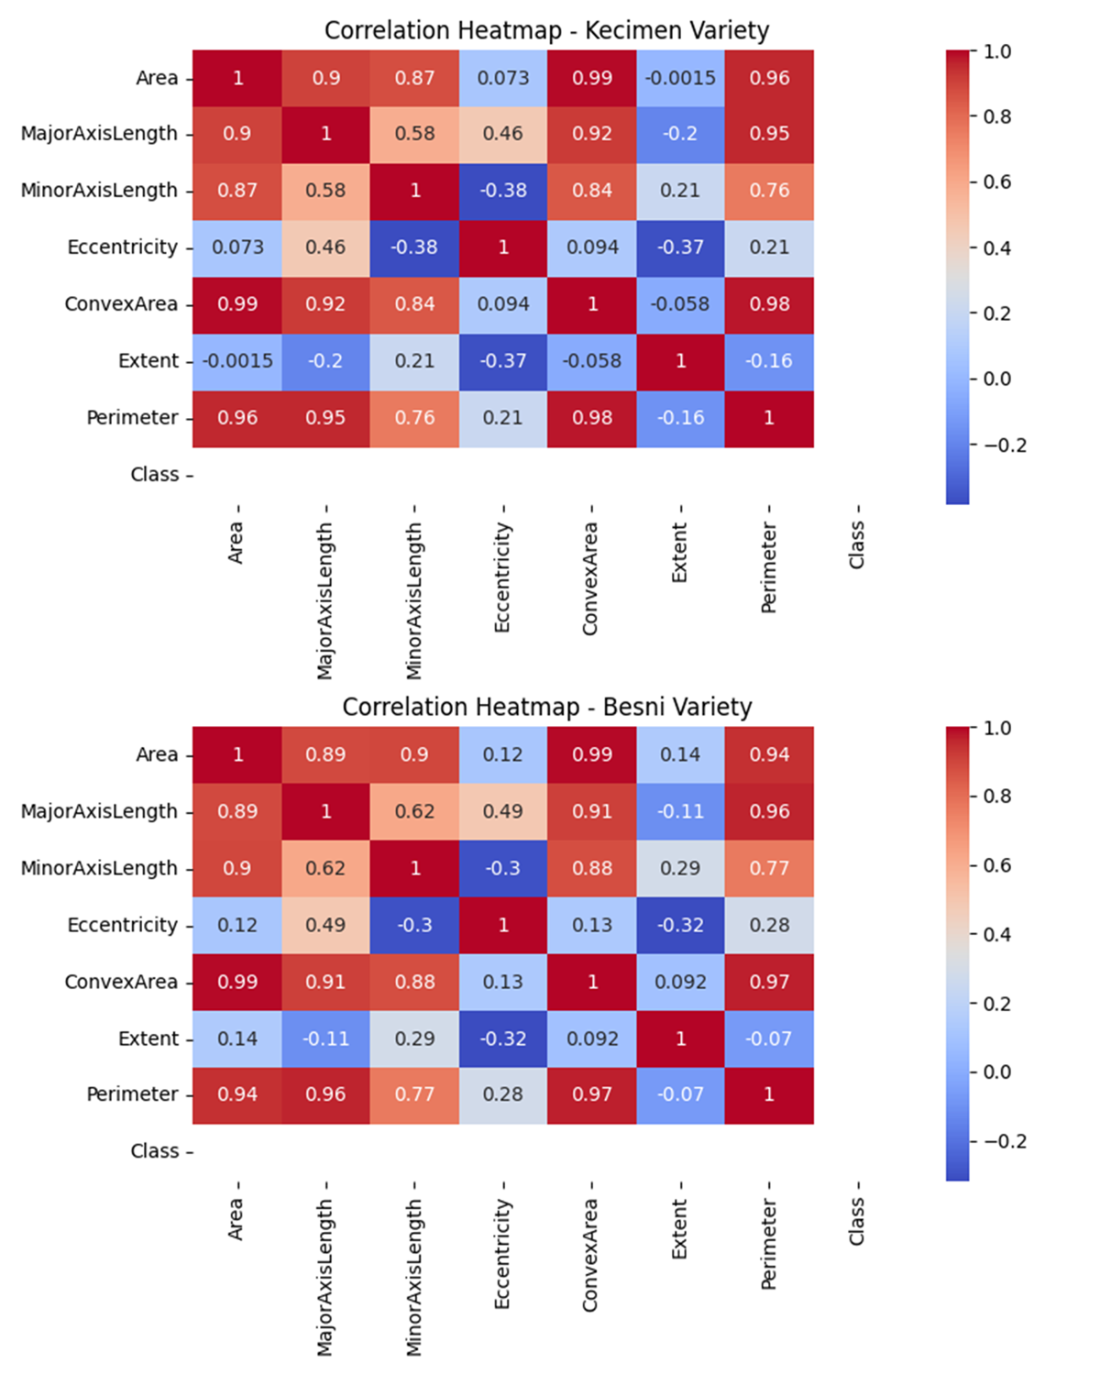
To ground the ideas, the chapter analyzes a raisin dataset with morphological features and a binary class indicating variety. After importing and cleaning the data (including mapping class labels to 0/1), the authors perform exploratory analysis: class-wise descriptive statistics, paired histograms to assess class separation, and correlation heat maps to probe relationships among predictors. Strong correlations motivate a multicollinearity check via Variance Inflation Factors (VIFs), revealing several problematic predictors. A full multiple logistic model identifies some insignificant variables, and a reduced model focusing on MinorAxisLength and Perimeter is fit to mitigate collinearity while preserving predictive signal.
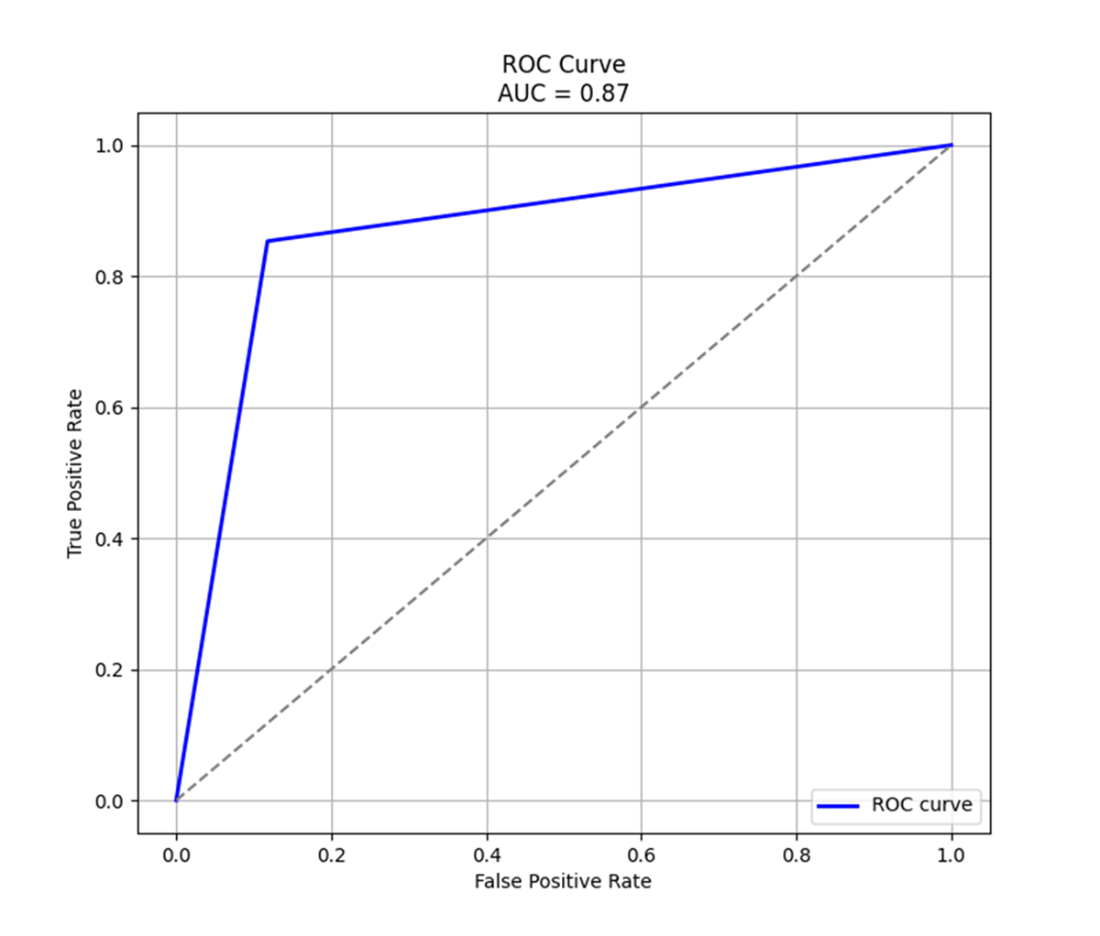
The reduced model shows strong statistical significance (LLR p-value ≈ 0) and good fit (McFadden’s pseudo R² ≈ 0.50). The chapter demonstrates turning fitted coefficients into probabilities and then class predictions, builds a confusion matrix, and computes key metrics: sensitivity ≈ 85.3%, specificity ≈ 88.2%, false positive rate ≈ 11.8%, false negative rate ≈ 14.7%, and accuracy ≈ 86.8%. The area under the ROC curve is ≈ 0.868, consistent with the accuracy and indicating solid discrimination. The end-to-end example illustrates best practices—thorough EDA, handling multicollinearity, careful model interpretation, and robust evaluation—applicable to a wide range of binary classification problems.
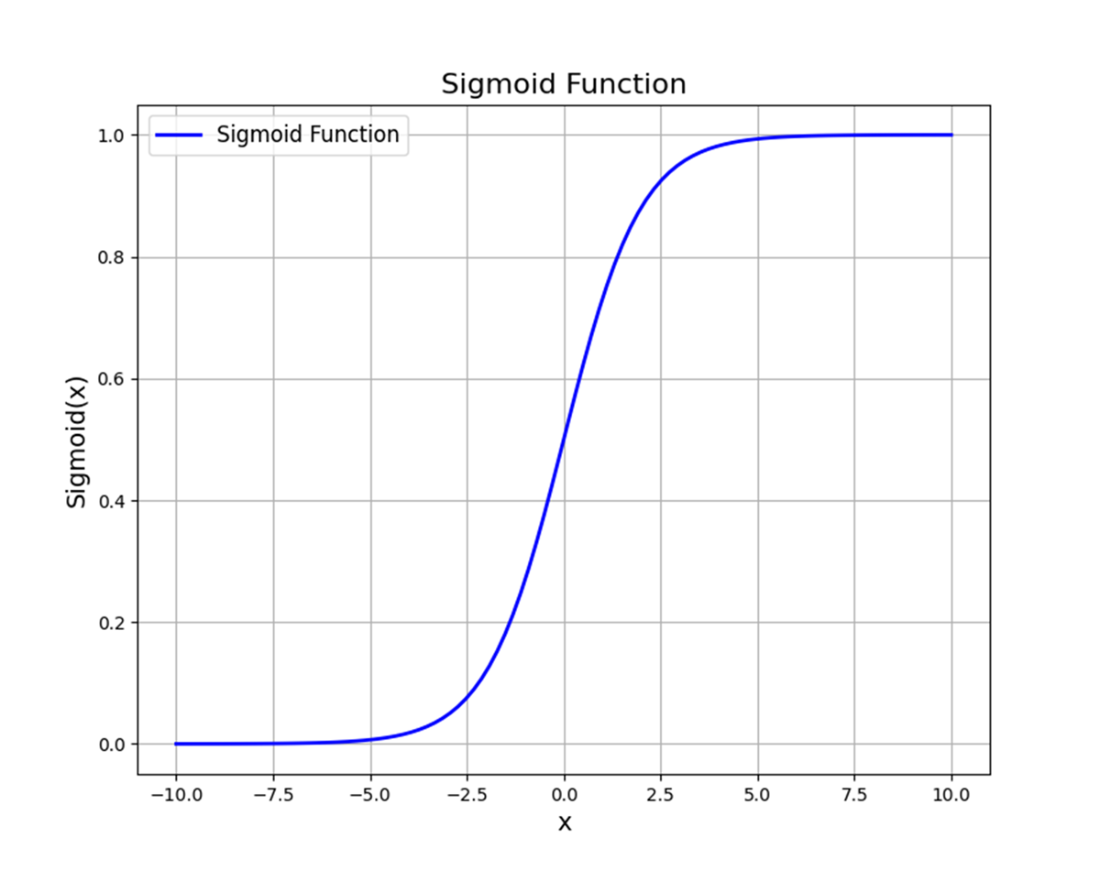
A graphical illustration of the sigmoid function. The sigmoid function is characterized by its S-shaped curve, compared to a linear function which is characterized by a straight line.
A grid of histograms that displays the data distributions of each numeric variable in the raisins data frame further segmented by the binary variable Class.
A pair of correlation heat maps, one for each variety of raisin.
A Receiver Operating Characteristic, or ROC, curve. The false positive rate is plotted along the x-axis and the true positive rate is plotted along the y-axis. When the curve, represented by the solid line, hugs the upper-left quadrant of the plot, as it does here, it thereby increases the area under it. The dashed line represents an AUC equal to 0.5, or otherwise the equivalent of random guessing.
Summary
- Logistic regression is a statistical method used to model the relationship between a binary outcome variable and one or more predictors. Unlike linear regression, which predicts continuous outcomes, logistic regression predicts the probability that an observation belongs to one class versus the other. Logistic regression applies the logistic function, or sigmoid function, to transform the linear combination of predictors into probabilities, which are then used to make binary predictions. Logistic regression models are regularly fit in many fields, including medicine, finance, marketing, and the social sciences.
- Goodness of fit should be evaluated from at least a trio of measures: McFadden’s pseudo R2, which represents a model’s ability to explain variation in the binary dependent variable above and beyond a null model that contains just an intercept term; the LLR p-value, which measures a model’s statistical significance; and the p-values for the individual predictors, which indicate whether or not the relationship between a predictor and the binary outcome variable is statistically significant.
- Classification metrics—true and false positive rates, true and false negative rates, accuracy and misclassification rates, and the area under the receiver operating characteristic curve—are essential for evaluating the performance of a logistic regression and its ability to accurately predict binary outcomes. By analyzing these metrics, you can draw conclusions around a model’s strengths and weaknesses, identify opportunities for improvement, and make informed decisions about model optimization and deployment.
- Data exploration, which typically involves a mix of computing basic statistics and creating graphical displays of the data, should scale with the length and width of the data set. The value proposition of data exploration, when done correctly and thoroughly, lies in its ability to identify patterns, outliers, and potential issues with the data that could drive variable selection and other model development decisions.

 Statistics Every Programmer Needs ebook for free
