14 Visualizing quality control
This chapter explains how visual analytics strengthen statistical quality control. It begins by framing quality as consistently meeting or exceeding customer expectations, then links that goal to preventive and detective controls that reduce variation and defects. The narrative emphasizes data-driven monitoring—center lines, upper and lower control limits, standard deviation, range, z-scores, and capability indices (Cp, Cpk)—and shows how visualization clarifies common versus special-cause variation, enabling quick, shared interpretation and supporting a culture of continuous improvement. Control limits are typically set at ±3σ but can be tightened or relaxed depending on process risk and tolerance.
For attribute data, the chapter surveys the main charts and when to use them: p-charts for the proportion defective (especially with varying sample sizes), np-charts for counts of defectives with constant sample sizes, c- and u-charts for counts of defects (with u normalizing by opportunity when sample sizes vary), and g-charts for units between rare events. It details how center lines and control limits are derived for proportions and counts, how sample size affects sensitivity, and how to read signals beyond simple limit violations (runs, trends, clustering). Practical guidance includes selecting the right chart for the data type and sampling plan, tuning limits for earlier detection when warranted, and visually flagging out-of-control points to accelerate root-cause investigation.
For variable data, the chapter covers x-bar charts for process means, r- and s-charts for dispersion, Individuals–Moving Range (I–MR) charts when data aren’t subgrouped, and EWMA charts to detect small, gradual shifts via weighted averages controlled by a smoothing parameter. It illustrates how pairing charts (e.g., x-bar with r or s) distinguishes mean shifts from variability changes, why moving range and constants (D3, D4) matter, and how EWMA narrows limits to heighten sensitivity to recent changes. A recurring insight is that variability can be stable while the mean drifts, so cross-chart interpretation is essential. The chapter closes by reinforcing that integrating sound statistical measures with clear visuals enables timely action, sustained control, and elevated quality performance.
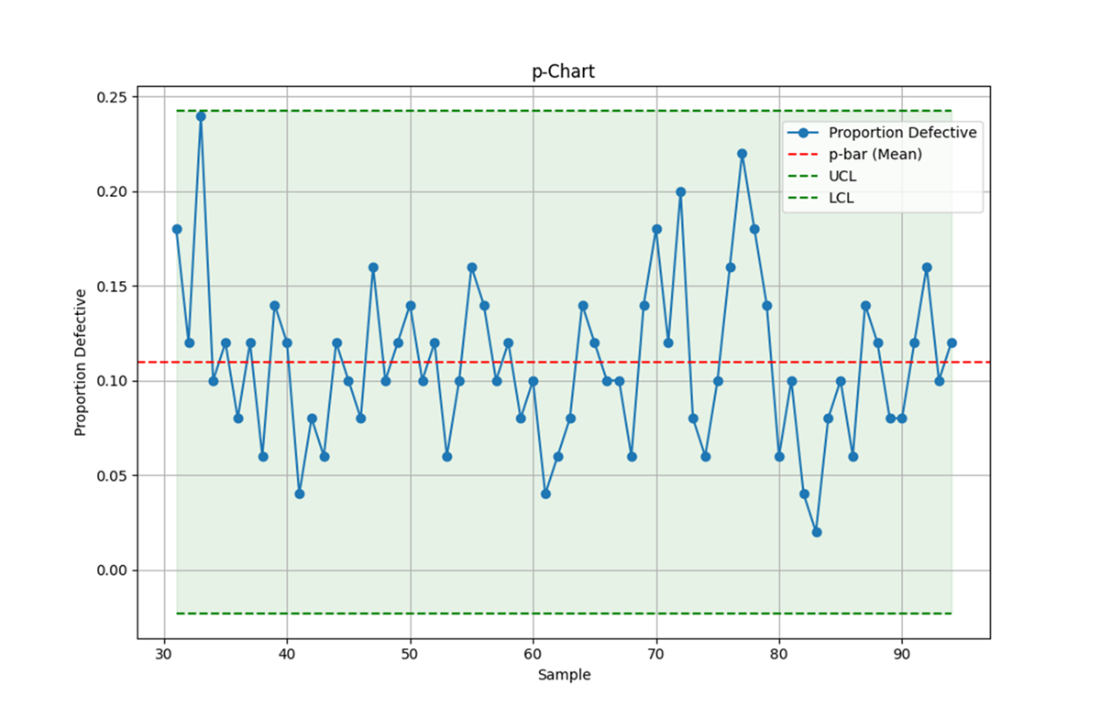
This p-chart illustrates the proportion of defective units in each sample of orange juice cans, with the red dashed line representing the mean proportion. The green dashed lines indicate the Upper Control Limit and Lower Control Limit, providing boundaries for expected variation in the process. Data points within these limits suggest that the process is in control, while any points outside these limits would signal potential issues requiring investigation.
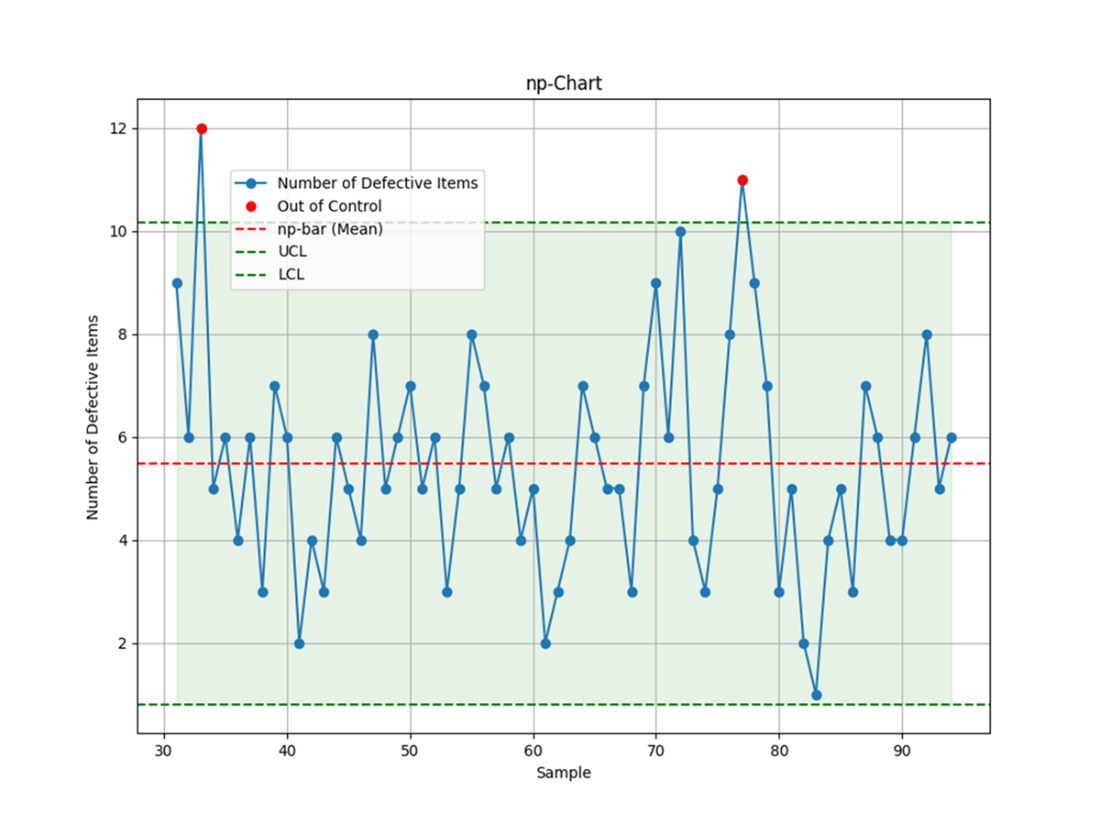
This np-chart displays the number of defective units in each sample of orange juice cans, including a pair of data points above the UCL. This type of chart is a better option than a p-chart when the sample sizes are consistent.
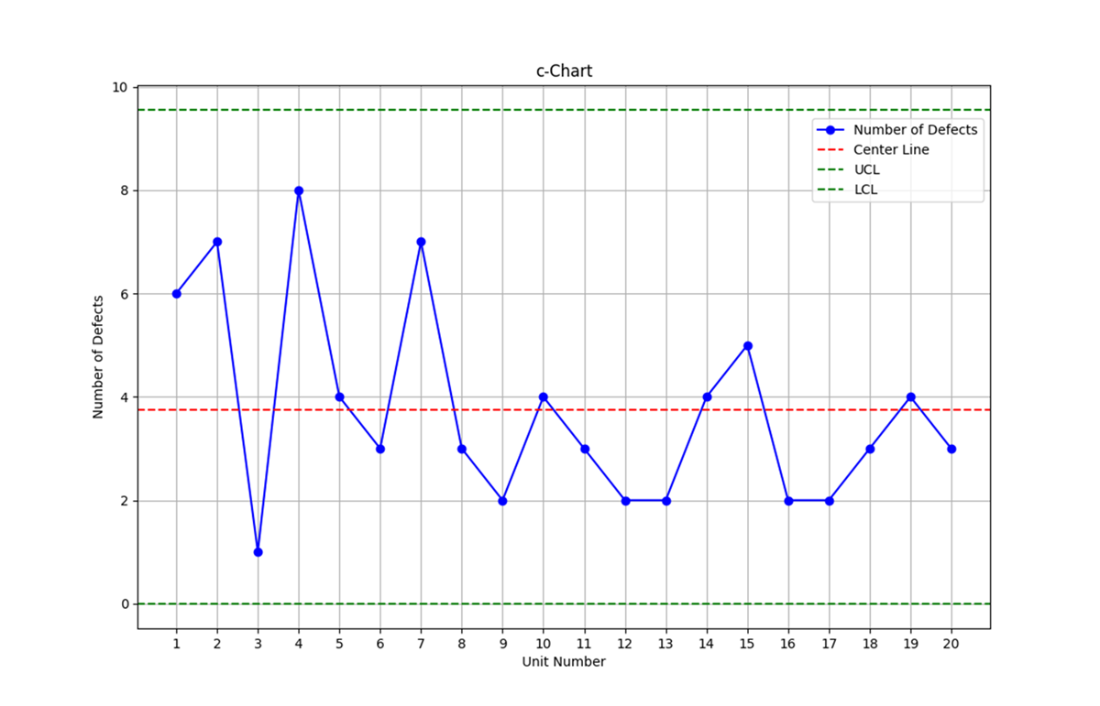
This c-chart displays the number of defects per unit for 20 units. All data points fall within the control limits, indicating a stable process.
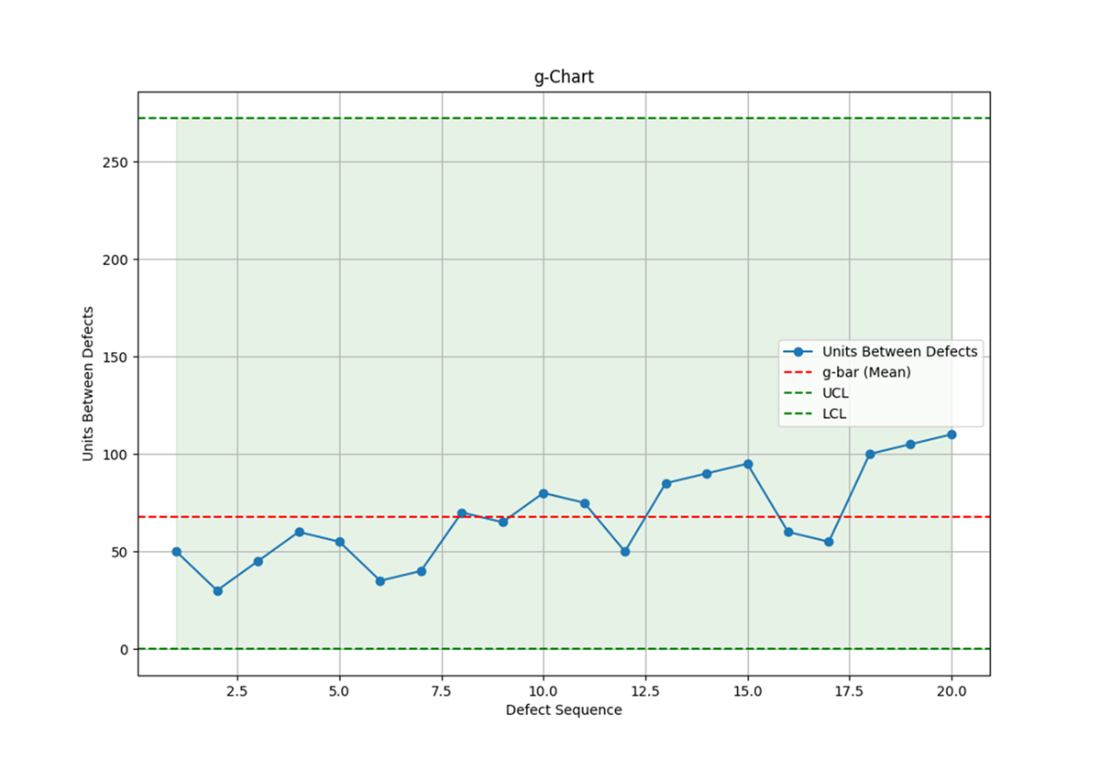
This g-chart displays the number of units between defects; it otherwise highlights process stability with all points falling within the control limits. Additionally, it shows an improving process, as the number of manufactured units between defects is trending upward.
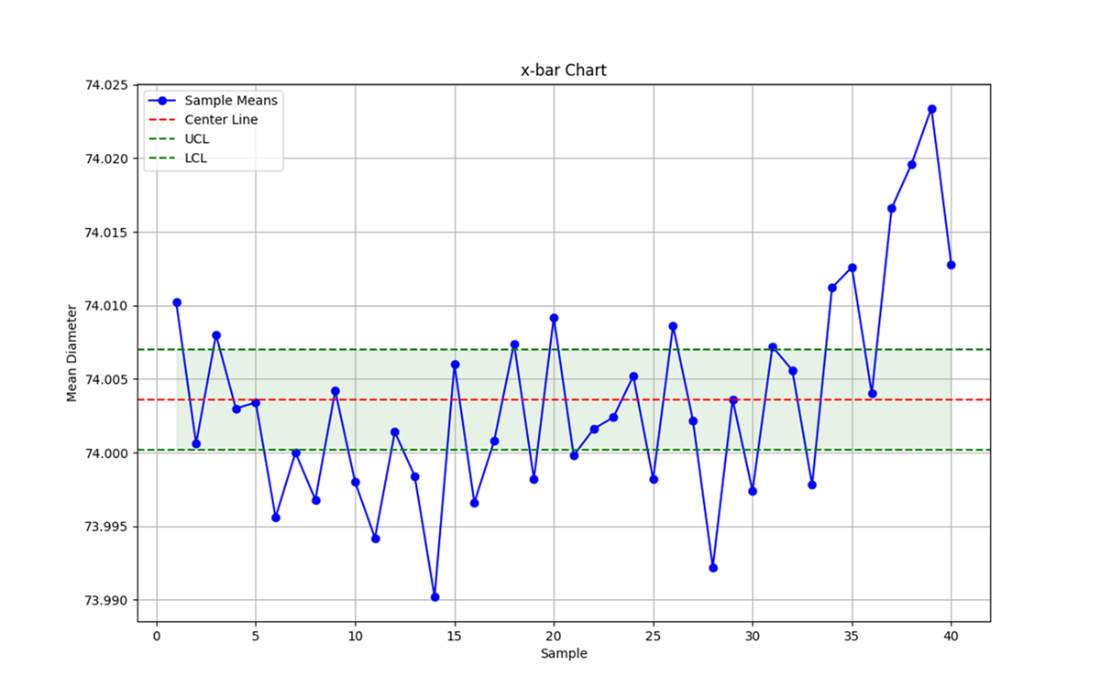
This x-bar chart displays the mean diameter of piston rings across 40 samples, with control limits set at three standard deviations from the overall mean. The chart helps monitor the consistency of the manufacturing process, ensuring that the average diameter remains within acceptable limits, signaling that the process is stable and in control.
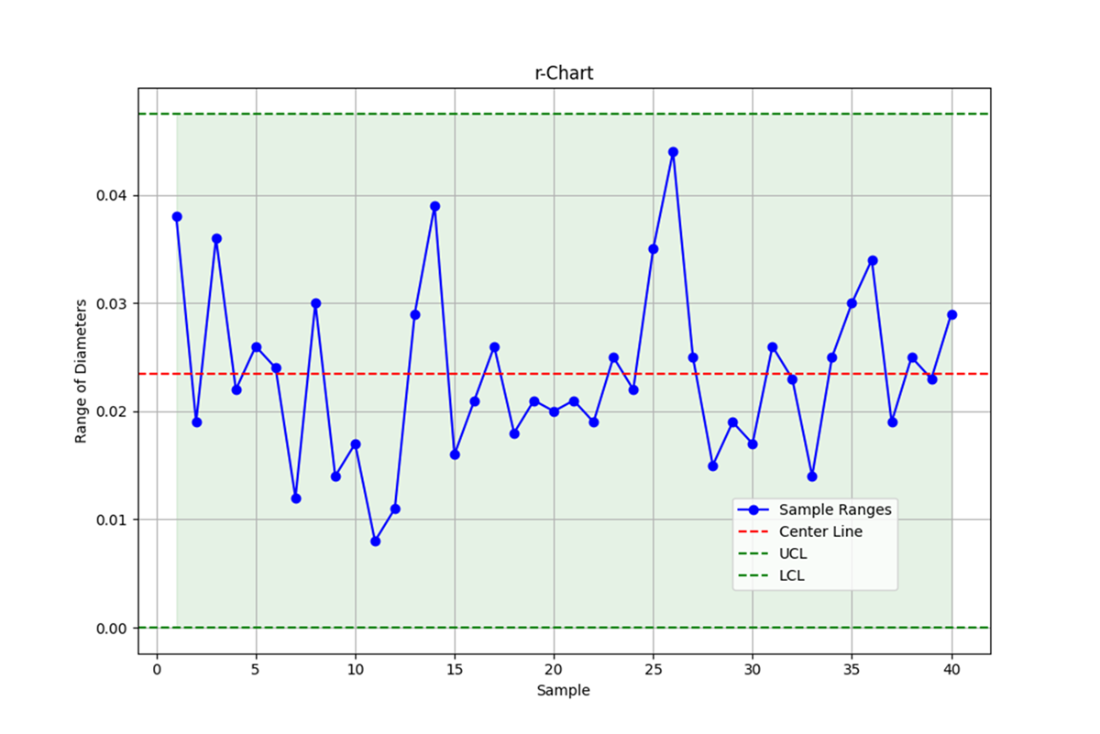
This r-chart displays the range of piston ring diameters across 40 samples, with control limits set at three standard deviations from the mean range. The chart helps monitor the variability in the process, indicating that all of the sample ranges fall within the control limits, suggesting the variability in the process is stable.
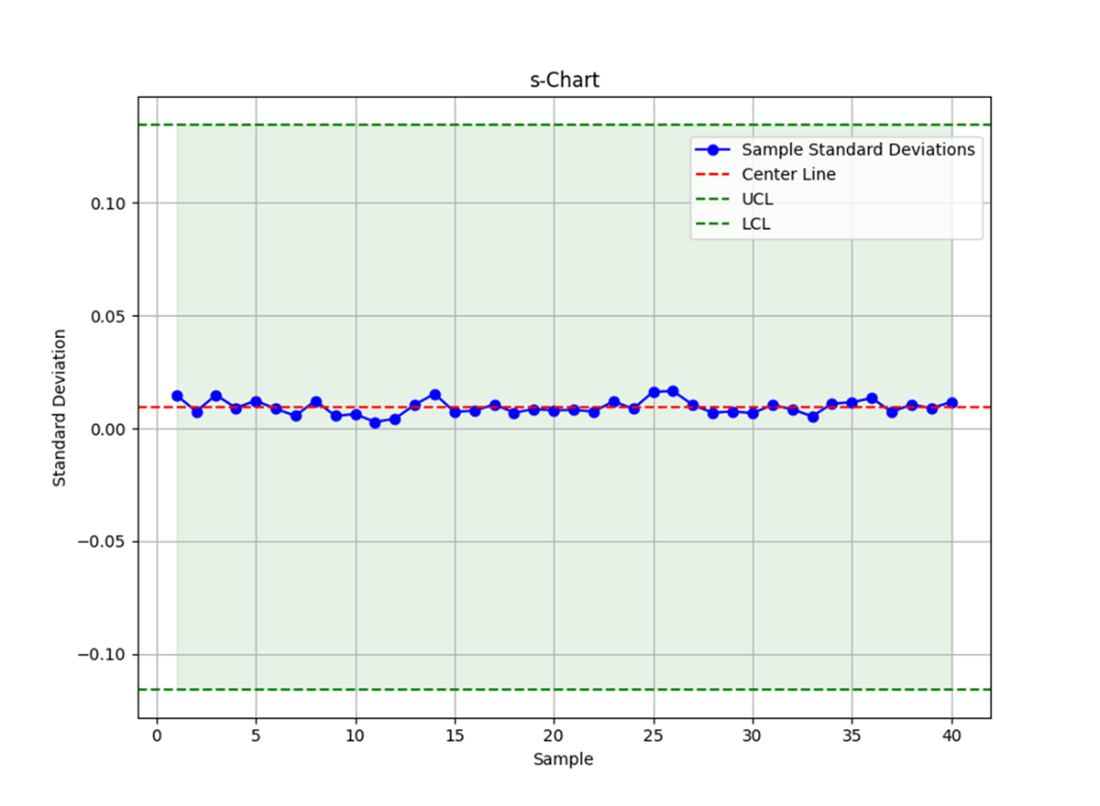
This s-chart displays the sample standard deviations for each batch of piston rings, with the Center Line representing the average standard deviation across all samples. The control limits (UCL and LCL) are set to identify any variations in the process, ensuring the process remains stable within the expected range.
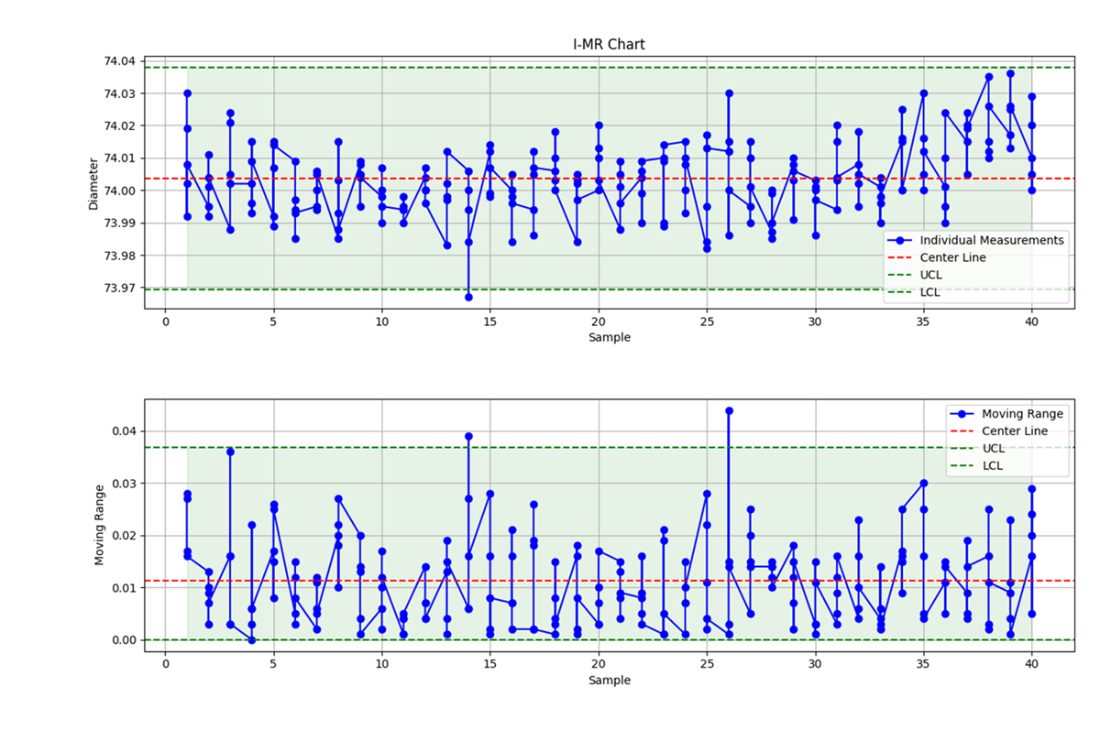
An I-MR chart, with the I-chart on top and the MR-chart below. The I-chart plots individual piston ring diameters for each sample, highlighting variation around the process mean. UCL and LCL lines indicate acceptable limits. The MR-chart tracks the moving range, or the difference between successive measurements, reflecting process variability. Lines connect data points from one sample to the next, illustrating changes in measurements and variability across samples.
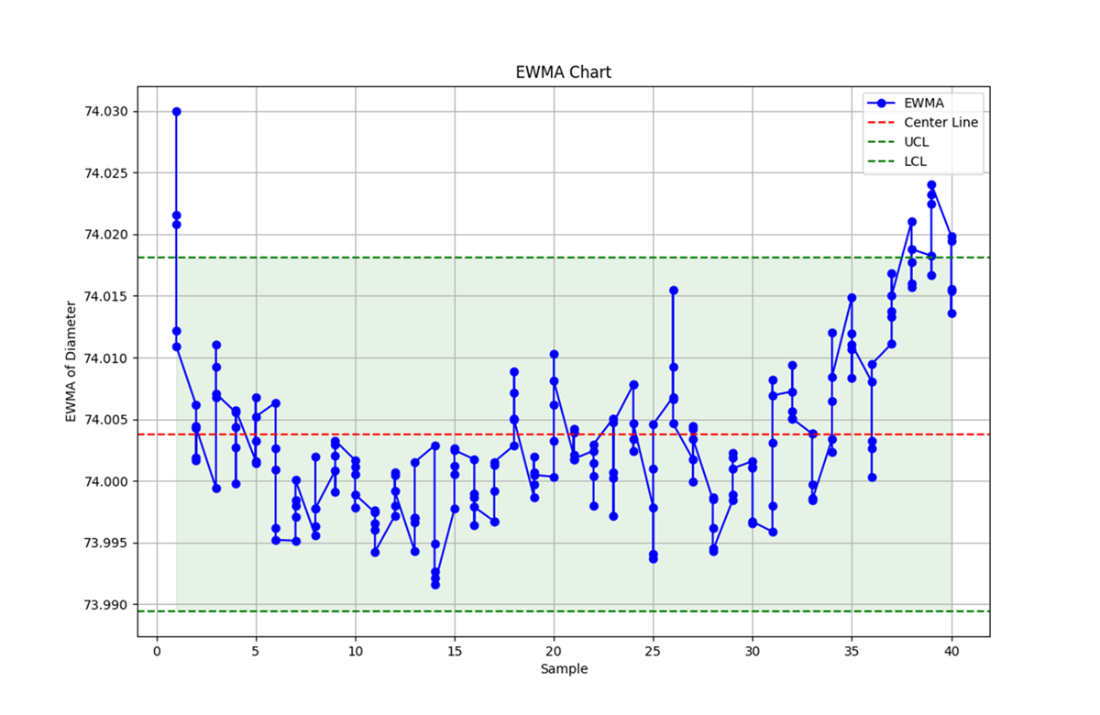
This EWMA chart displays the exponentially weighted moving average of piston ring diameters across 40 samples. The chart shows how the process mean evolves over time, with recent data points having more influence on the chart's trajectory than older ones. The center line represents the overall EWMA mean, while the UCL and LCL indicate the expected range of variation. Data points within these limits suggest the process is under control, while any point outside may signal a shift or trend that requires further investigation.
Summary
- Understanding key quality control measures, such as control limits, mean, and standard deviation, is crucial for interpreting control charts effectively. These measures provide the foundation for analyzing process stability and identifying areas for improvement.
- Control charts for attributes, including p-charts, np-charts, c-charts, and g-charts, are essential tools for monitoring categorical data. These charts help in tracking defects, proportions, and other attribute-based metrics to ensure processes remain within acceptable limits.
- Control charts for variables, which focus on continuous data such as measurements and process variations, were also covered. These charts, including x-bar charts, r-charts, s-charts, I-MR charts, and EWMA charts, are valuable for assessing the precision and consistency of manufacturing processes.
- It's crucial to use multiple control charts to comprehensively assess whether a process is in or out of control. Relying on just one chart can lead to incomplete or misleading conclusions, as different charts highlight different aspects of process performance. By using a combination of charts, such as x-bar and r-charts, you gain a more accurate and complete understanding of process stability and potential areas for improvement.
FAQ
Why visualize quality control data instead of just reading tables?
Visuals like control charts turn streams of numbers into clear patterns, making trends, shifts, and outliers easy to spot quickly. They create a shared understanding across roles—from operators to managers—and speed up decisions that keep processes stable and improving.What are Upper and Lower Control Limits (UCL/LCL) and why are they often set at three standard deviations?
UCL and LCL are horizontal lines that bracket expected common-cause variation around a process mean (center line). Using ±3 standard deviations captures about 99.73% of in-control data, so points outside typically signal special causes that require investigation. Even within limits, runs or trends can still indicate issues.When should I tighten or widen control limits?
- Use tighter limits (e.g., ±2σ) for highly critical processes (pharma, aerospace) to catch smaller shifts sooner.- Use wider limits (e.g., ±4σ) in inherently variable contexts (agriculture, construction) to avoid frequent false alarms.
The choice balances sensitivity versus nuisance signals for your context and risk tolerance.
What’s the difference between attribute and variable control charts, and how do I choose?
- Attribute charts (p, np, c, u, g) track qualitative outcomes: defective/not, counts of defects, or gaps between defects. Choose these when you count events or classify items.- Variable charts (x-bar, r, s, I-MR, EWMA) track measured values (e.g., diameters). Choose these for continuous data to monitor means and variability. Often you combine charts (e.g., x-bar with r or s) for a fuller picture.
How do I build and interpret a p-chart?
Calculate the proportion defective per sample (D/n), then compute the overall mean p̄ and the standard deviation sqrt(p̄(1−p̄)/n). Plot proportions by sample with center line p̄ and UCL/LCL at p̄ ± 3σ (or chosen multiple). Best for varying sample sizes. Points outside limits or sustained patterns indicate special causes.When should I use an np-chart instead of a p-chart?
Use an np-chart when sample size n is constant; it plots the number of defectives (D) rather than the proportion. Limits derive from the mean np̄ and its standard deviation. With constant n, np-charts are simpler to read, and you can optionally tighten limits (e.g., ±2σ) for earlier detection, highlighting out-of-control points.What’s the difference between “number of defective items” and “number of defects,” and which charts use them?
- Number of defective items (D): counts units that fail; used in np-charts (and proportions in p-charts).- Number of defects (C): counts all defect instances, even multiple per unit; used in c- and u-charts. c-charts assume a constant area of opportunity; u-charts normalize by sample size. LCL cannot be negative and is floored at zero.
What does a g-chart monitor and when is it useful?
A g-chart tracks the number of units (or opportunities) between defect occurrences, making it ideal for rare events. It emphasizes intervals rather than counts in a sample. Increasing gaps suggest improving reliability; points breaching limits or unusual runs indicate instability needing investigation.How do x-bar, r, s, and I-MR charts complement each other for variable data?
- x-bar: monitors shifts in the process mean across subgroups.- r: monitors within-subgroup range (spread).
- s: monitors within-subgroup standard deviation (more precise for larger subgroups).
- I-MR: for individual measurements; I tracks the mean level, MR tracks change between consecutive points. It’s possible for variability charts (r/s/MR) to be in control while x-bar signals mean shifts—both perspectives are needed.

 Statistics Every Programmer Needs ebook for free
