12 Examining and testing naturally occurring number sequences
This chapter introduces Benford’s law as a practical tool for examining naturally occurring number sequences. It explains why smaller leading digits appear more often than larger ones in data that span multiple orders of magnitude and are best viewed on a logarithmic scale. The discussion highlights common, high-impact uses—such as fraud detection, data integrity checks, economic and scientific analysis—and clarifies where Benford’s law applies and where it does not (for example, not to identifiers or bounded, non-logarithmic data). It also contrasts Benford patterns with uniform and random digit distributions to build intuition for recognition by sight.
The author demonstrates how to compute the theoretical Benford distribution and compare it to observed data with Python, using pandas, numpy, and matplotlib. After contrasting with simulated uniform and random digit frequencies, the chapter analyzes three real-world datasets—street addresses, world populations (2020), and utility payment amounts—showing that each exhibits the characteristic Benford shape (with 1–3 as leading digits making up roughly 60% of observations and 7–9 much rarer). The workflow includes extracting and cleaning leading digits (e.g., removing non-numerics, negatives, zeros) and visually comparing observed proportions to Benford expectations.
To move beyond visual inspection, the chapter applies several tests: a chi-square goodness of fit (example p ≈ 0.52, so fail to reject Benford), mean absolute deviation (MAD ≈ 0.013, indicating marginal-to-good conformity), and the distortion factor with a Z-statistic (about 2.17% distortion, Z ≈ 0.88, again consistent with Benford). It then uses mantissa statistics—mean, variance, excess kurtosis, and skewness—to check the implied uniformity of mantissas; the observed results align closely with theoretical targets, and a rank-plot of mantissas tracks a uniform reference line. The chapter concludes with a clear takeaway: combine thoughtful data preparation, visualization, and complementary statistical tests to judge Benford conformity and flag anomalies with confidence.
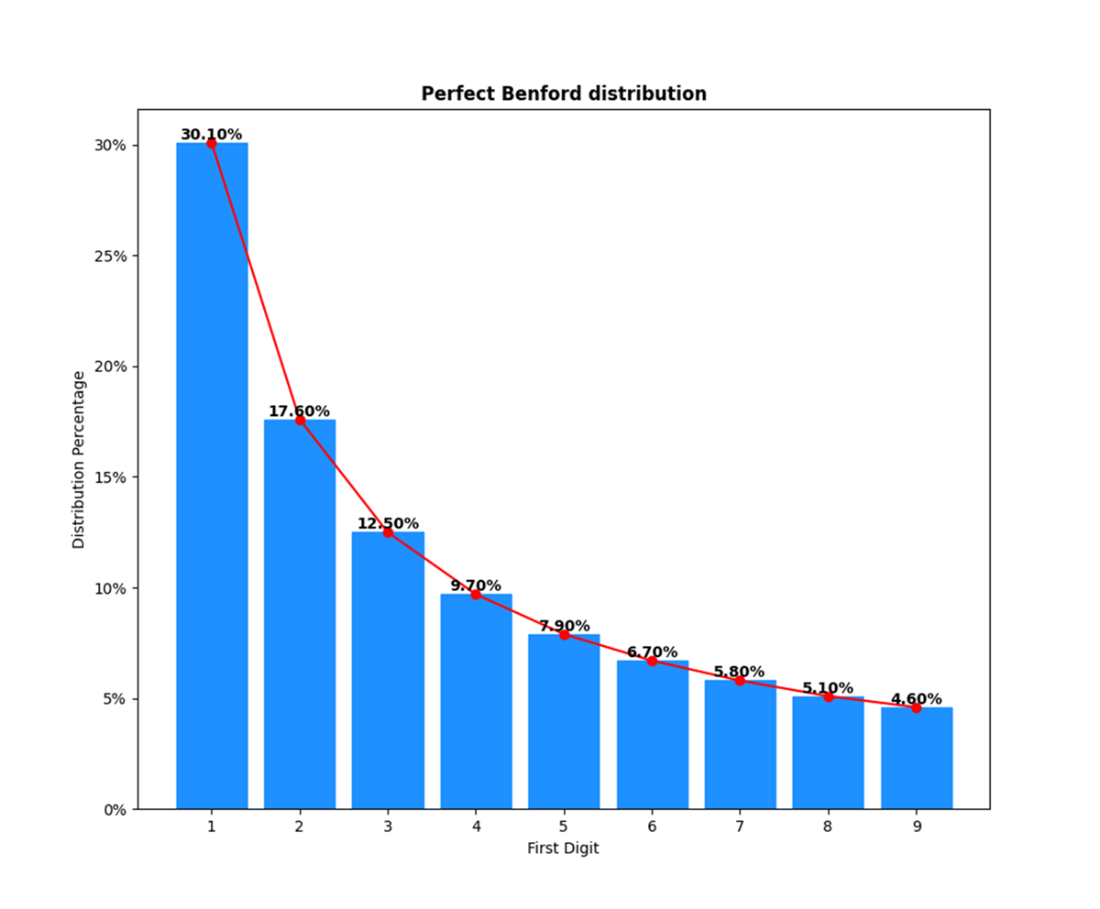
A numeric data series perfectly follows a Benford distribution when the leading digits, plotted along the x-axis, each have a likelihood of occurrence equal to the probability plotted along the y-axis. So, for instance, the numeral 1 should be the leading, or first, digit in approximately 30% of the observations; and the numeral 9 should be the leading digit is less than 5% of the observations.
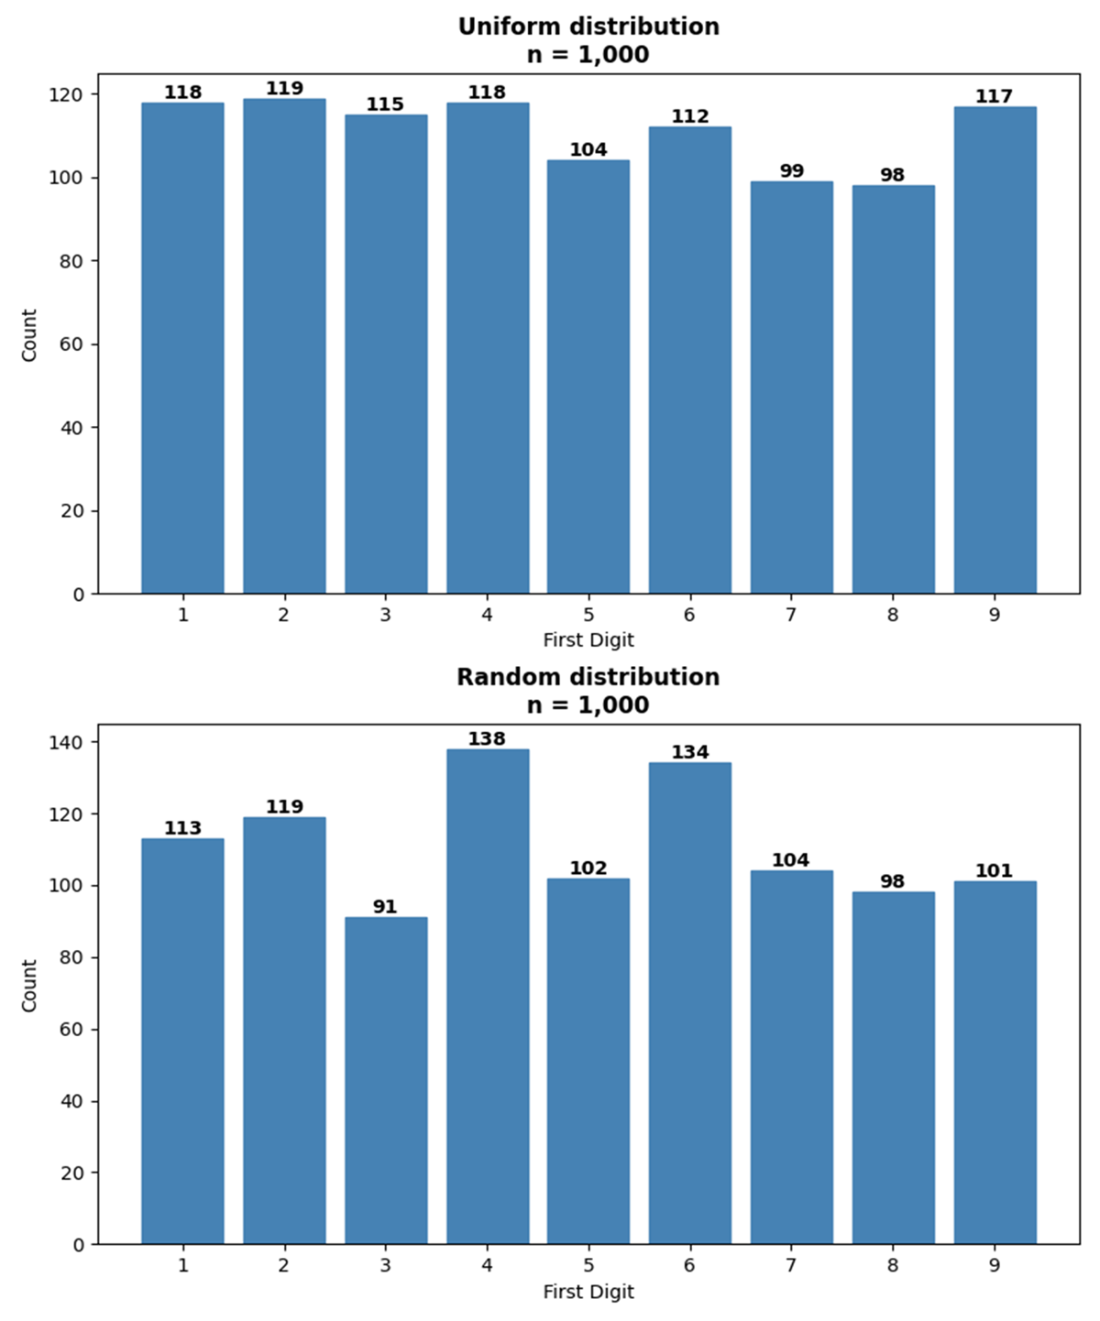
A uniform distribution of 1,000 records on top and a random distribution of 1,000 records on the bottom. Many numeric data sets take on one of these two probability distributions. In a Benford distribution, 1s, 2s, and 3s represent more than 60% of the occurrences; but in both these distributions those same digits represent barely 30% of the occurrences.
The distribution of leading digits in street addresses from East Baton Rouge Parish in Louisiana. The distribution closely resembles a perfect Benford distribution, where smaller leading digits are much more prevalent than larger leading digits. In fact, 1s, 2s, and 3s are the leading digits in 60.4% of the street addresses; in a perfect Benford distribution the same digits represent 60.2% of the observations.
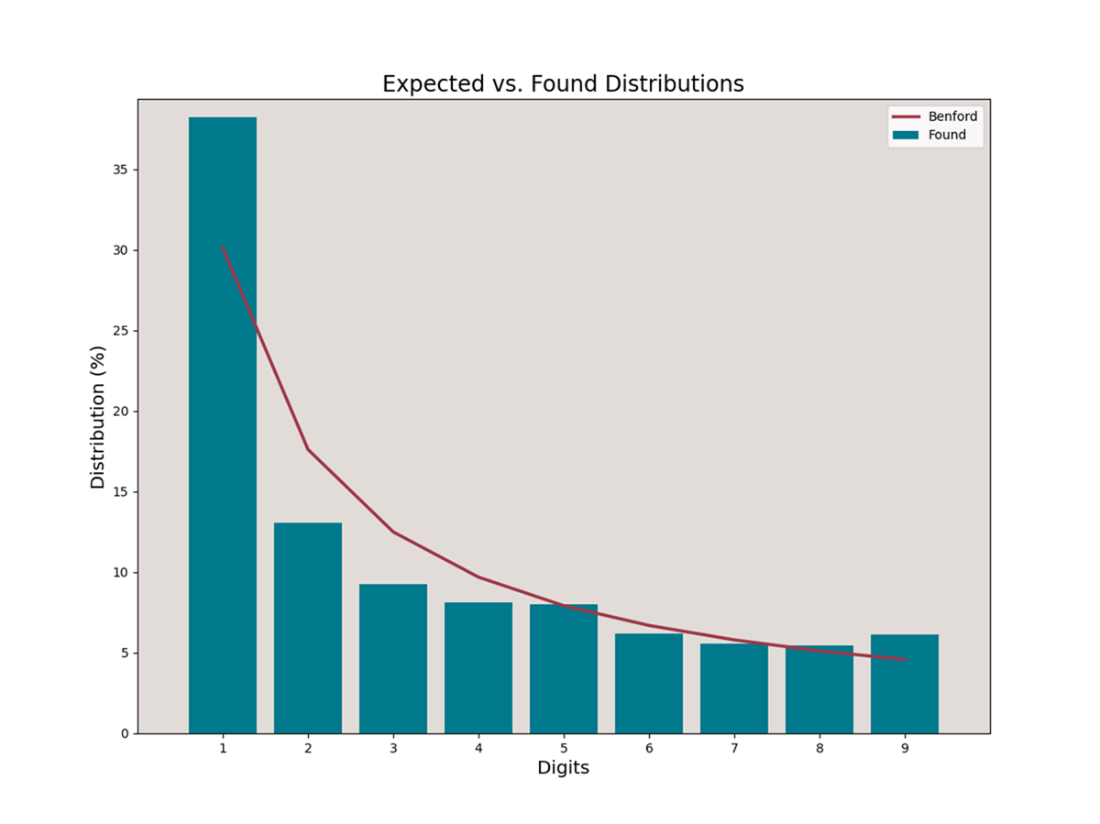
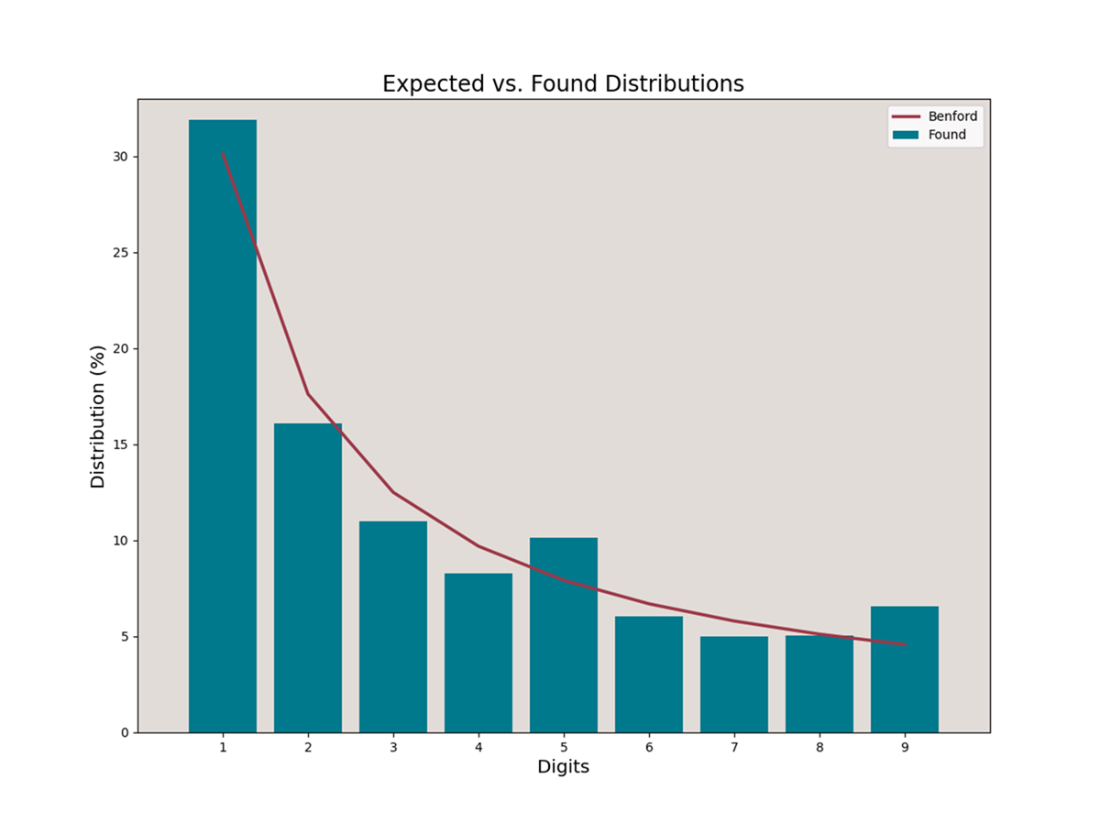
The distribution of leading digits in world population counts from 2020. Once more, we again see a distribution in accordance with Benford’s law. As a matter of fact, 1s, 2s, and 3s constitute 58.3% of the record count (versus a perfect Benford distribution of 60.2%), while 7s, 8s, and 9s represent 14.1% of all records (compared to 14.5% from a perfect Benford distribution).
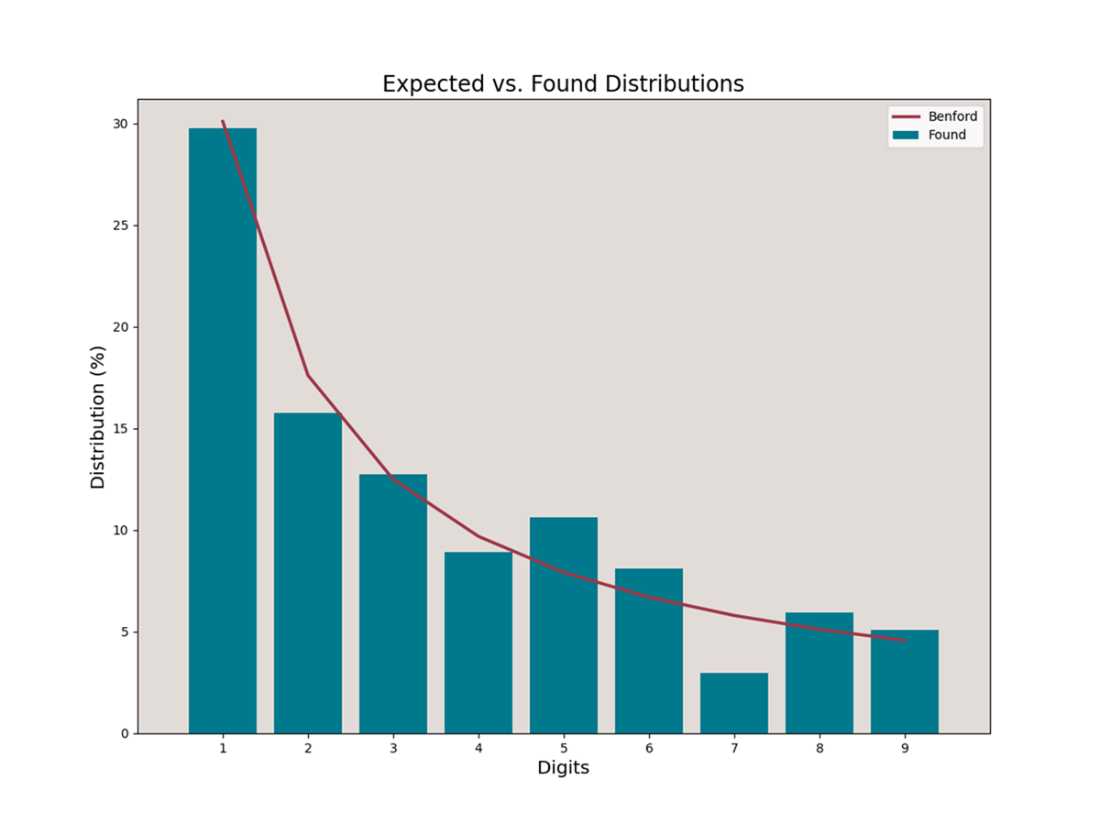
The distribution of leading digits in 2010 payment amounts from a utility company in the US west coast. We again see a distribution that obviously obeys Benford’s law. The smallest leading digits (1s, 2s, and 3s) represent exactly 59% of the total record count and the largest leading digits (7s, 8s, and 9s) represent just 16.6% of the records. Once more, in a perfect Benford distribution, these figures are 60.2% and 14.5%, respectively.
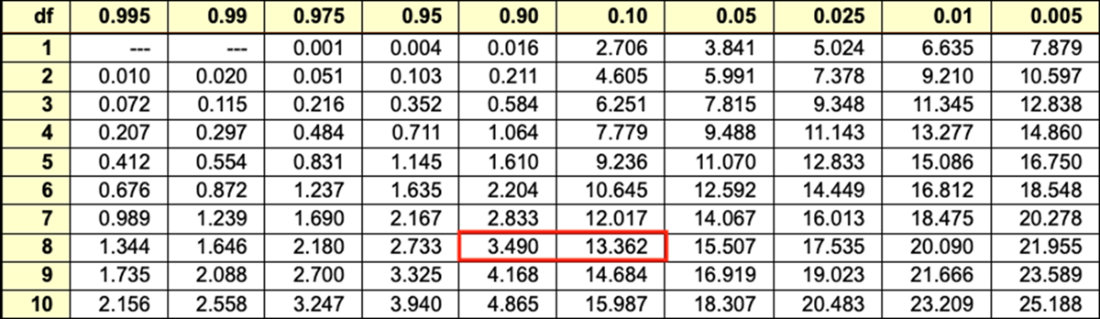
A snippet from a typical chi-square probabilities table from which we can get an estimated p-value by cross-referencing the degrees of freedom and the chi-square statistic. The degrees of freedom equal 8; the chi-square statistic equals 7.1925, which is between 3.490 and 13.362; the p-value therefore equals some number between 0.10 and 0.90. While that’s a substantial range, it nevertheless falls entirely about the 5% threshold; thus, without running any code we can determine that the results are not statistically significant, and therefore we can, and should, fail to reject the null hypothesis.
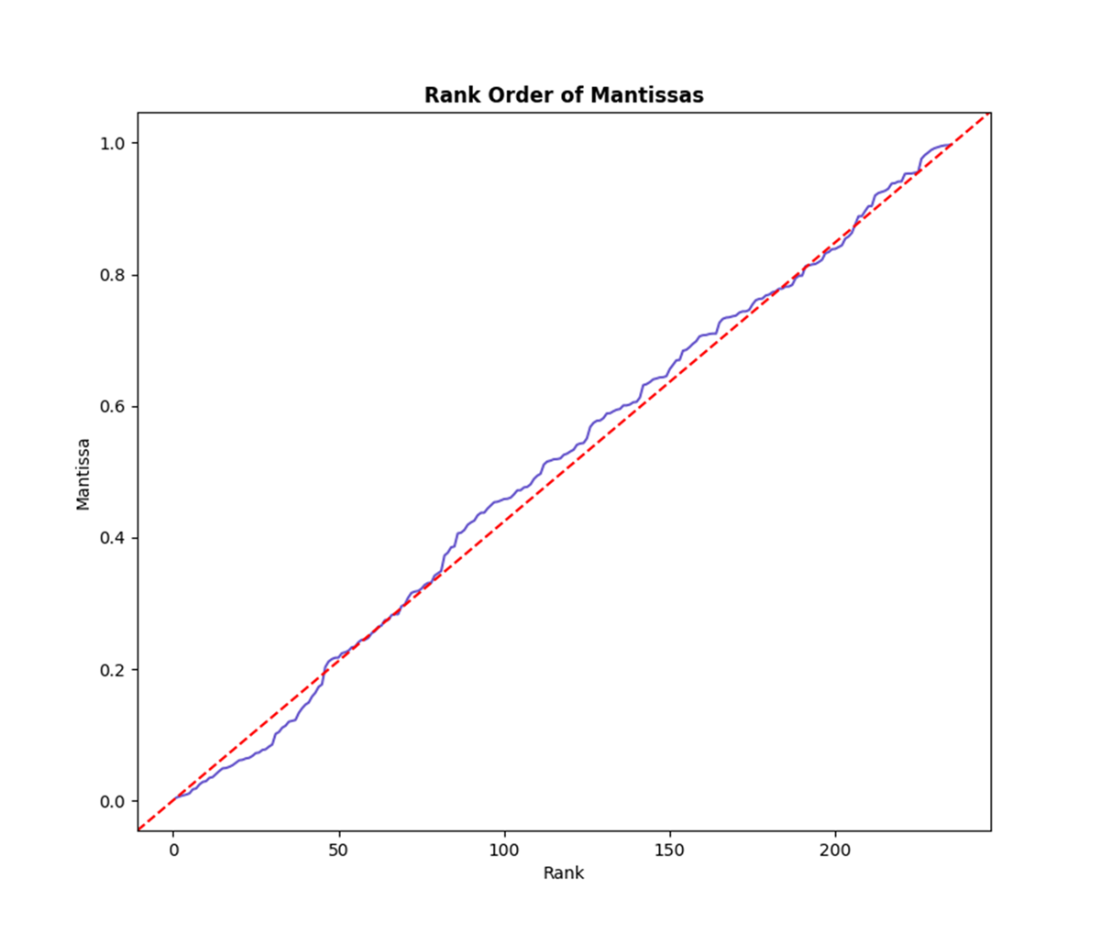
The dashed line represents a perfect uniform distribution of mantissas that we would expect to observe when leading digits perfectly obey Benford’s law; the solid line represents the mantissas, sorted in ascending order, from the populations data frame. The observed mantissas assume a “close-enough” uniform distribution that further suggest world population counts obey Benford’s law.
Summary
- Benford’s law, also known as the first-digit law, states that many sets of numeric data follow a logarithmic distribution, by which smaller leading digits are more prevalent than larger leading digits.
- Data sets that should obey Benford’s law but instead take on a very different distribution might have been manipulated due to fraudulent or other suspicious activity. Significant deviations from Benford’s law are just the smoke, not the fire, however. Further investigation might absolutely be warranted when significant deviations from a Benford distribution are observed; at the same time, we should refrain from drawing major conclusions from nothing other than a Benford analysis.
- Understanding Benford’s law is especially important in an era where financial fraud, tax evasion, and other forms of data manipulation are increasingly sophisticated. By identifying anomalies in numerical data, analysts and investigators can uncover irregularities that may warrant deeper scrutiny, making Benford’s law a valuable tool for fraud detection and forensic accounting.
- Data sets to which Benford’s law best applies are those that are distributed across multiple orders of magnitude and don’t have pre-established minimum and maximum values; these same sets of data are right-skewed, or positively-skewed, by which the mean is greater than the median. Data sets that obey Benford’s law are frequently referred to as naturally occurring number sequences.
- We imported three real-world data sets that, going in, were assumed to follow a Benford distribution. By extracting the leading digits from those data sets and plotting the frequency of occurrences for each, we subsequently discovered, at least from visual inspection, that they each obey Benford’s law,
- Data comprised of numerals used as identifiers is maybe the best example of numeric data that doesn’t qualify as a naturally occurring number sequence. Scores—test scores and IQ scores, for instance—is another good example.
- Don’t rely on visual inspection alone when performing a Benford analysis; and by the same token, don’t reject or fail to reject a null hypothesis from just one statistical test when options are available. We tested world population data four times and determined from each analysis that 2020 world population figures, based on our rigorous statistical testing, align quite well with the characteristics of a Benford distribution.
FAQ
What is Benford’s law in plain terms?
Benford’s law says that in many real-world numeric datasets, small leading digits occur far more often than large ones. About 30.1% of values start with 1, while fewer than 4.6% start with 9. This happens when data span several orders of magnitude and are best viewed on a logarithmic scale.When does Benford’s law apply (and when doesn’t it)?
It applies best when all of the following hold: data span multiple orders of magnitude; there are no tight, artificial minimum or maximum limits; numbers are not identifiers (like IDs, account numbers, ZIP codes); and the distribution is right-skewed (mean greater than median). It does not apply to calendar dates, fixed-range scores, or systematically assigned identifiers.Why is Benford’s law useful? What are typical use cases?
It is widely used to flag anomalies in fraud detection (e.g., invoices, expenses, tax returns). Other uses include data integrity checks, economic and scientific data analysis, digital forensics, and population studies—anywhere naturally varying magnitudes appear.How does a Benford distribution differ from uniform or random digit distributions?
A Benford first-digit plot is steeply declining (1s most common, 9s rare). In a uniform distribution, all digits occur about equally (flat shape). “Random” draws of digits are uniform in expectation but look noisy at small samples. In Benford, digits 1–3 often comprise about 60% of observations; in uniform/random they are around 33%.Why does Benford relate to logarithmic scales?
In Benford-conforming data, first-digit probabilities are proportional to the widths of intervals between successive powers of 10 on a log scale. That’s why data spanning orders of magnitude (better represented in log space) tend to follow Benford’s law.What data preparation steps matter before testing Benford in code?
- Extract the leading digit from each positive number and drop non-numeric leading characters.- Remove zeros and negatives for first-digit analysis (they don’t have valid leading digits under Benford).
- Ensure the first-digit field is numeric (integers 1–9).
- Avoid identifiers and artificially capped ranges.

 Statistics Every Programmer Needs ebook for free
