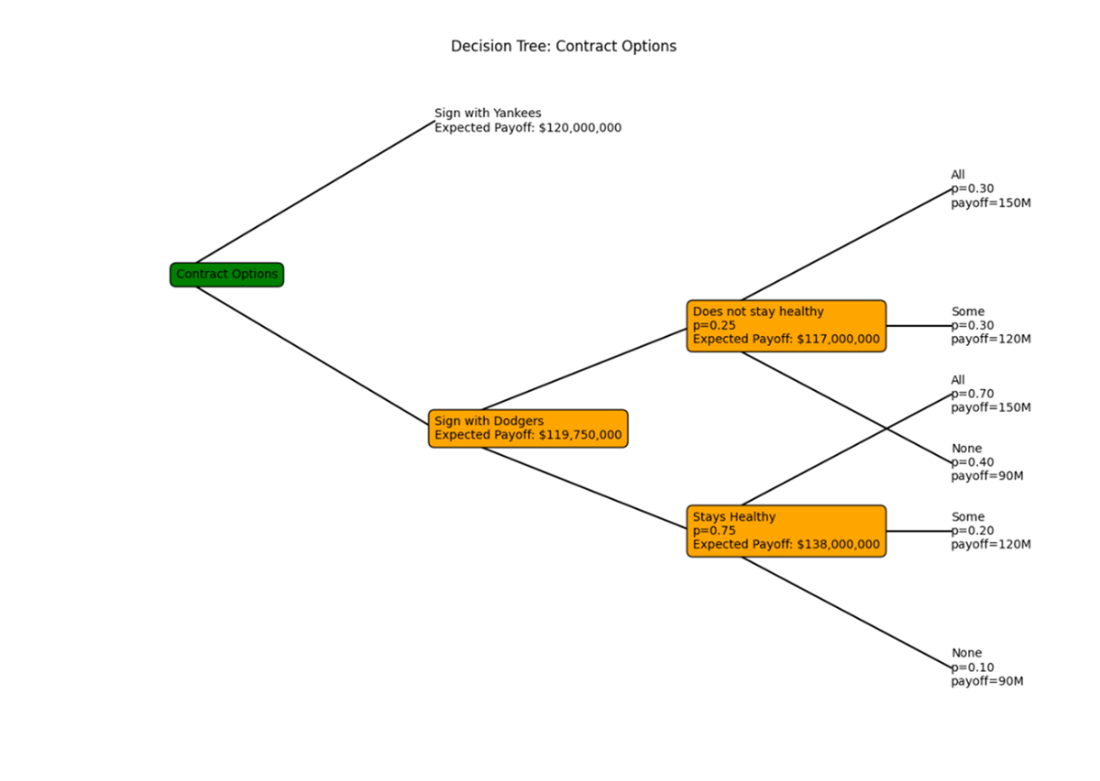
A decision tree that visualizes two very different contract offers. The tree otherwise outlines the expected payoffs based on different states of nature, allowing the player to accept the one contract with the highest expected value.
Summary
The Maximax method is an optimistic decision-making approach that focuses on maximizing the maximum possible payoff. Decision-makers using this method choose the option with the highest potential reward, reflecting a high tolerance for risk and a preference for best-case scenarios.
The Maximin method is a conservative decision-making approach that aims to maximize the minimum payoff. It involves selecting the option with the best worst-case scenario, making it suitable for risk-averse decision-makers who prioritize minimizing potential losses.
The Minimax Regret method aims to minimize the maximum regret, which is the difference between the actual payoff and the best possible payoff that could have been achieved with perfect foresight. Decision-makers using this method focus on reducing the potential for regret by selecting the option that offers the least unfavorable outcome compared to the best possible alternative.
The Expected Value method is a decision-making approach that calculates the average outcome by weighting each possible scenario by its probability. Decision-makers use this method to choose the option with the highest expected return or lowest expected loss, providing a balanced and rational evaluation of all potential outcomes and their likelihoods.
Decision trees are graphical representations of decision-making processes that outline various choices, chance events, probabilities, and payoffs. They provide a clear, visual method for evaluating complex decision scenarios, helping to identify the most favorable outcomes.
Creating the schema for a decision tree involves defining the decision nodes, chance nodes, probabilities, and payoffs. This structured blueprint ensures all possible outcomes are systematically considered, laying the groundwork for constructing the decision tree.
Constructing the decision tree involves translating the schema into a visual format, typically using nodes and branches to represent decisions and chance events. This step allows for easy interpretation and analysis of the decision-making process, helping to visualize the potential paths and outcomes clearly.
Real-world applications of these decision-making methods extend beyond theoretical exercises. Businesses use them to evaluate investment strategies, optimize resource allocation, assess project risks, and make strategic planning decisions in uncertain environments. By applying these frameworks, decision-makers can systematically analyze complex scenarios and improve the quality of their choices.
FAQ
How do the decision trees in this chapter differ from machine learning decision trees?These trees are for decision analysis, not classification. They map decisions, chance events, probabilities, and payoffs to compute expected values and pick the best course of action, rather than learning patterns from data.What methods can I use when probabilities are unknown?Use non-probabilistic methods: Maximax (choose the alternative with the highest possible payoff), Maximin (choose the alternative with the best worst-case payoff), and Minimax Regret (minimize the largest possible regret across states of nature).How do I build and use a payoff table?List alternatives (rows), states of nature (columns), and payoffs for each combination. Then apply a method: Maximax (row max → choose max), Maximin (row min → choose max), or Minimax Regret (compute regret table, take row maxima, choose minimum).What is the Minimax Regret method and how is regret computed?For each state of nature, find the maximum payoff; subtract each alternative’s payoff from that maximum to get regret. For each alternative, take its maximum regret across states; choose the alternative with the smallest of these maxima.How is Expected Value (EV) calculated and why must probabilities sum to 1?EV is the sum of each payoff multiplied by its probability across all states. Probabilities from the same chance node must sum to 1 so the weighted average is valid and interpretable.In the investment example, which option does EV select when P(strong)=0.75 and P(weak)=0.25?The Stock Market has EV $45,000, which is the highest among the options considered (e.g., 50/50 split $42,500, Soccer Club $40,000, Savings $35,000). EV therefore favors investing in the Stock Market, though small probability changes can flip the decision.What are decision nodes and chance nodes, and how should I read a decision tree?Decision nodes represent choices; chance nodes represent uncertain events with branches labeled by probabilities. Construct left-to-right (or top-to-bottom) but interpret right-to-left (or bottom-to-top), rolling expected values back toward the initial decision.How do I create a decision tree schema manually?Specify the tree name, list relevant variables (e.g., agent fees), define the root decision node with alternatives, then add chance nodes with probabilities and leaf payoffs. Example: a player choosing Yankees (guaranteed $120M) vs Dodgers (probabilistic incentives, health-dependent) with agent fees applied.How do I build the schema programmatically with anytree?Create a root Node, add decision nodes (e.g., “Sign with Dodgers”, “Sign with Yankees”), add chance nodes (e.g., “Stays Healthy p=0.75”) and leaves with payoffs. Compute expected payoffs (including costs like agent fees) and append them to node labels for clarity.How do I plot the decision tree and what are visualization best practices?Use matplotlib to position nodes, draw edges, and label nodes. Distinguish decision vs chance nodes with colors (e.g., green vs orange), include probabilities and expected payoffs on labels, turn off axes, and ensure spacing for readability. In the MLB example, the overall EV favors Yankees (~$120M) over Dodgers (~$119.75M).
pro $24.99 per month
access to all Manning books, MEAPs, liveVideos, liveProjects, and audiobooks!

 Statistics Every Programmer Needs ebook for free
