5 Mastering Cost Allocation Techniques
Cost allocation is central to FinOps because it brings clarity, accountability, and control to cloud spending as organizations scale. This chapter builds on tagging fundamentals to show how to attribute costs to the right teams, projects, or applications using direct, shared, and fixed allocation models. It then walks through how AWS-native capabilities—Cost Explorer, the Cost and Usage Report (CUR), Athena, and QuickSight—combine to provide both granular analysis and executive-friendly visibility. The result is a practical toolkit to accurately attribute spend, expose savings opportunities, and embed financial accountability across engineering and business stakeholders.
After defining allocation models, the chapter demonstrates implementation patterns: direct allocation via consistent resource tagging; shared cost treatment through chargeback or showback using proportional usage metrics; and fixed allocation for predictable splits where precise usage is hard to capture. It details how to operationalize these models with Cost Explorer filters and reports (by tags, service, region, usage type), automate analysis using the AWS SDK, and enrich an asset inventory with per-resource costs by enabling and backfilling cost allocation tags such as ResourceId. These practices create traceable, auditable reports that align spend to cost centers and projects, making budgeting and optimization actionable.
For advanced allocation, the chapter shows how to enable CUR with resource IDs, catalog it with Glue, query it in Athena for service, resource, and tag-driven breakdowns, and surface insights via QuickSight dashboards. It also introduces AWS Cloud Intelligence Dashboards (CUDOS) to accelerate best-practice visualizations. Finally, it presents FOCUS—the FinOps Open Cost & Usage Specification—as an emerging standard to normalize cost and usage data across providers, easing multi-cloud analysis while noting adoption is still maturing. By the end, readers can implement robust allocation models, automate granular reporting, and build scalable dashboards that inform governance and set the stage for budgeting and forecasting.
AWS Cost Explorer default settings
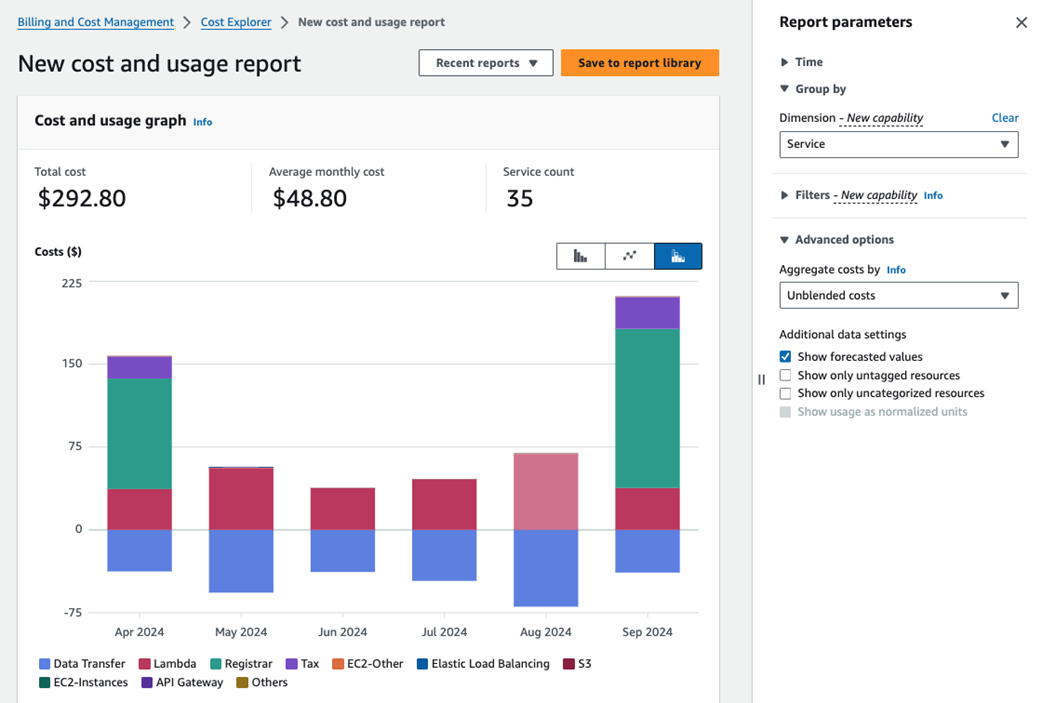
Cost breakdown by Project
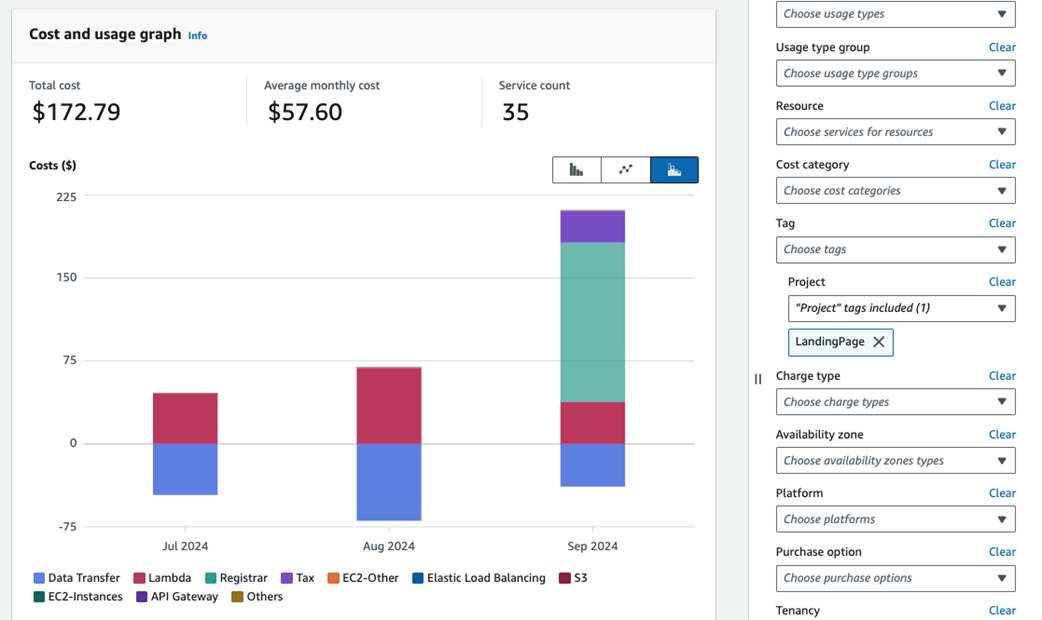
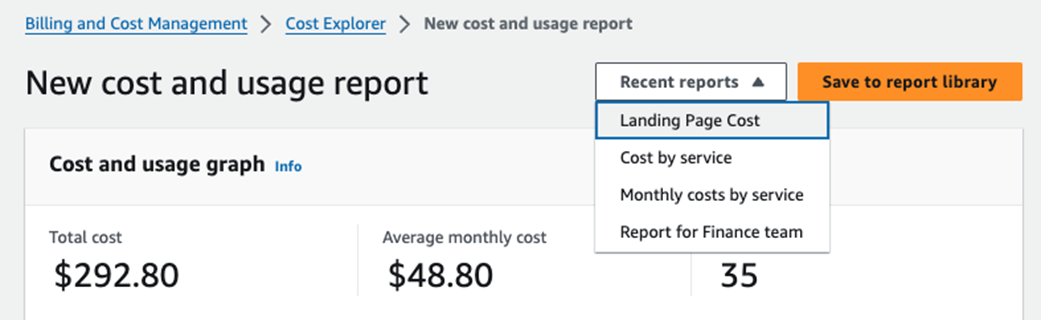
Creating a custom cost report
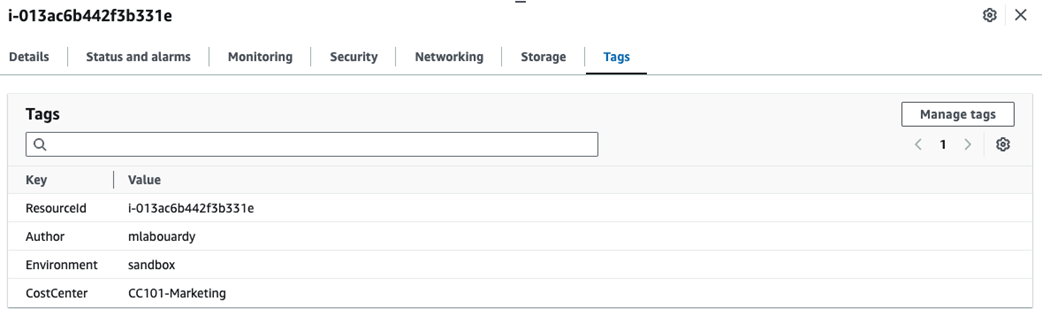
Tagging EC2 with ResourceId
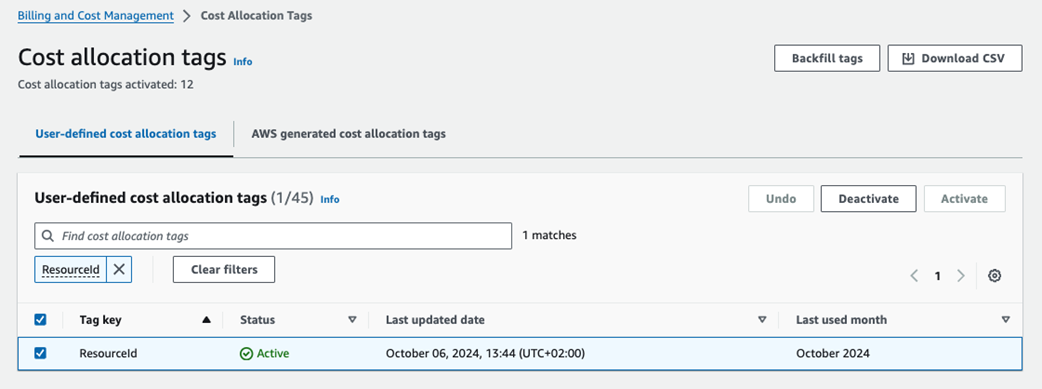
Cost allocation tags activation
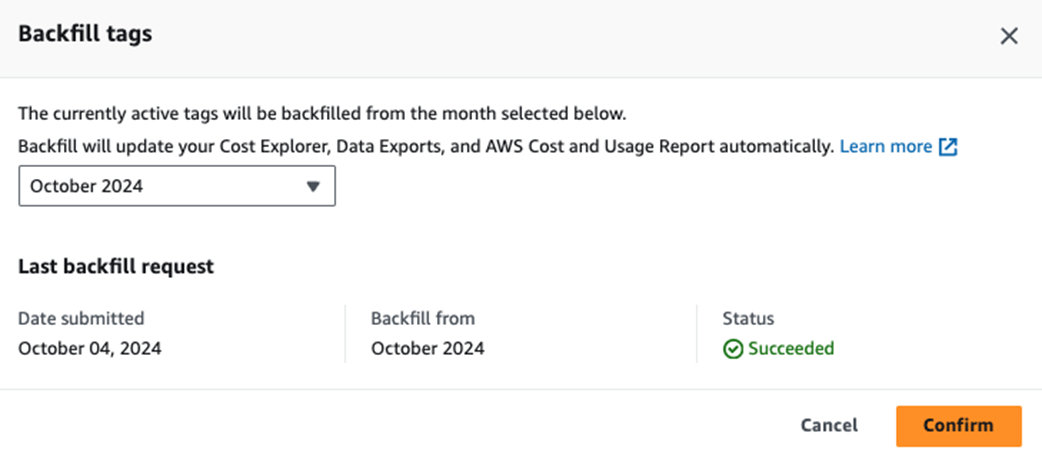
Backfill cost allocation tags
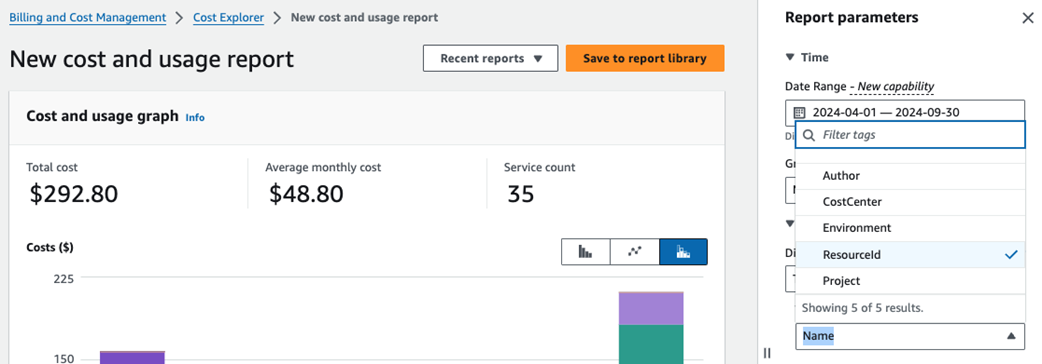
Grouping cost by ResourceId tag
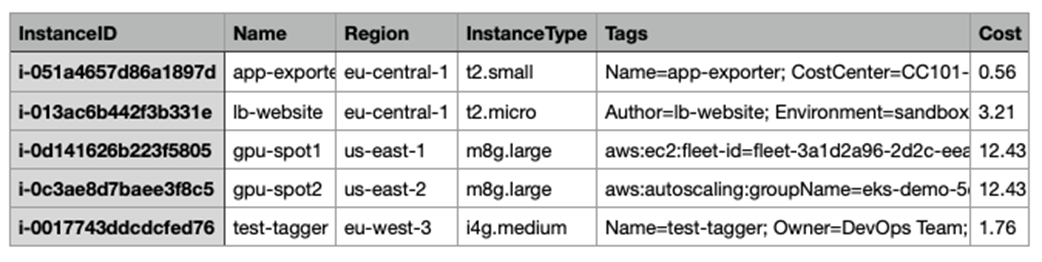
EC2 resources with their monthly cost
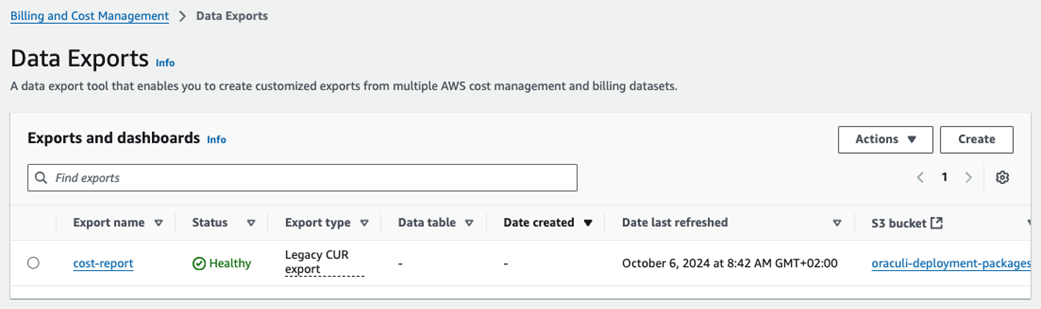
List of export reports
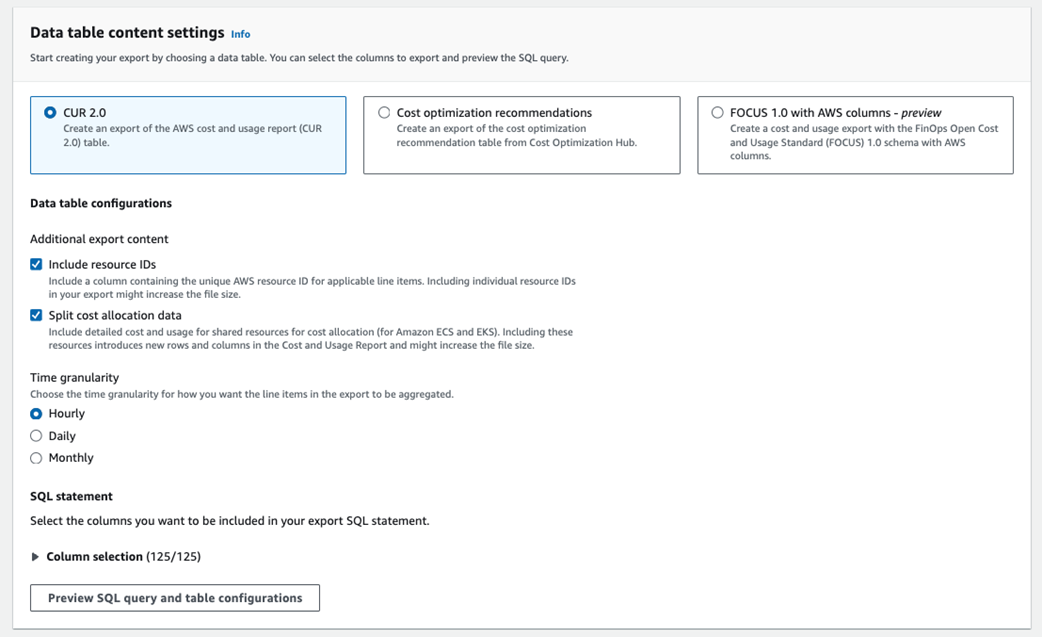
Configuring AWS CUR content settings
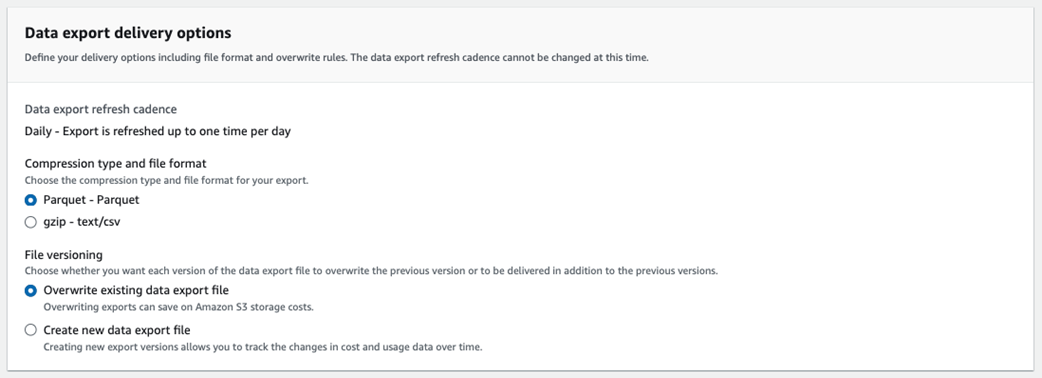
Configuring AWS CUR delivery options
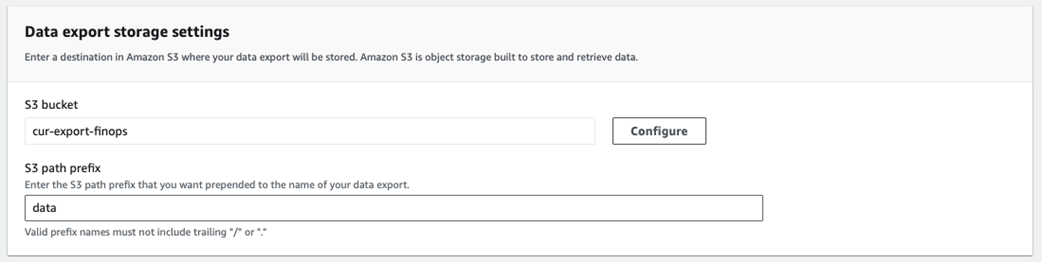
Configuring AWS CUR storage options
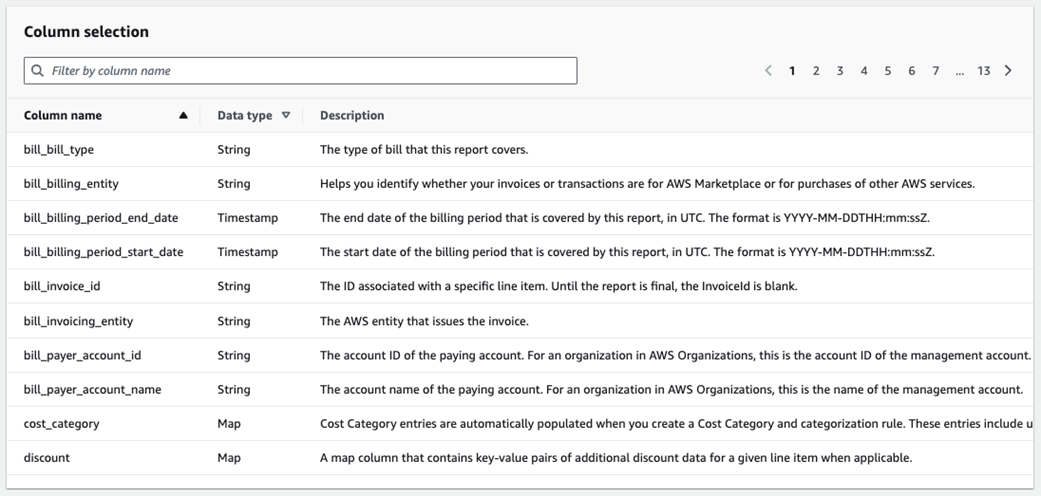
CUR column fields
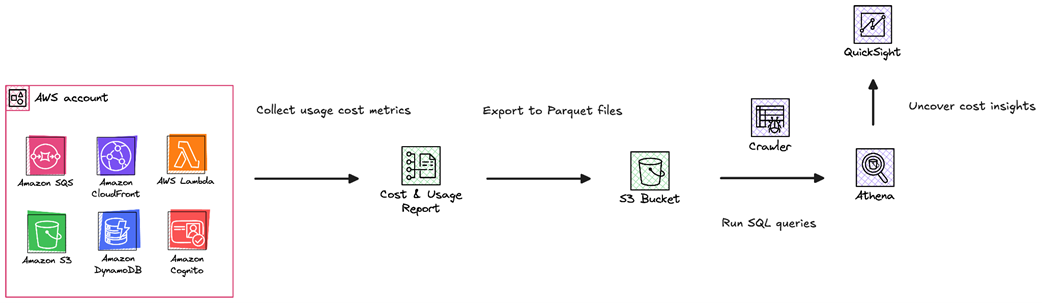
Building a FinOps dashboard by running SQL queries against exported CUR datapoints
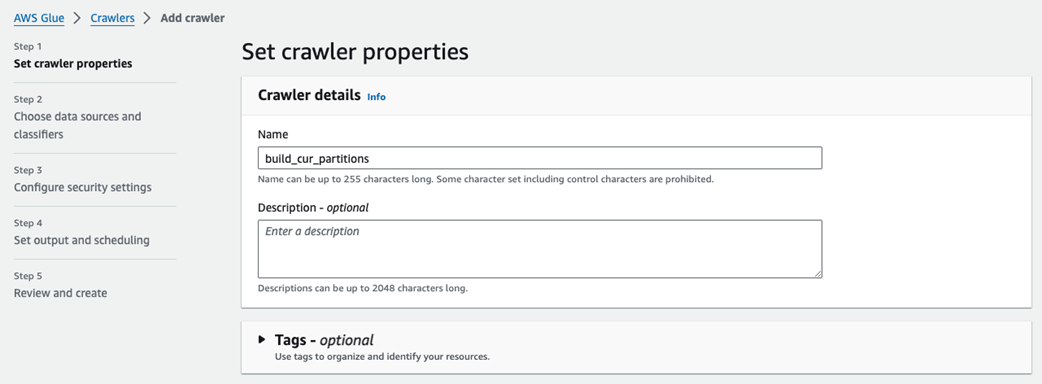
New glue crawler
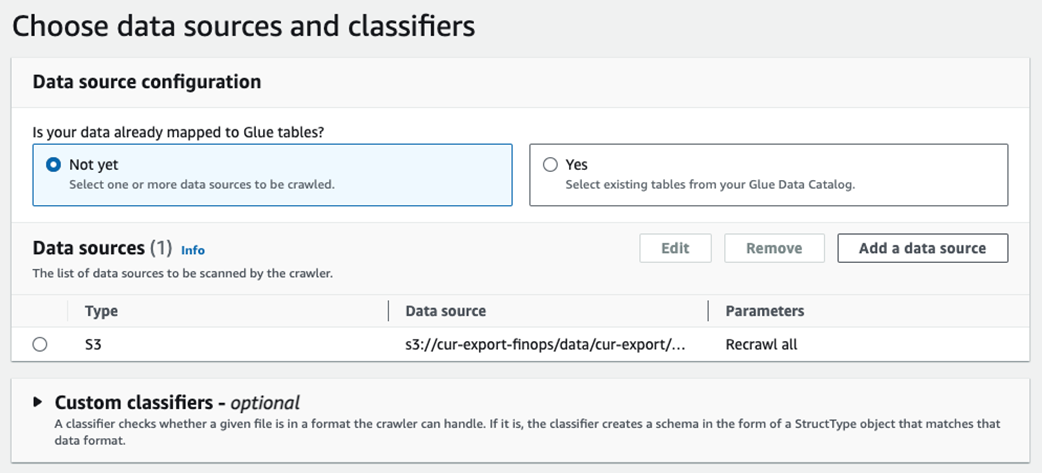
Crawler data source
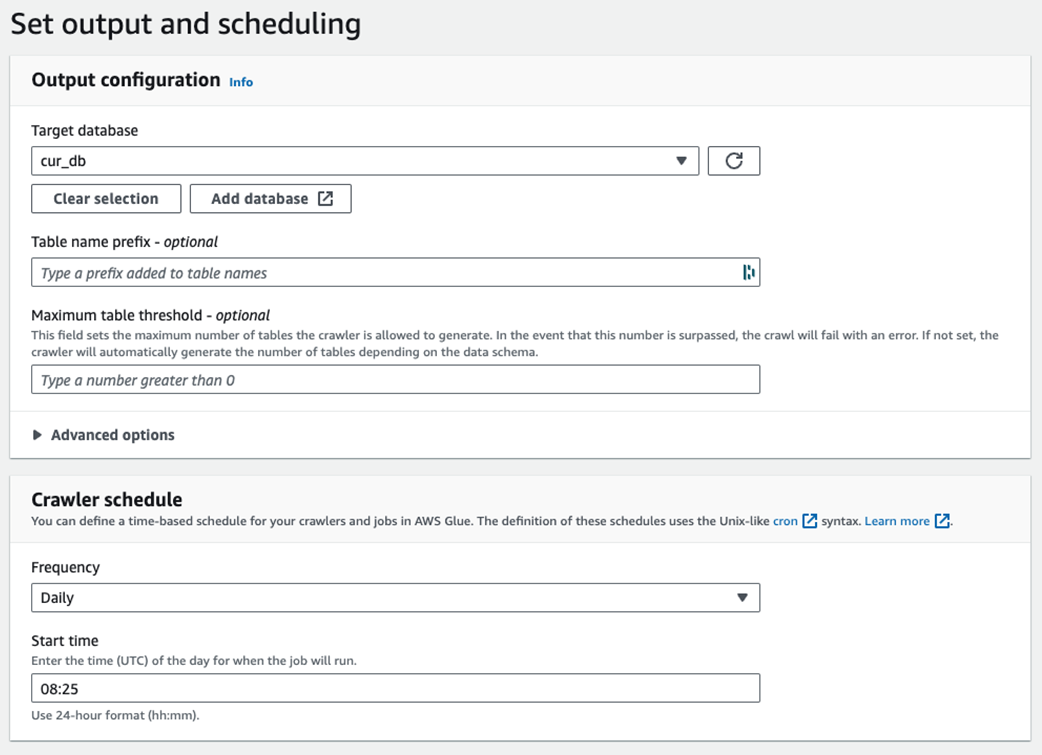
Triggering the crawler on a daily basis
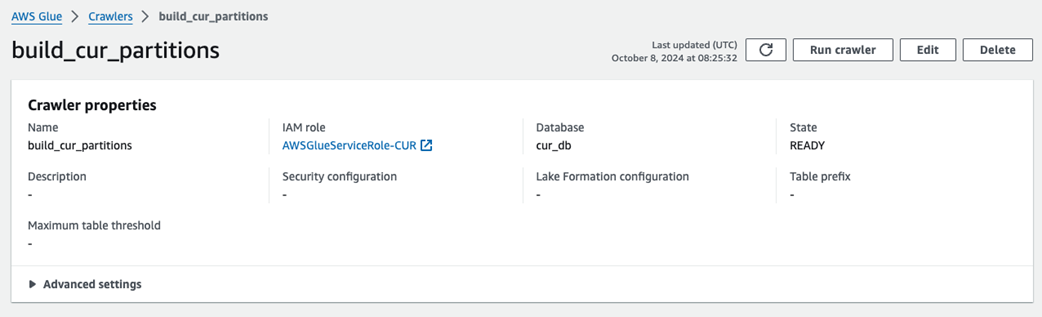
Start crawler manually
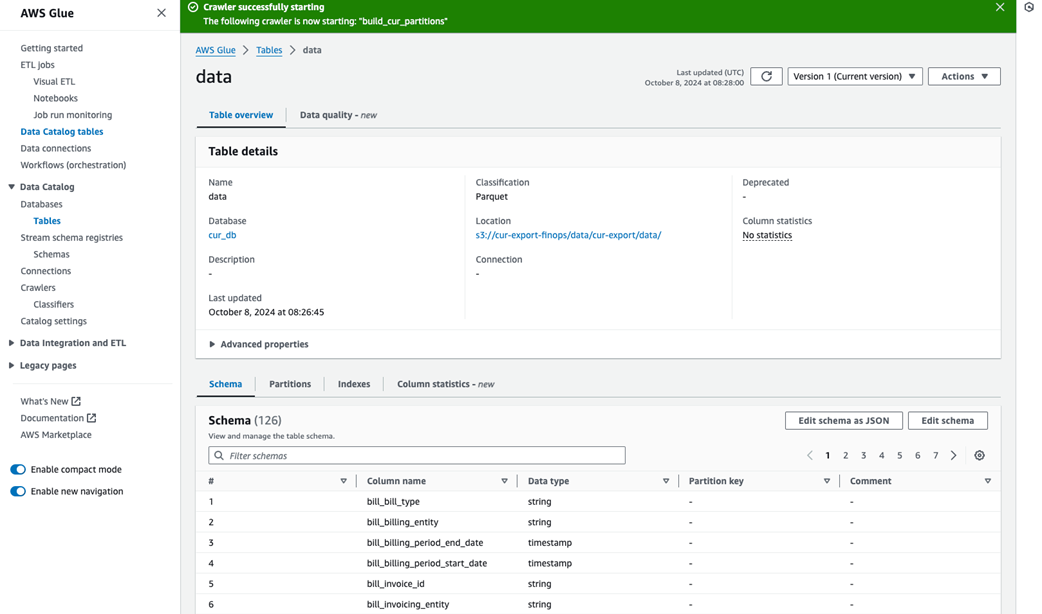
Discovering the table metadata
Number of rows in the exported table
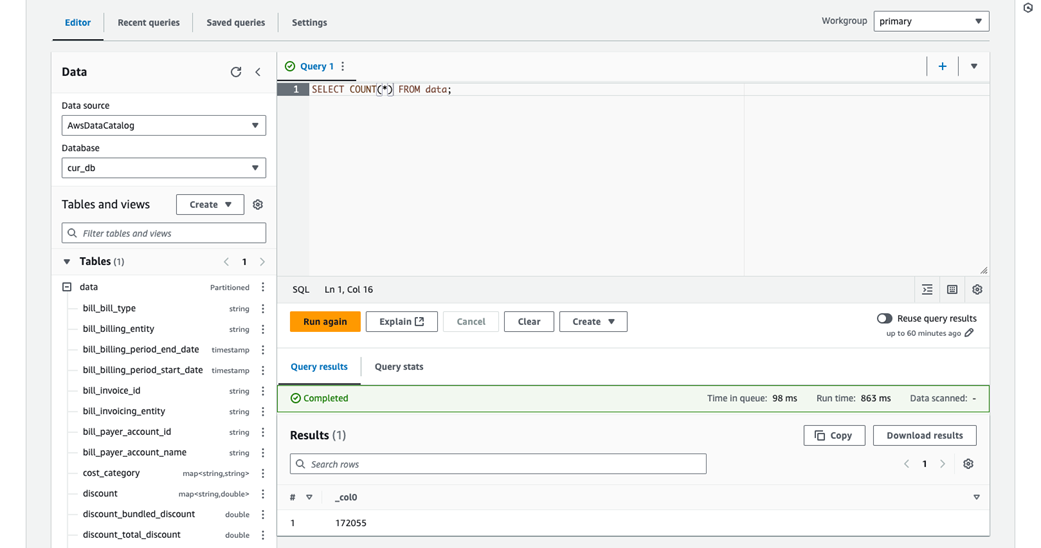
Output of the previous query
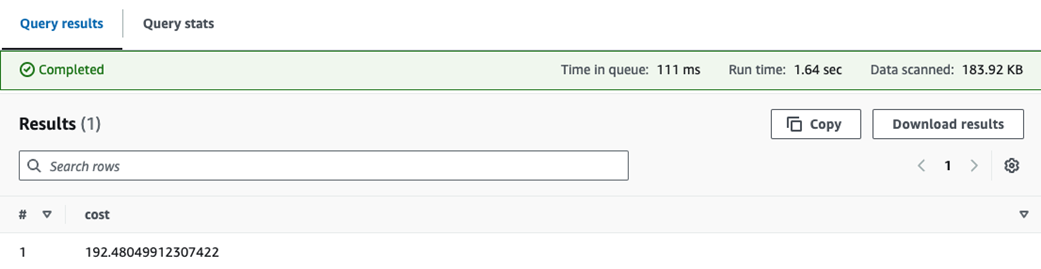
Output of the previous SQL query
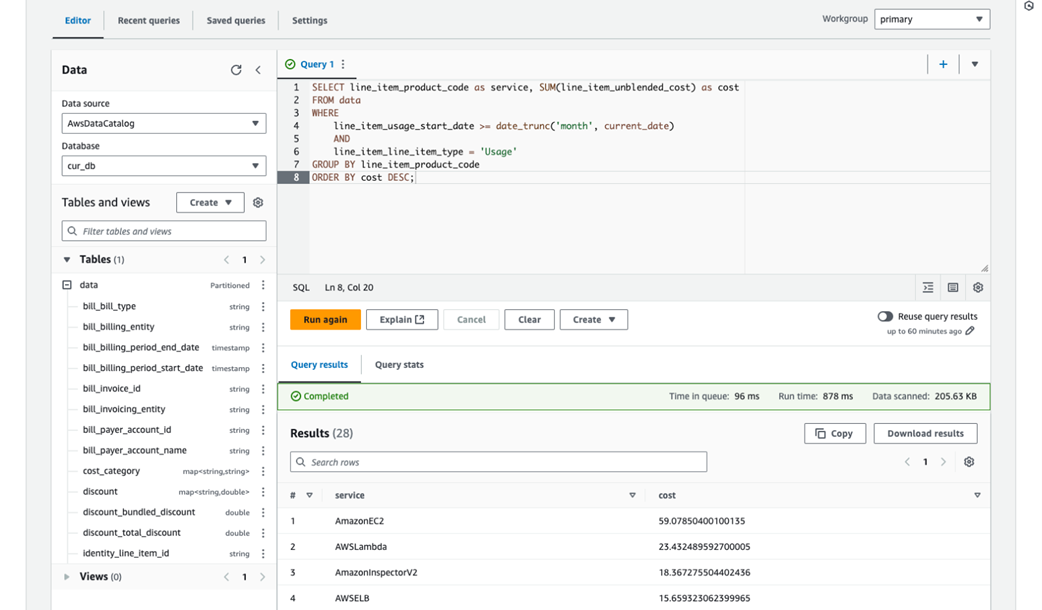
Output of the previous SQL query
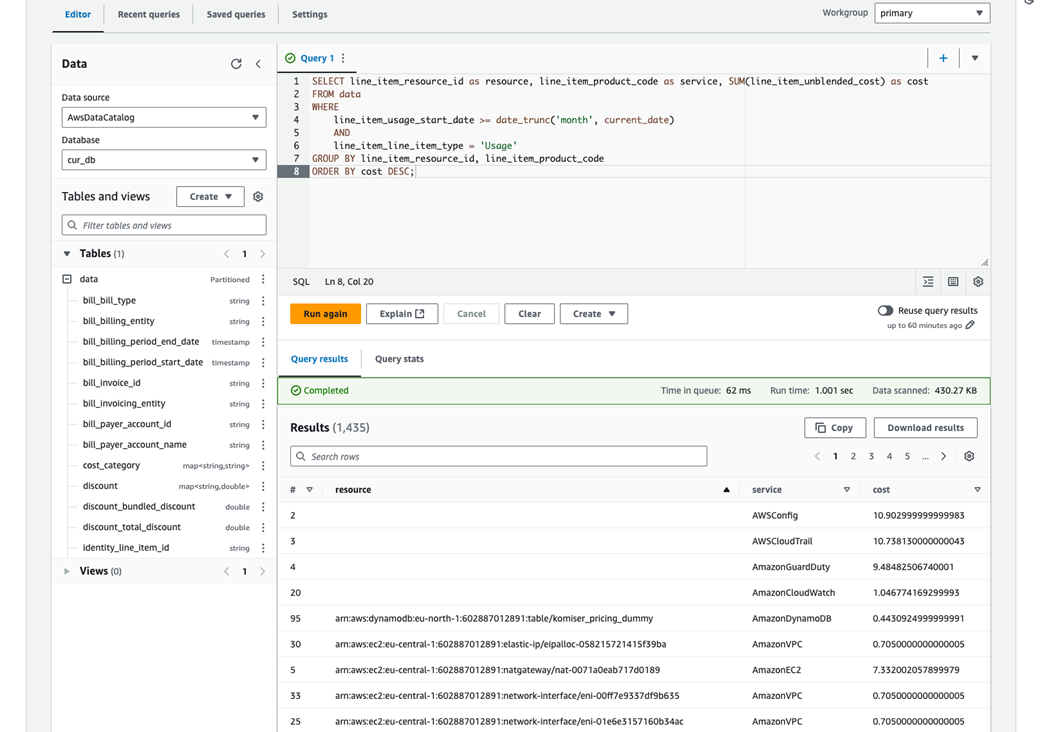
Output of the previous SQL query
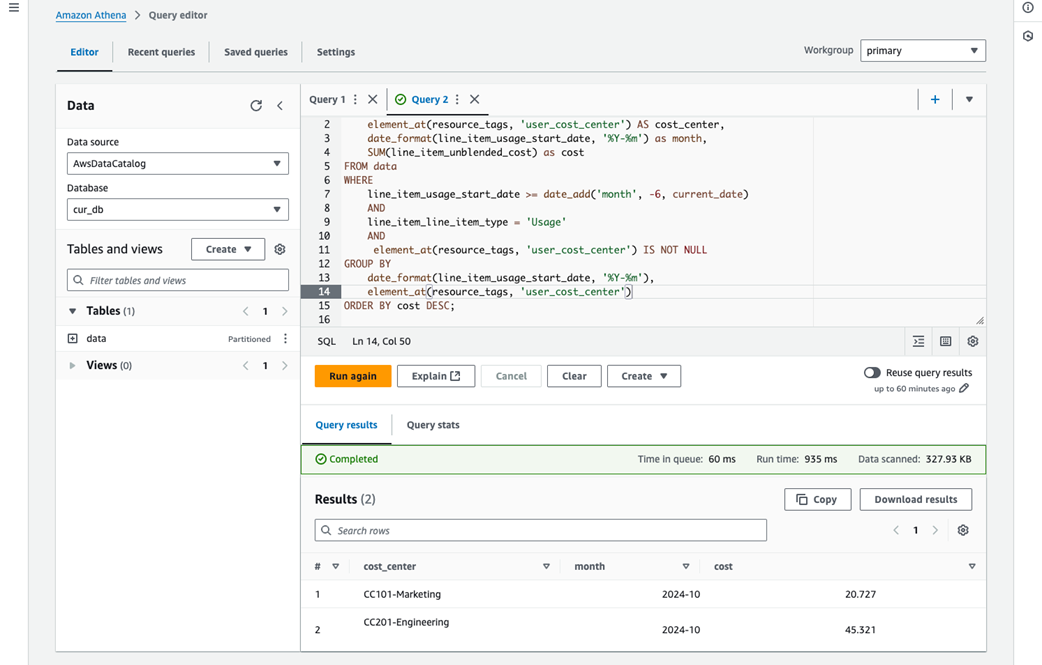
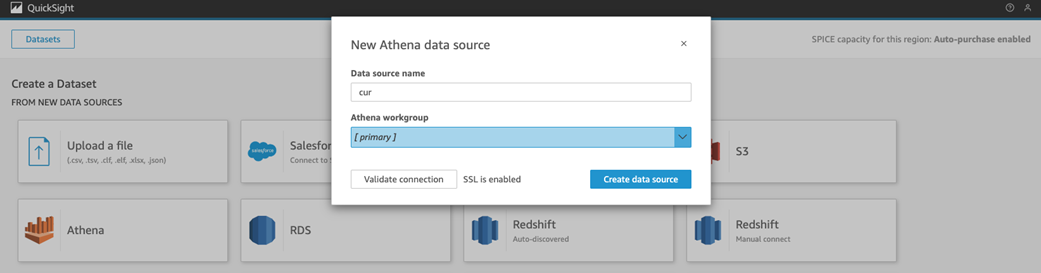
Setup Athena data source
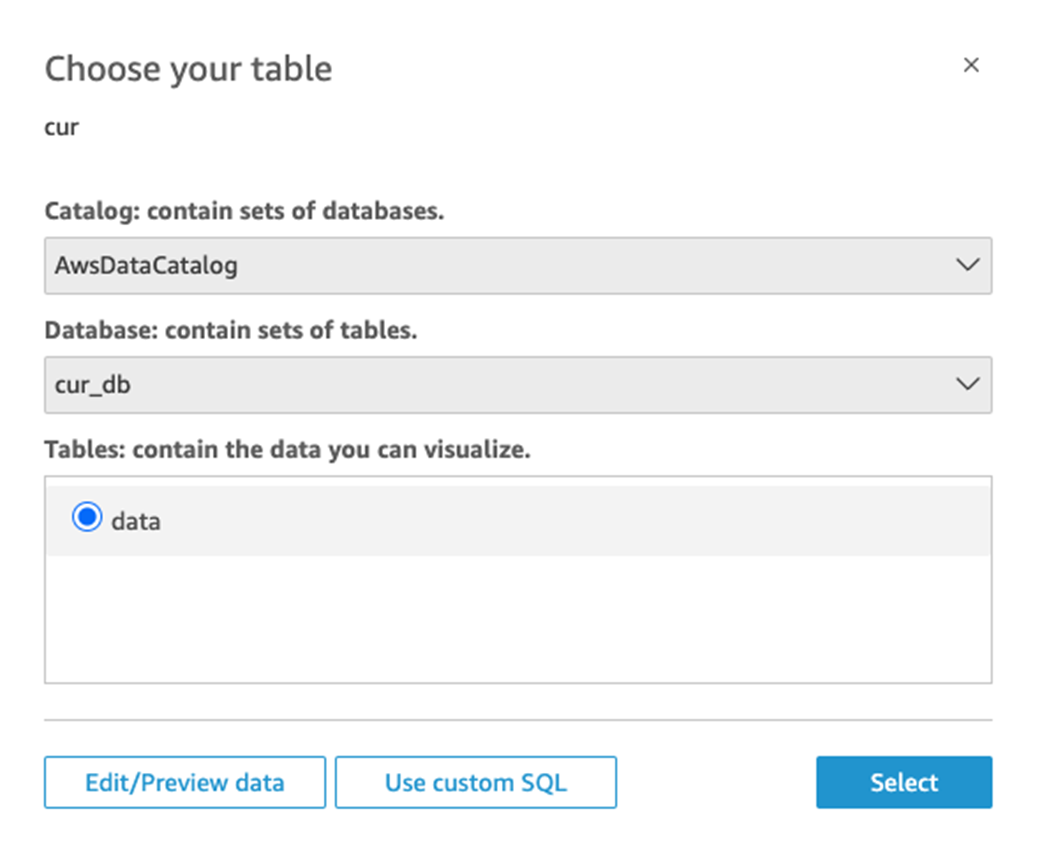
Select the CUR table
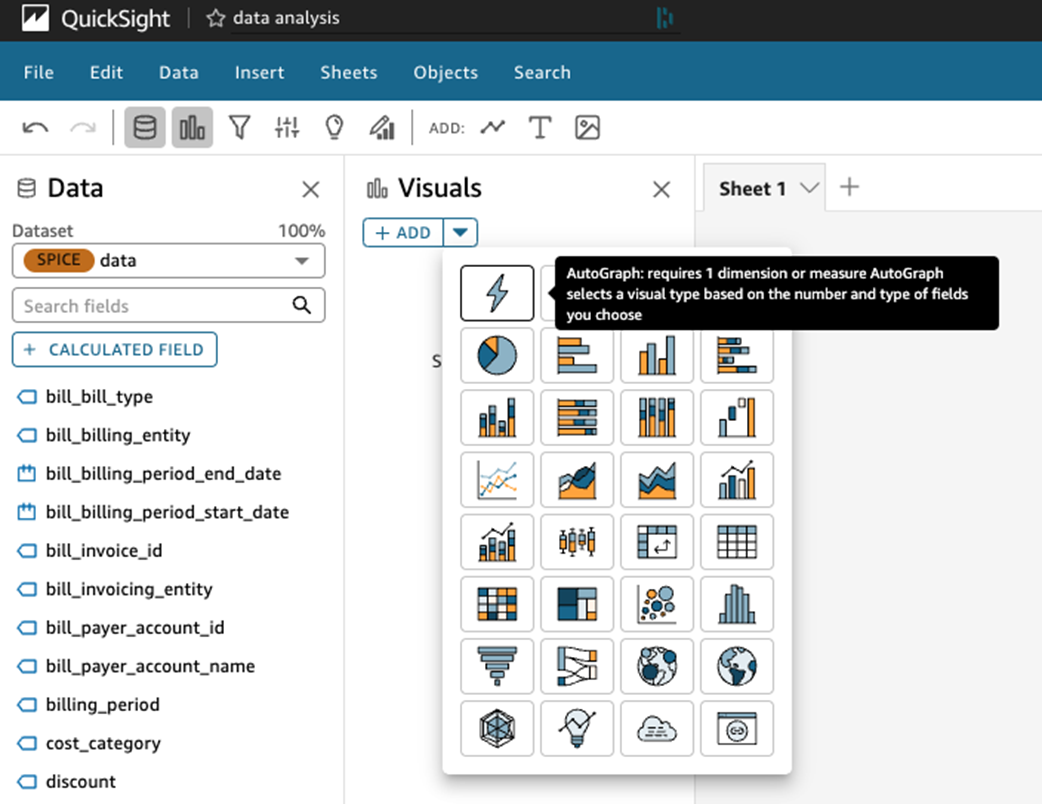
Creating a single stats widget
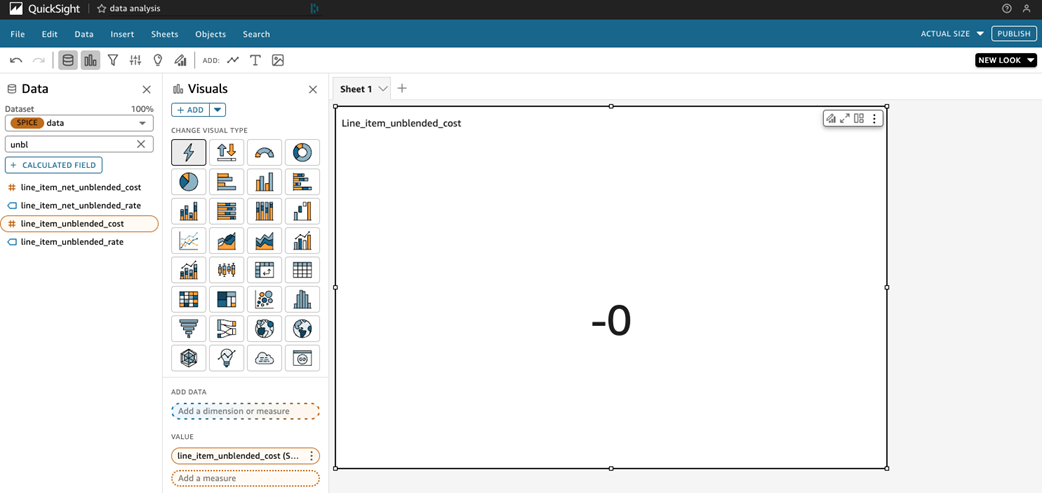
Tracking total unblended cost
Usage cost excluding credits and discounts
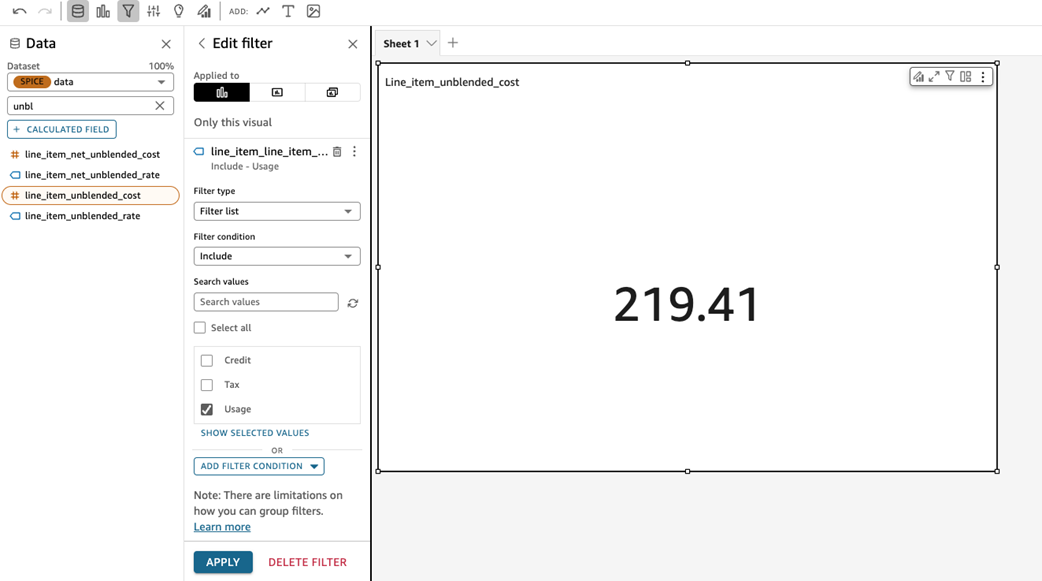
Customizing widget title and output prefix
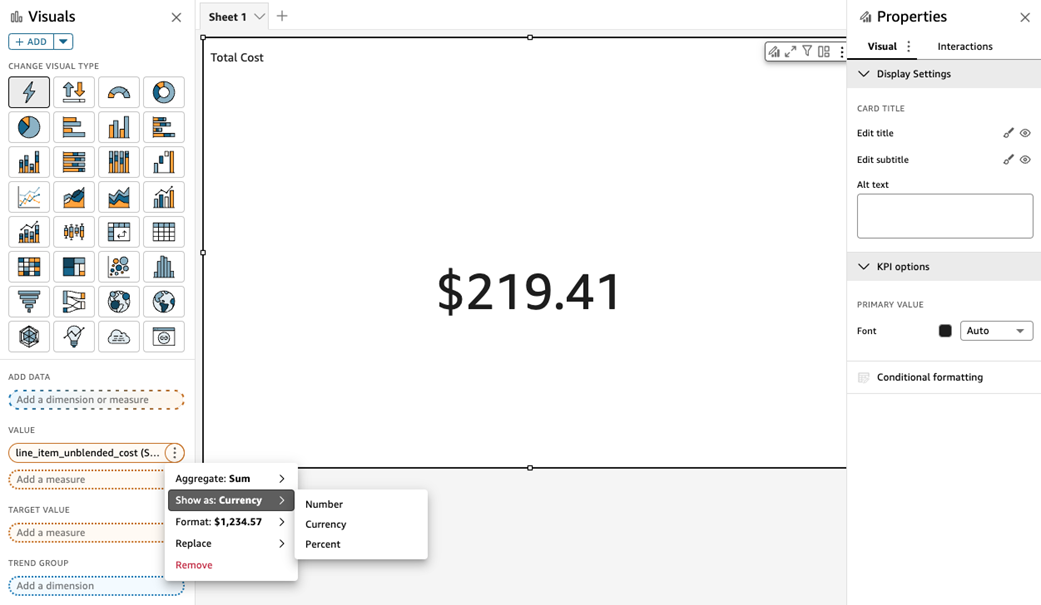
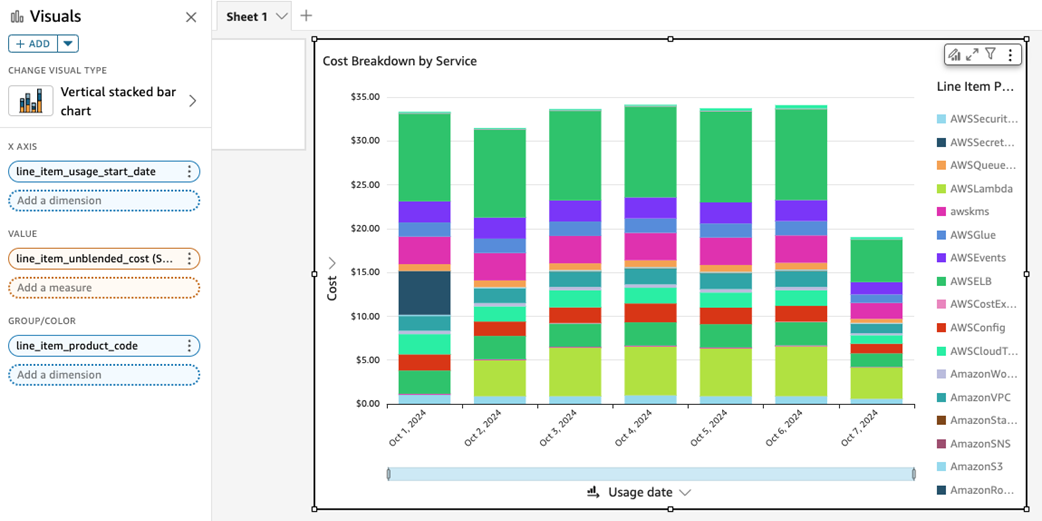
Tracking cost by service over time
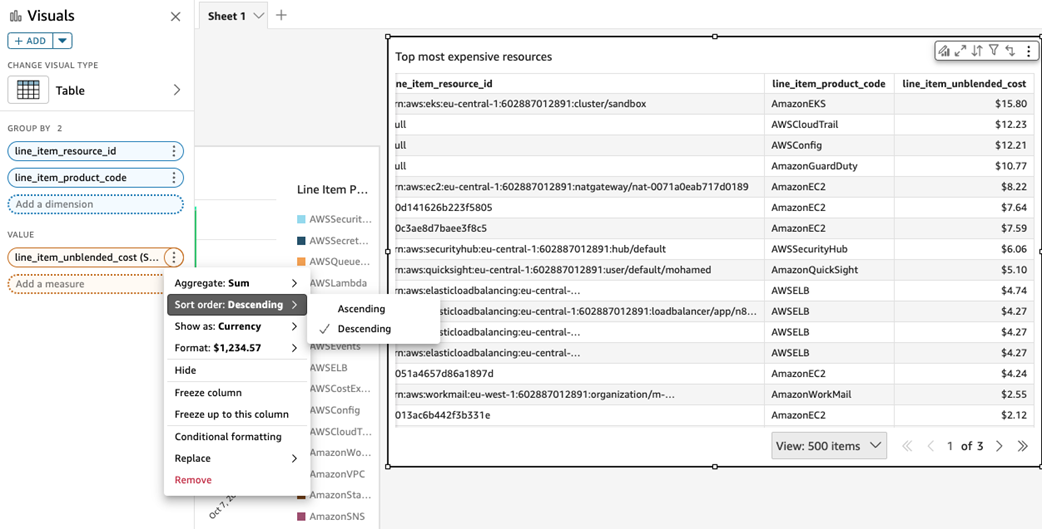
List of most expensive AWS resources
Tracking cost over time
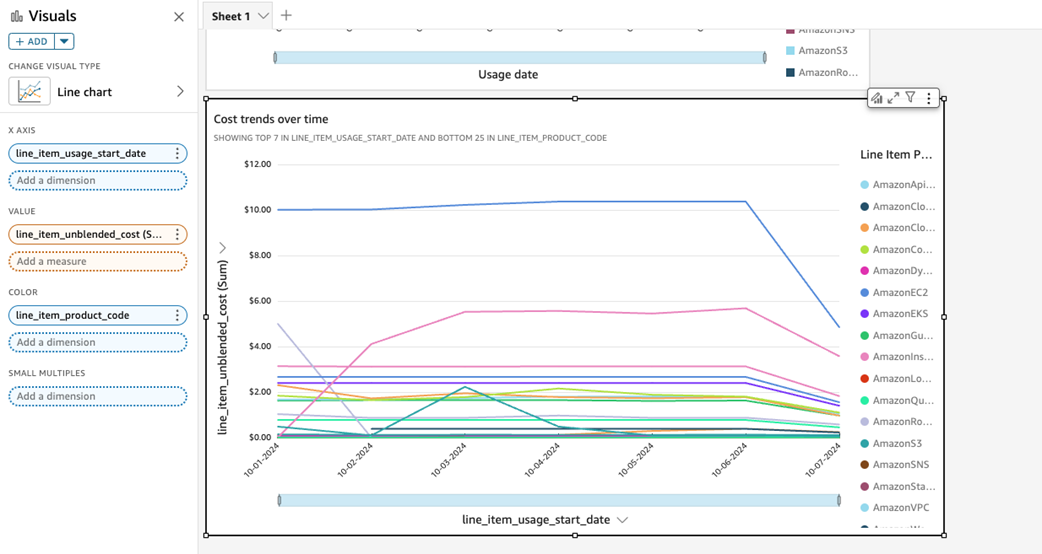
Breakdown of cost by cost center
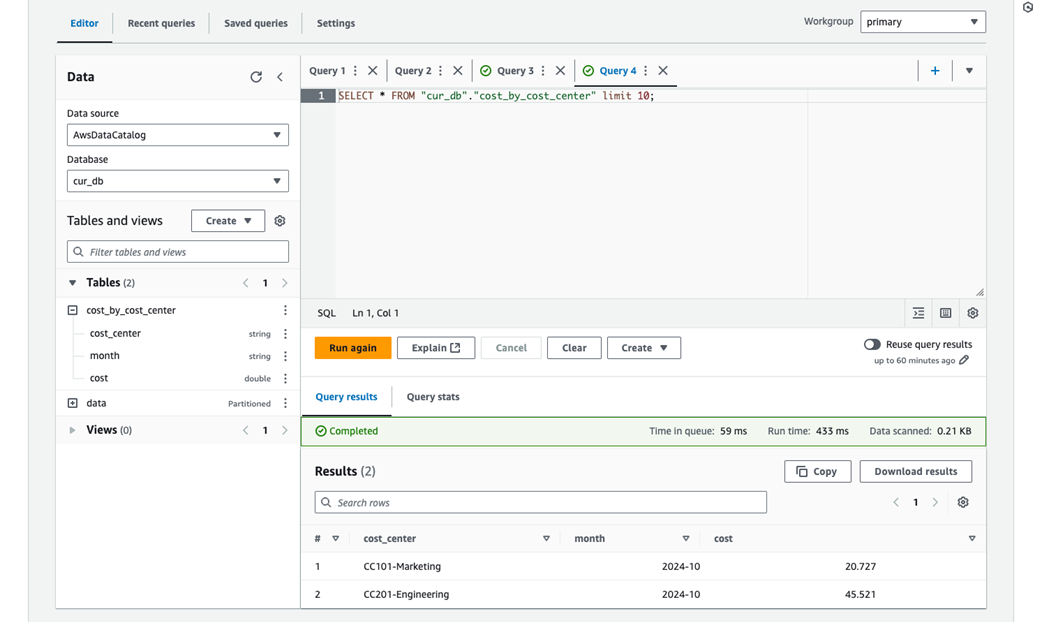
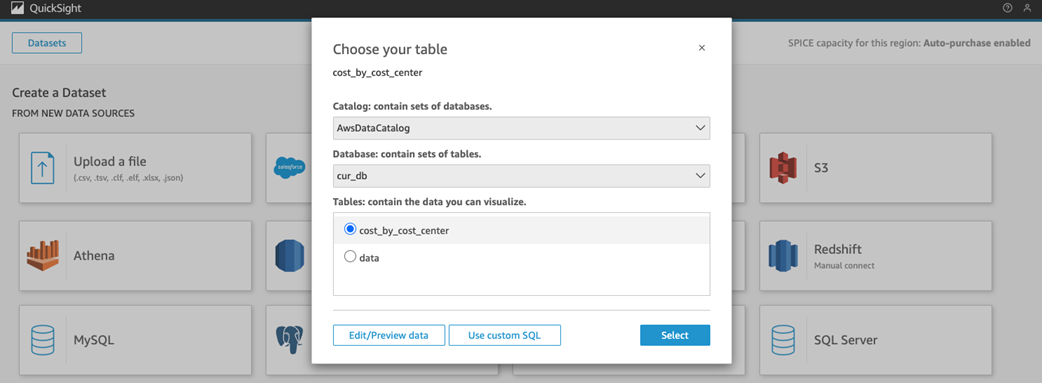
Connecting the new Athena table
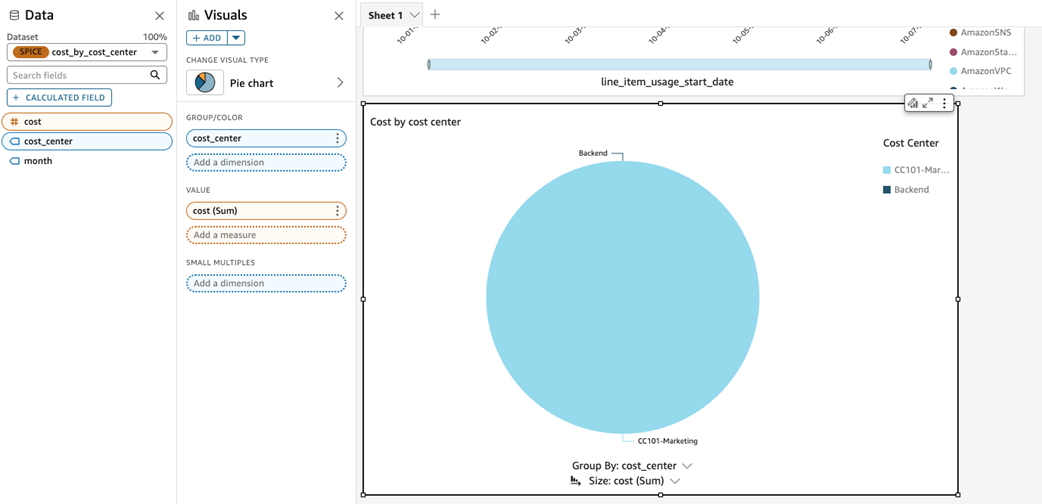
Tracking cost by cost center
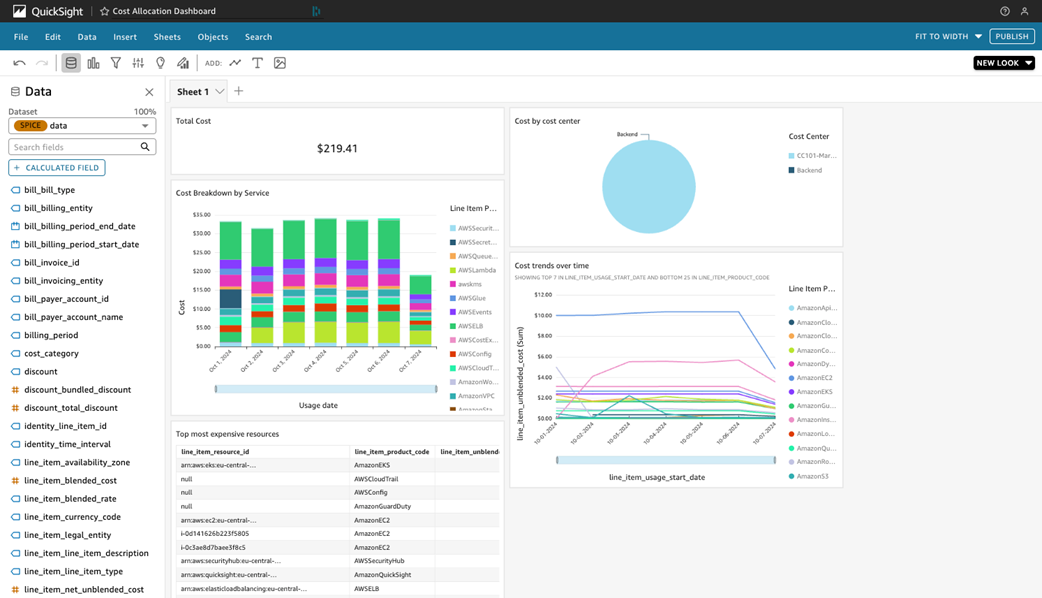
Your first FinOps dashboard
How to configure CUDOS
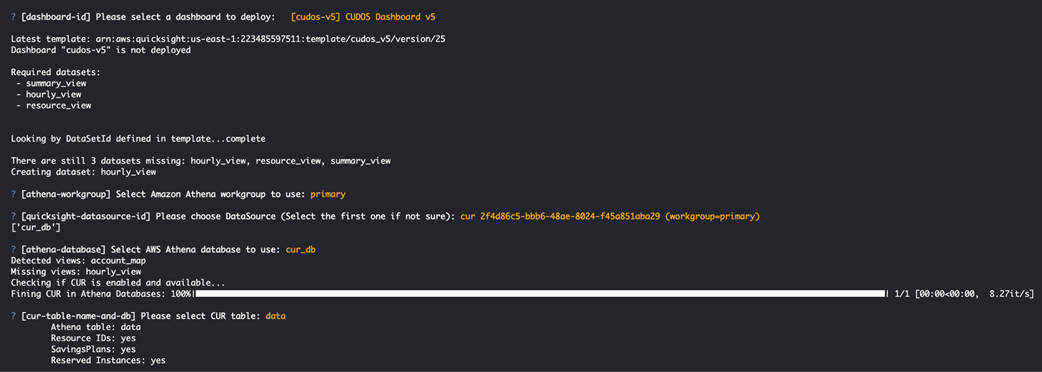
CUDOS Dashboard deployment status
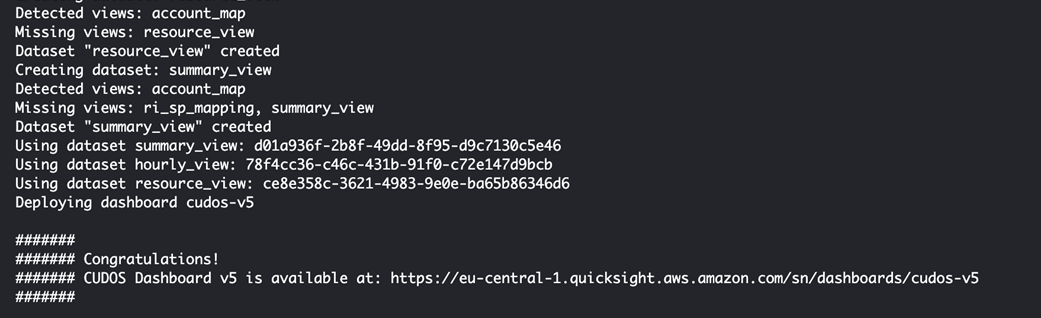
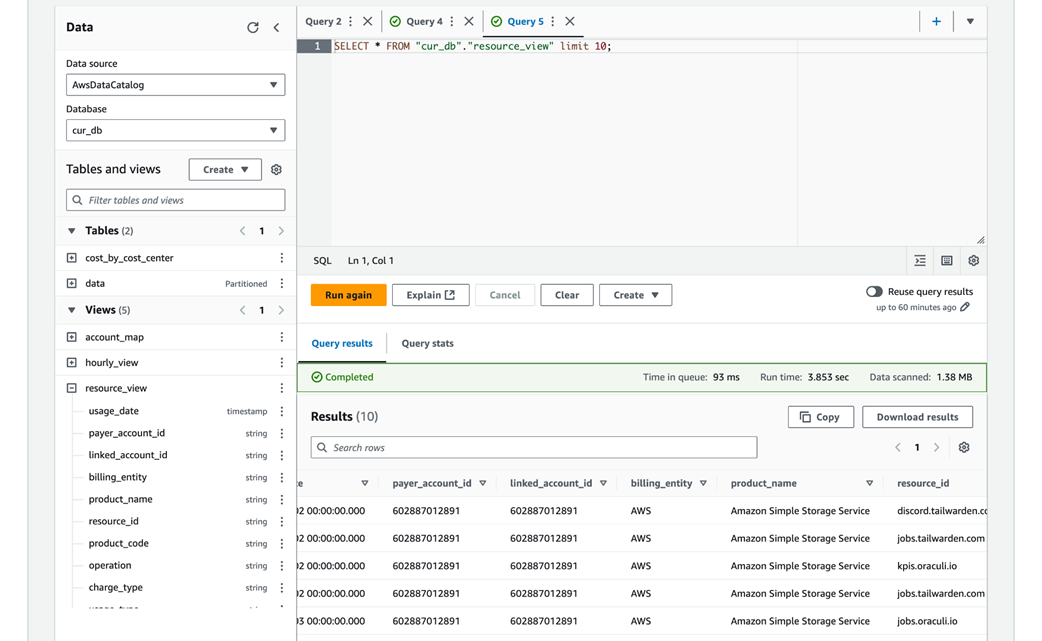
New views created by CUDOS CLI
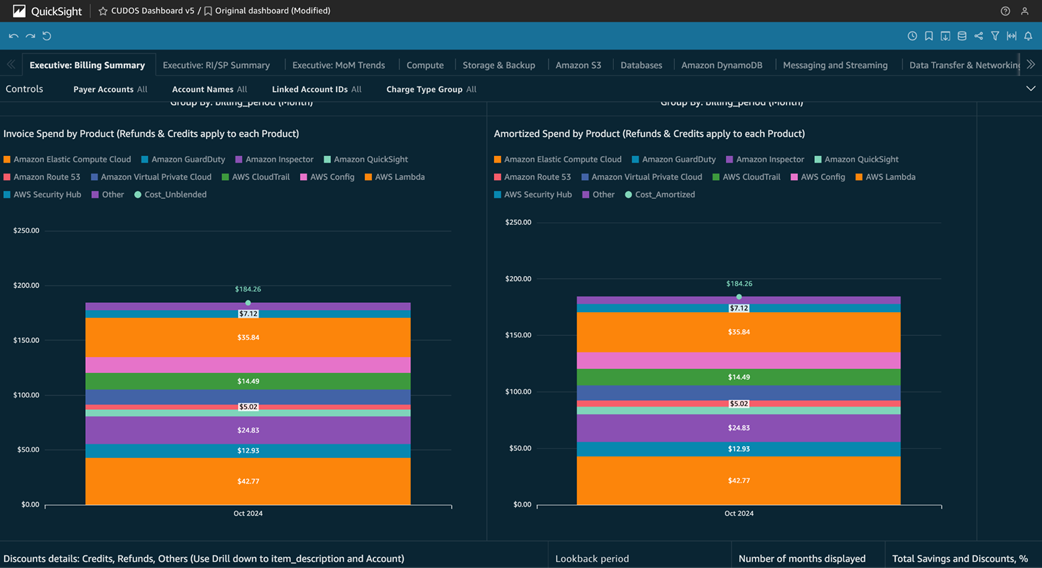
CUDOS main dashboard
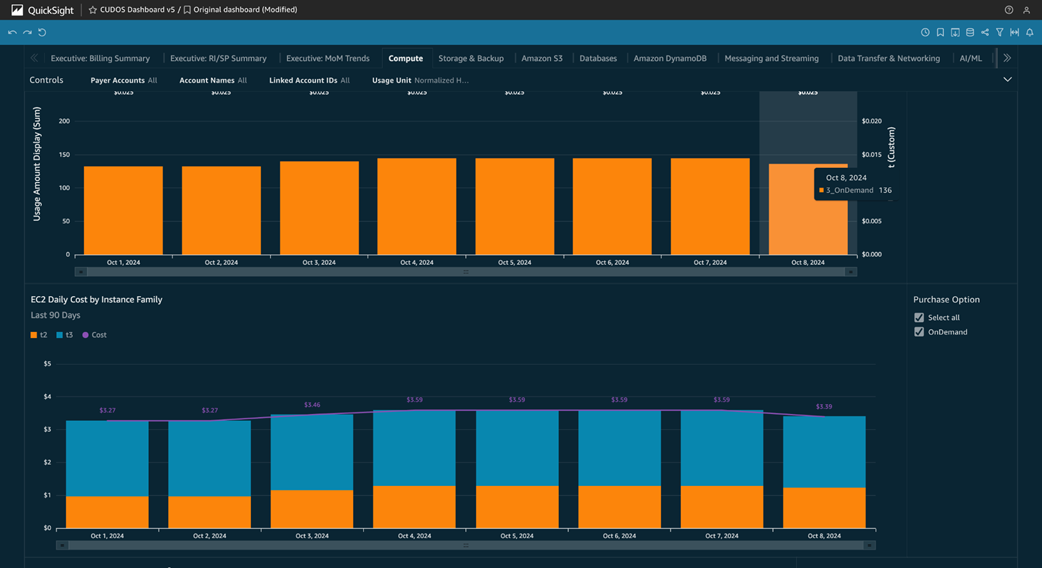
CUDOS compute tab
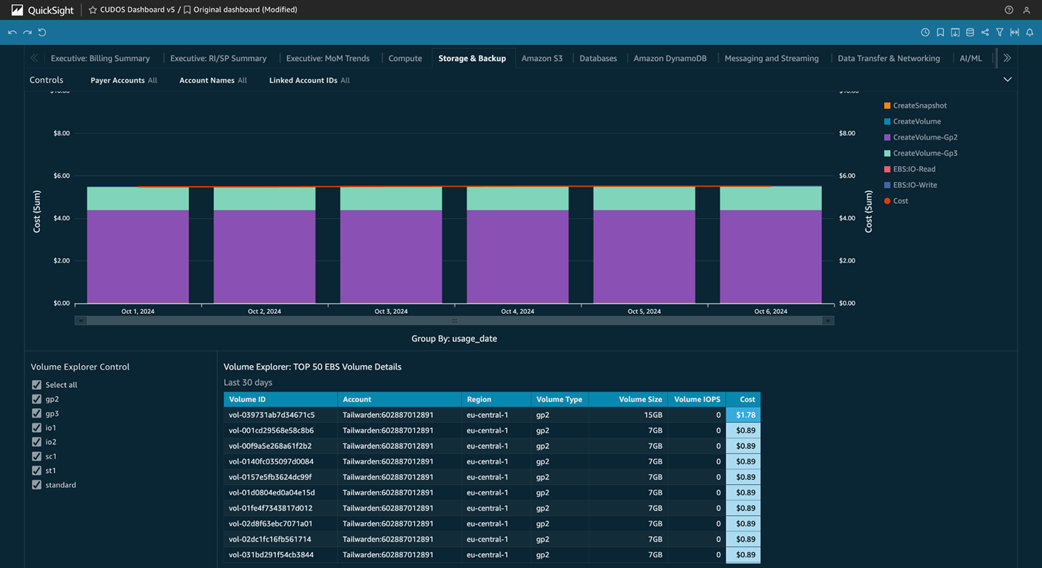
CUDOS storage tab
How FOCUS works

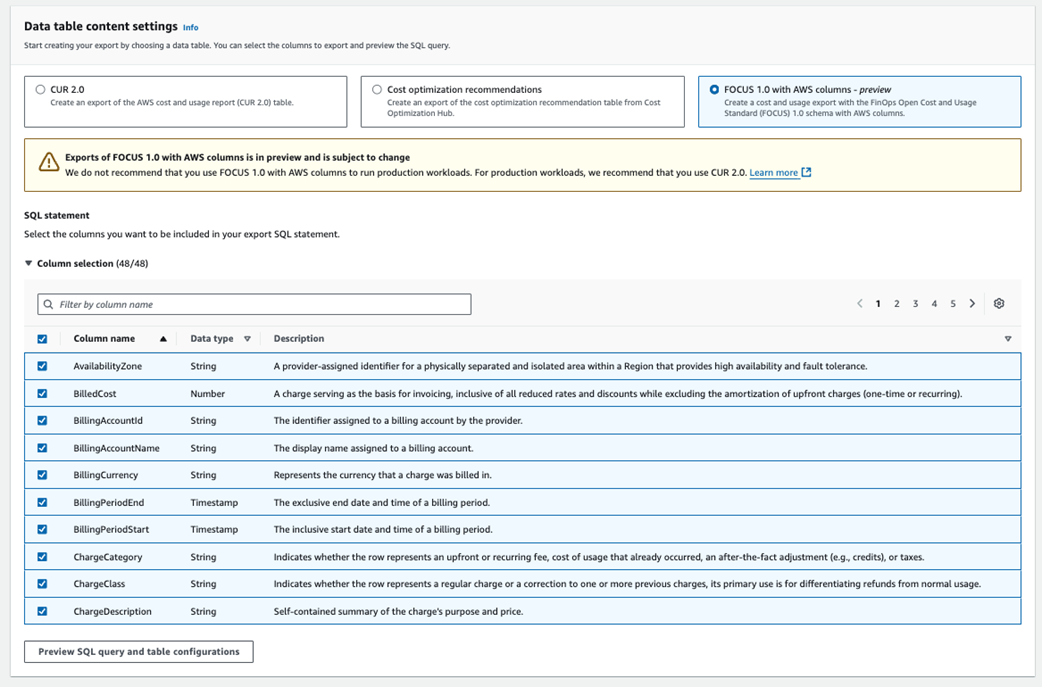
List of exported FOCUS columns
Summary
- Cost allocation is a critical component of FinOps, enabling organizations to accurately distribute and manage cloud costs across teams, projects, and departments.
- Different cost allocation models (direct, shared, and fixed) serve various organizational needs and resource usage patterns.
- AWS Cost Explorer is a powerful tool for analyzing cloud spending, offering filtering capabilities and custom report creation for detailed cost allocation.
- Integrating cost data with asset inventory and tagging strategies provides a comprehensive view of resource usage and associated costs.
- The AWS Cost and Usage Report (CUR) offers the most detailed and comprehensive cost and usage data, enabling advanced cost allocation techniques.
- Amazon Athena can be used to query CUR data efficiently using SQL, providing granular insights into cloud spending.
- Custom dashboards built with Amazon QuickSight allow for visual representation of cost allocation data, enhancing understanding and decision-making.
- GCP provides tools like Billing Reports and BigQuery export for cost monitoring and analysis, while Azure offers Cost Management + Billing and Cost Analysis features.
- FOCUS (FinOps Open Cost & Usage Specification) aims to standardize cloud cost and usage data across different providers, facilitating better multi-cloud cost management.
FAQ
What cost allocation models does this chapter cover, and when should I use each one?
It covers three models: - Direct allocation: Use when a resource maps cleanly to a single team/app (e.g., tagged EC2 for one project). - Shared allocation: Use for shared services (e.g., RDS, networking) where costs are split by actual consumption (chargeback) or only reported (showback). - Fixed allocation: Use when precise usage signals are unavailable or for budget stability; assign preset percentages to teams.What’s the difference between chargeback and showback for shared costs?
- Chargeback: Bills teams their proportional share based on measured usage (impacts budgets). Drives accountability and behavior change quickly.- Showback: Reports usage and implied cost without billing (no budget impact). Use to build transparency and culture before moving to chargeback.
How do I use AWS Cost Explorer to allocate costs by tags (Project, CostCenter, etc.)?
- Activate and enforce business tags (for example, Project, CostCenter).- In Cost Explorer, filter by Tags, pick the tag key and value, then group by dimensions (service, region, usage type) to see breakdowns.
- Save views as reports per team/project to track trends and share accountability.
How do I set up the AWS Cost and Usage Report (CUR) and which fields matter for allocation?
Setup: - In Billing → Data Exports, create a CUR 2.0 export, include resource IDs, select hourly granularity, Parquet format, and deliver to S3. It may take up to 24 hours for the first files. Key fields (CUR 2.0): - line_item_resource_id: Resource-level attribution. - line_item_unblended_cost: Raw, undiscounted unit cost. - product_service_code: Service (e.g., AmazonEC2). - resource_tags: Tag map for business grouping (e.g., user_cost_center). - line_item_usage_start_date/end_date: Time windows for slicing and trending.How can I query CUR with Amazon Athena to find top services, top resources, and cost by tag?
Process: - Use AWS Glue Crawler on the CUR S3 path to create a table in the Glue Data Catalog. - In Athena, run SQL such as: - Total monthly cost (usage only): SUM(line_item_unblended_cost) WHERE line_item_line_item_type = 'Usage' AND date in current month. - Cost by service: GROUP BY line_item_product_code ORDER BY cost DESC. - Cost by resource: GROUP BY line_item_resource_id, line_item_product_code. - Cost by CostCenter tag: extract element_at(resource_tags, 'user_cost_center'), group by month and tag.How do I build a FinOps dashboard with Amazon QuickSight on top of CUR/Athena?
- Connect QuickSight to Athena; select the CUR database/table (or saved Athena views).- Start with visuals like: - Single stat: total SUM(line_item_unblended_cost) filtered to Usage to exclude credits/adjustments. - Stacked bars or lines: costs over time by product_service_code. - Table: top N resources by line_item_resource_id and cost.
- Add CostCenter visual using a pre-aggregated Athena table/view, then publish and share the dashboard.
How do I integrate cost data with my asset inventory and tagging strategy?
- Standardize tags that map assets to owners and purposes (Project, CostCenter, Environment, and a ResourceId tag). - Enable chosen tags as cost allocation tags in Billing and backfill where needed. - Use the Cost Explorer API/SDK to pull costs by ResourceId and join with your asset inventory (for example, export EC2 instance metadata with monthly cost to CSV/DB). - Repeat for other services and centralize in your CMDB/data warehouse.What do Unblended, Blended, and Amortized costs mean in AWS, and which is best for allocation?
- Unblended: Exact line-item prices (per account), best for precise allocation and showback/chargeback. - Blended: Average rates across linked accounts; simplifies billing but hides detail—avoid for granular allocation. - Amortized: Spreads RI/Savings Plans upfronts over time; useful for budgeting/forecasting and fair-share allocation of commitments.What are AWS Cloud Intelligence Dashboards (CUDOS) and how can they accelerate FinOps?
CUDOS is an open-source set of QuickSight dashboards backed by Athena views that surface cost, usage, and optimization insights (compute, storage, networking, and more). Deploy with the CID CLI, point it to your CUR-backed Athena database, and get curated visuals and KPIs without building from scratch.What is FOCUS and why does it matter for multi-cloud cost allocation?
FOCUS (FinOps Open Cost & Usage Specification) standardizes cost-and-usage data across clouds. Benefits: - Consistent schema across AWS/GCP/Azure. - Easier tool integration and reduced vendor lock‑in. - Simpler multi-cloud reporting and benchmarking.Get started by exporting provider data in FOCUS-compatible form and building dashboards/views that adopt FOCUS fields (for example, billingAccountId, serviceName, resourceId, billedCost, tags).