Overview

8 Advanced Data Preparation

This chapter shifts from modeling on clean data to the realities of preparing messy, high-dimensional, real-world data for machine learning. It centers on vtreat, an R package that automates principled data preparation: handling missing values, outliers, categorical variables (including rare and novel levels), high-cardinality features, redundancy, and the risks of overfitting when variables are numerous. The authors motivate the workflow with a customer-churn task from the KDD Cup 2009 data, and stress sound data-splitting strategies and cross-validated preparation to avoid “nested model bias,” where information from the outcome leaks into feature construction and inflates apparent performance.

The vtreat workflow has two phases: design and application. In design, vtreat learns a treatment plan that captures safe, informative recodings of each variable; in application, it transforms any dataset into an all-numeric, no-missing-values frame. It produces derived variables such as cleaned numerics, “isBAD” indicators for missingness, one-hot level indicators for common categories, impact-coded summaries (single numeric encodings of a category’s relationship to the outcome), and prevalence measures. A “score frame” reports per-variable utility and complexity, guiding variable selection. For small or complex problems, vtreat’s cross-frame experiments generate cross-validated training features, aligning in-sample estimates with out-of-sample behavior. The chapter demonstrates building and evaluating a churn model (AUC-based assessment, thresholding for lift/recall trade-offs) and shows how the same ideas apply to regression.

To help readers “master” vtreat, the chapter walks through the core mechanics: treating missingness by adding indicators, explicit one-hot encoding, impact coding with smoothing to stabilize small-sample estimates, and disciplined prevention of outcome leakage via cross-frames or three-way splits. It discusses when to use designTreatments versus mkCrossFrame experiments, illustrates quick prototyping and data inspection habits, and flags ethical considerations around sensitive variables. An auto-mpg regression example reinforces that the approach generalizes beyond classification. The overarching takeaway is a robust, reproducible pipeline that converts messy data into modeling-ready features with realistic, cross-validated estimates of variable value, improving model reliability and downstream decision-making.

Figure 8.1. Mental model
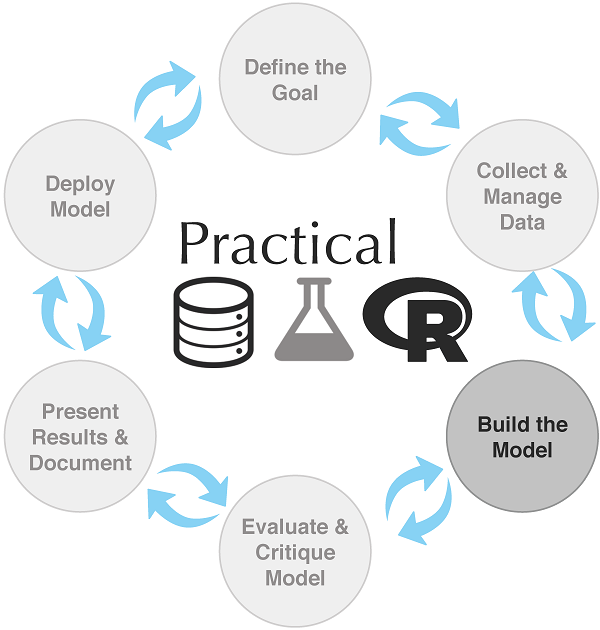
Mental model
Figure 8.2. vtreat 3-way split strategy
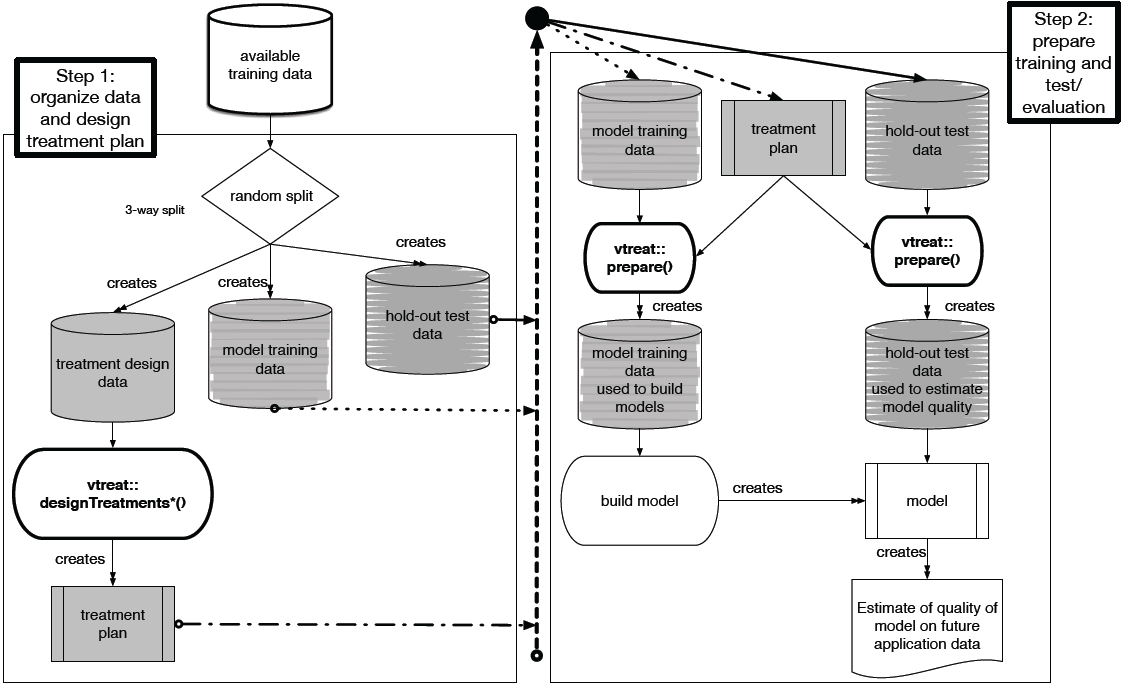
vtreat 3-way split strategy
Figure 8.3. KDD2009 Churn Rate
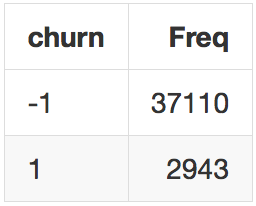
KDD2009 Churn Rate
Figure 8.4. vtreat variable preperation
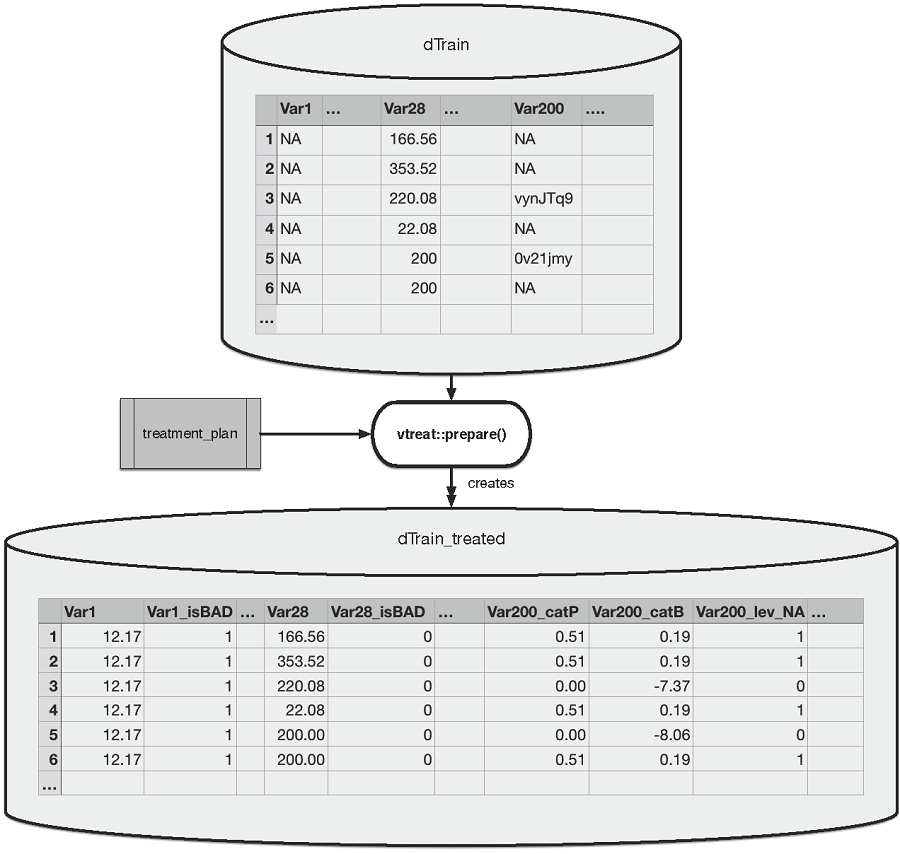
vtreat variable preperation
Figure 8.5. vtreat variable preperation
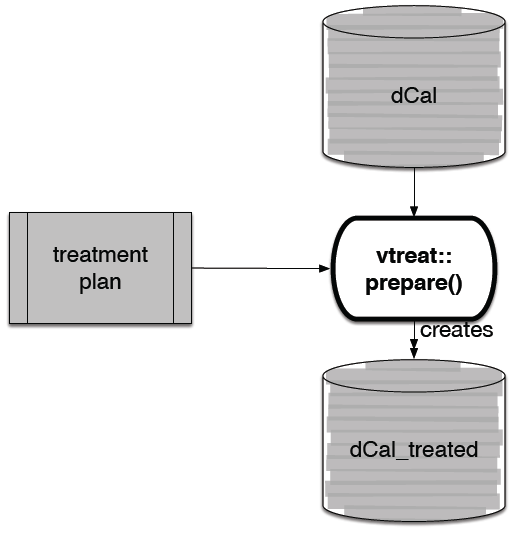
vtreat variable preperation
Figure 8.6. vtreat 3 way split strategy again
vtreat 3 way split strategy again
Figure 8.7. vtreat cross-frame strategy
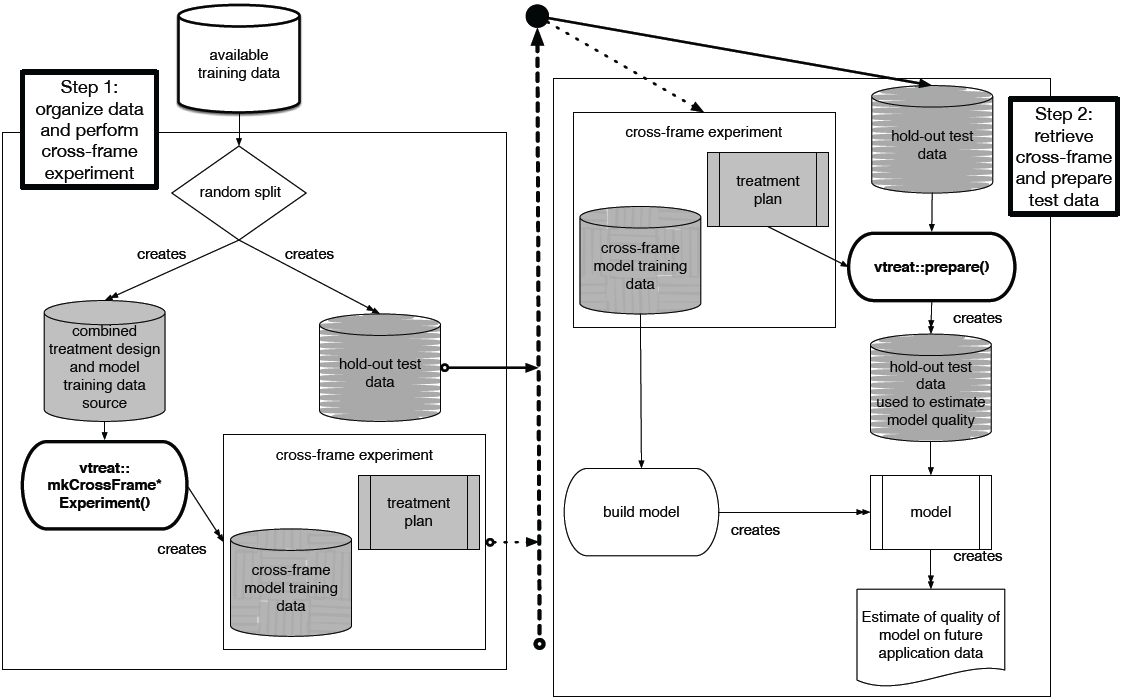
vtreat cross-frame strategy
Figure 8.8. Distribution of the glm model's scores on test data
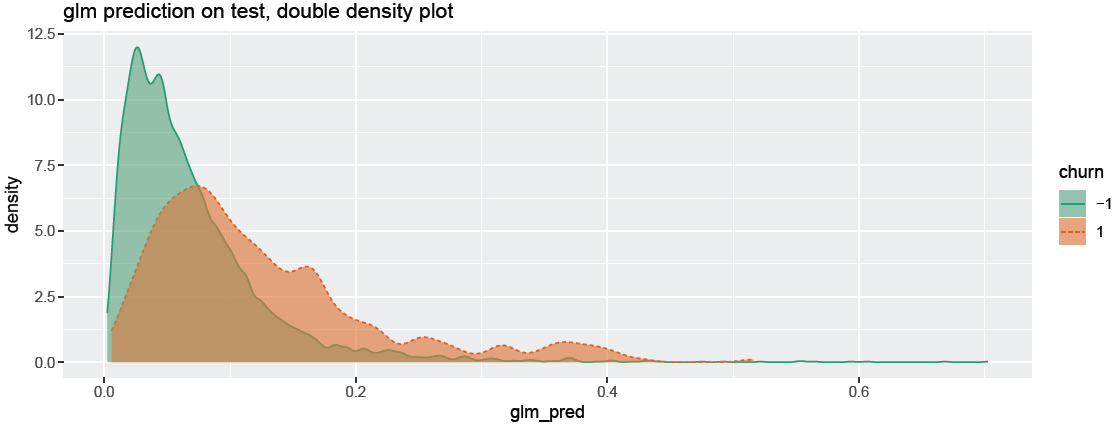
Distribution of the glm model's scores on test data
Figure 8.9. glm Recall and Enrichment as a Function of Threshold
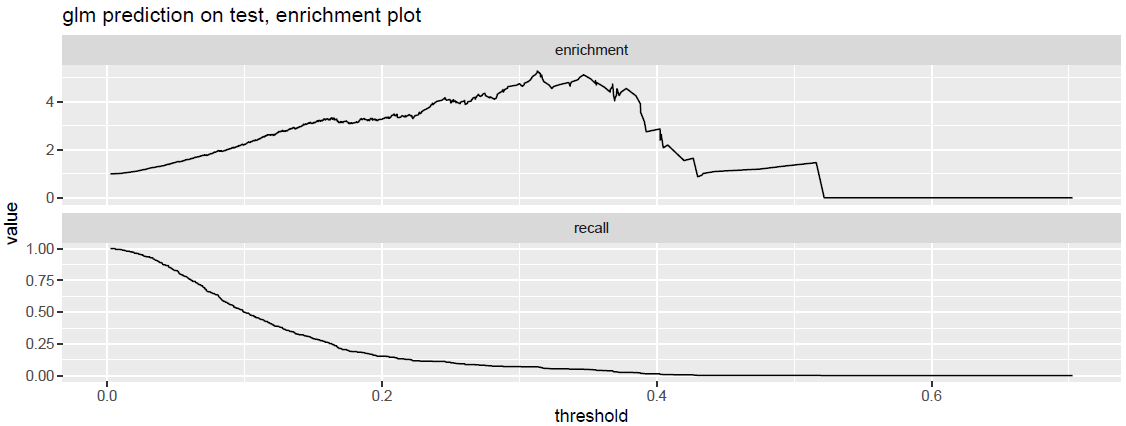
glm Recall and Enrichment as a Function of Threshold
Figure 8.10. The first few rows of the auto_mpg data
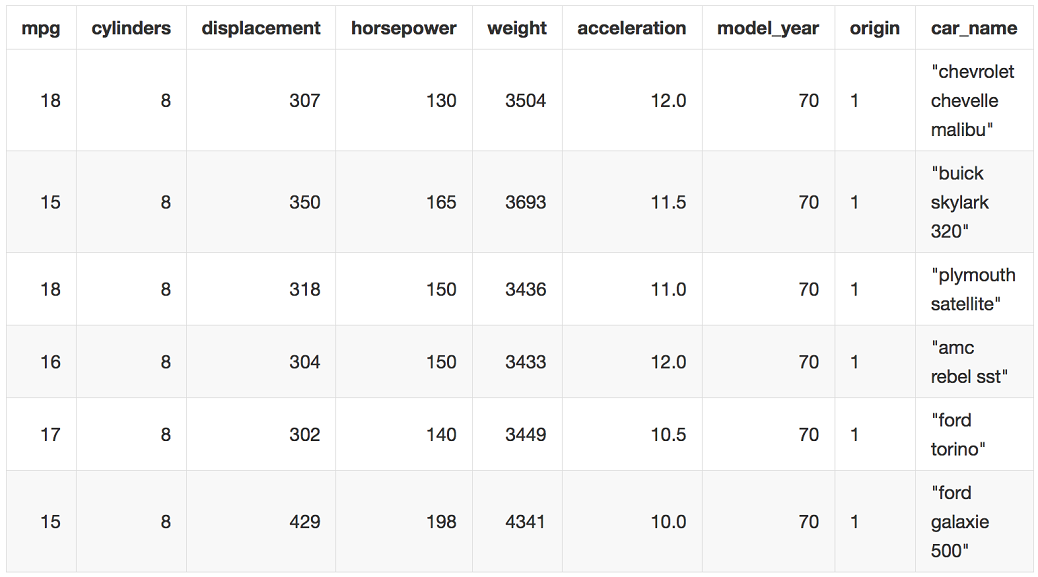
The first few rows of the auto_mpg data
Figure 8.11. The two vtreat phases
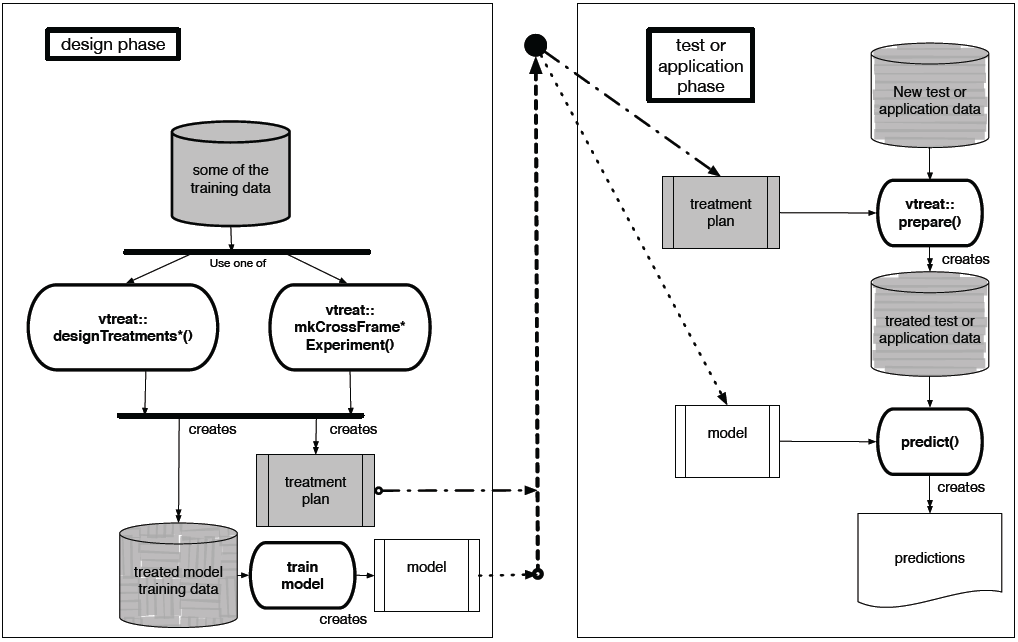
The two vtreat phases
Figure 8.12. Our simple example data: raw
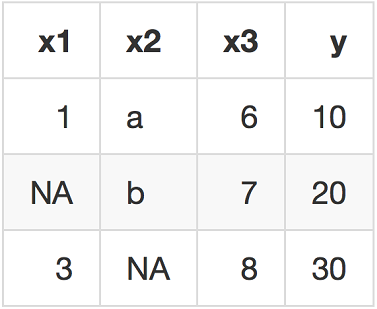
Our simple example data: raw
Figure 8.13. Our simple example data: treated
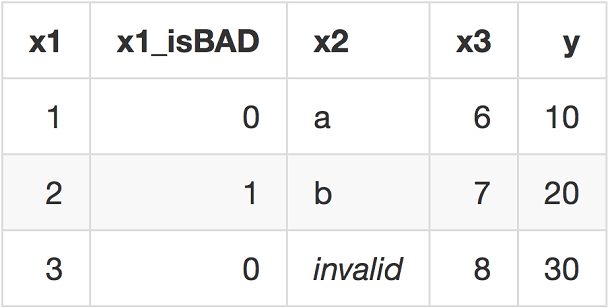
Our simple example data: treated

 Summary

Real-world data is often "messy." Raw un-inspected and un-treated data may crash your modeling or predicting step, or may give bad results. "Fixing" data of course does not compete with having better data. But being able to work with the data you have (instead of the data you want) is an advantage.

In addition to many domain-specific or problem-specific problems, you may find in your data, there are a number of common problems that should be anticipated and dealt with systematically. vtreat is a package specialized for preparing data for supervised machine learning or predictive modeling tasks. It can also reduce your project documentation requirements through its citable documentation. [70] However, remember that tools are not an excuse to avoid looking at your data.

In this chapter, you have learned:

  • How to use the vtreat package's designTreatments*()/prepare() pattern with a three-way split of your training data to prepare messy data for model fitting and model application.
  • How to use the vtreat package's mkCrossFrame*Experiment()/prepare() pattern with a two-way split of your training data to prepare messy data for model fitting and model application, when statistical efficiency is important.

FAQ

What is vtreat and why would I use it?vtreat is an R package that prepares messy, real-world data for supervised learning. It automates fixes for common issues such as missing values, extreme/out-of-range values, categorical variables (including many/rare/novel levels), redundant or non-varying variables, and risks of overfit due to many variables or nested model bias. The result is a safe, all-numeric data frame ready for modeling.
What is a “treatment plan” and how do I apply it?A treatment plan is an object learned from training data that records how to transform each original column into clean, modeling-ready variables. You create it with designTreatments* (for larger, split workflows) or mkCrossFrame*Experiment (for cross-validated training reuse), and apply it to any data set with prepare to get treated data with consistent structure and no missing values.
How does vtreat handle missing values?For numeric columns, vtreat imputes a stand-in (for example, a mean) and adds an isBAD indicator column that flags rows where imputation occurred. For categorical columns, missing values are mapped to a special level. This preserves information in “missingness,” which is often predictive in production data.
How does vtreat treat categorical variables, especially with many or rare levels?vtreat can: - Create level indicators (lev): one-hot columns for non-rare levels. - Create impact/target encodings (catB for classification, catN for regression): a single numeric column reflecting each level’s predictive impact. - Create prevalence encodings (catP): how frequently levels occur. By default, vtreat only one-hot encodes levels that occur more than about 2% of the time (configurable via minFraction). Rare and novel (previously unseen) levels are safely handled in impact/prevalence encodings to avoid scoring errors.
What is the “score frame” and how do I use it?The score frame (treatment_plan$scoreFrame) lists each derived variable with: - varName and origName - code (clean, isBAD, lev, catB, catP, etc.) - rsq (pseudo R-squared/utility) - sig (significance of that utility) - needsSplit and extraModelDegrees (complexity indicators) Use it to screen variables (for example, select those with small sig) and to understand which transforms were applied.
What is “nested model bias” and how do I avoid it?Nested model bias occurs when you both design outcome-aware transforms (like impact coding) and fit the final model on the same rows, inflating apparent performance. Avoid it by: - Using a three-way split: one part for treatment design, one for model training, and one for evaluation; or - Using vtreat’s cross-frame methods that simulate out-of-sample treatment for each training row.
When should I use designTreatments* + prepare versus mkCrossFrame*Experiment? - Large enough data: prefer a three-way split and designTreatments* for the treatment design, prepare for training and test sets. - Smaller data (or many variables): use mkCrossFrame*Experiment to get a crossFrame for model training (safe reuse of data) and use prepare only for test/application data.
How does variable selection work with vtreat?Two common options: - Use the score frame to filter by significance (for example, keep variables with sig <= k / number_of_variables to allow only about k false positives). - Use value_variables_C (or analogous) to better capture non-linear effects. Variable selection helps control overfit and noise, even for modern ML models.
How do I use vtreat for classification vs. regression? - Classification (binary): designTreatmentsC or mkCrossFrameCExperiment (requires specifying the outcome target). Impact codes are catB (log-odds scale). - Regression (numeric outcome): designTreatmentsN or mkCrossFrameNExperiment. Impact codes are catN (differences from mean). In both cases, prepare applies the learned plan to new data.
How should I evaluate and threshold models built on vtreat-treated data?For classification, AUC is a robust initial metric; vtreat examples also use permTestAUC to quantify uncertainty. For imbalanced problems (like churn), avoid a fixed 0.5 cutoff; instead pick thresholds that trade off recall and enrichment/lift based on business goals. Double-density plots and precision–recall/enrichment curves help choose operating points.

pro $24.99 per month

  • access to all Manning books, MEAPs, liveVideos, liveProjects, and audiobooks!
  • choose one free eBook per month to keep
  • exclusive 50% discount on all purchases
  • renews monthly, pause or cancel renewal anytime

lite $19.99 per month

  • access to all Manning books, including MEAPs!

team

5, 10 or 20 seats+ for your team - learn more


choose your plan

team

monthly
annual
$49.99
$499.99
only $41.67 per month
  • five seats for your team
  • access to all Manning books, MEAPs, liveVideos, liveProjects, and audiobooks!
  • choose another free product every time you renew
  • choose twelve free products per year
  • exclusive 50% discount on all purchases
  • renews monthly, pause or cancel renewal anytime
  • renews annually, pause or cancel renewal anytime
  • Practical Data Science with R, Second Edition ebook for free

choose your plan

team

monthly
annual
$49.99
$499.99
only $41.67 per month
  • five seats for your team
  • access to all Manning books, MEAPs, liveVideos, liveProjects, and audiobooks!
  • choose another free product every time you renew
  • choose twelve free products per year
  • exclusive 50% discount on all purchases
  • renews monthly, pause or cancel renewal anytime
  • renews annually, pause or cancel renewal anytime
  • Practical Data Science with R, Second Edition ebook for free