Overview

4 Managing data

This chapter emphasizes managing data rigorously between exploration and modeling so models are trained on valid, consistent, and informative inputs. It frames the workflow as: identify issues found during exploration, fix data quality problems, transform variables to make patterns easier to learn, and organize datasets for reliable modeling and validation. The overarching goal is to create “safe” data—free of surprises like missing or out-of-range values—and to preserve reproducibility so results can be trusted and repeated.

The chapter first tackles cleaning: invalid values are corrected using domain knowledge (e.g., recoding out-of-range entries, splitting mixed-code fields into explicit indicator variables), while missing values are handled in ways that respect both statistical assumptions and business semantics. Categorical NAs can be assigned an explicit “missing” level; numeric/logical NAs can be imputed (often by the mean), ideally alongside “missingness indicators” that let models learn whether the absence itself is informative. Because consistent treatment must be applied to both training and future data, automated tooling like vtreat is introduced to record treatment plans, add *_isBAD indicators, and reliably prepare new data. The chapter then covers key transformations that aid modeling: normalization (including conditional scaling against external baselines such as state medians), centering and scaling to comparable units across variables, and log transformations for skewed or wide-range quantities, with signed-log variants for data that include zeros or negatives. It also stresses retaining training-time parameters (means, scales, baselines) to keep future data on the same footing as the training data when appropriate.

Finally, the chapter organizes data for modeling and evaluation through careful sampling. It motivates representative, reproducible test/train splits and suggests storing a persistent random “group” mark to repeatedly draw the same samples during development and regression testing. It shows how to respect record groupings (such as households) so related rows are kept together across splits, and discusses when a calibration set is useful. The chapter closes by encouraging the capture of data provenance—source, collection date, and treatment version—so teams can track lineage, compare results fairly, and reliably re-treat or refresh datasets as processes evolve.

Figure 4.1. Chapter 4 Mental Model
Chapter 4 Mental Model
Figure 4.2. Even a few missing values can lose all your data
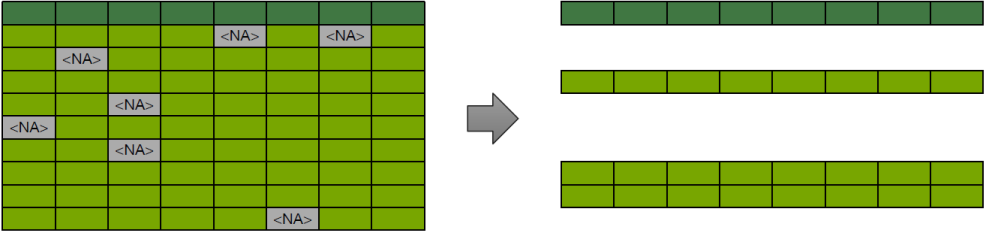
Even a few missing values can lose all your data
Figure 4.3. Creating a new level for missing categorical values
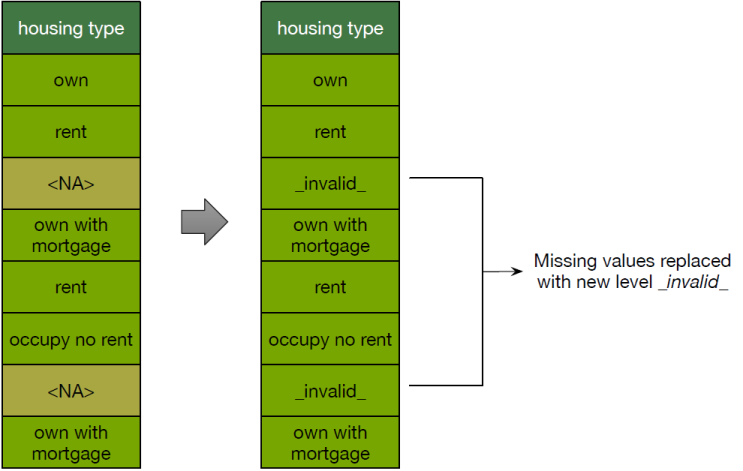
Creating a new level for missing categorical values
Figure 4.4. Income data with missing values
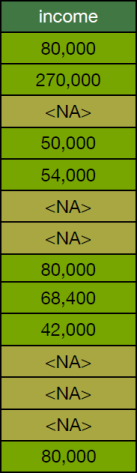
Income data with missing values
Figure 4.5. Replacing missing values with the mean
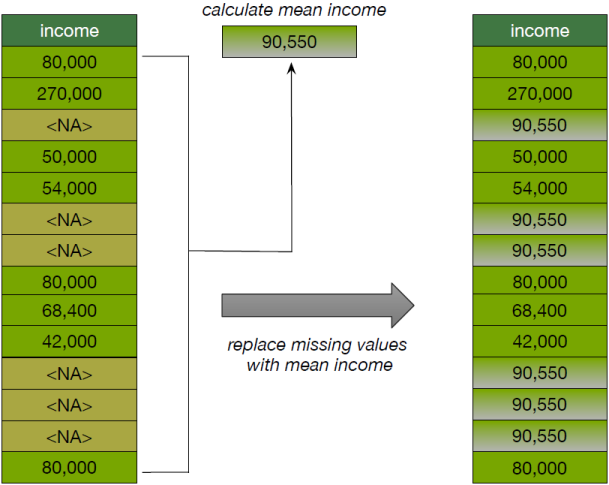
Replacing missing values with the mean
Figure 4.6. Replace missing values with the mean and add an indicator column to track altered values
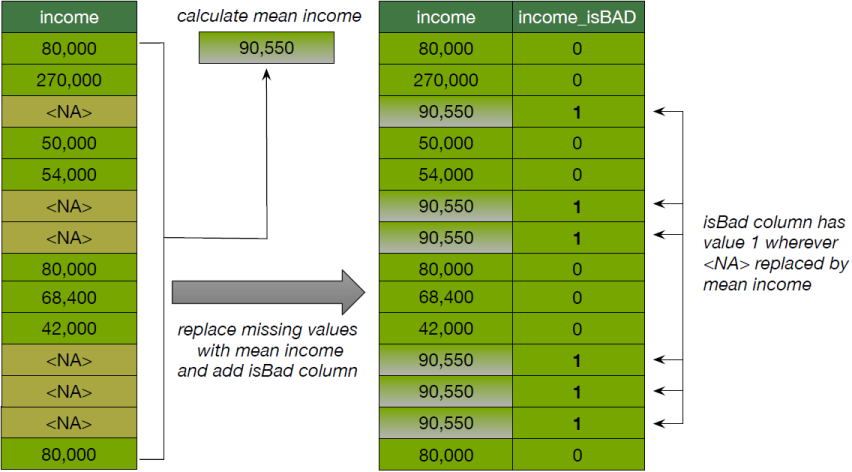
Replace missing values with the mean and add an indicator column to track altered values
Figure 4.7. Creating and applying a simple treatment plan
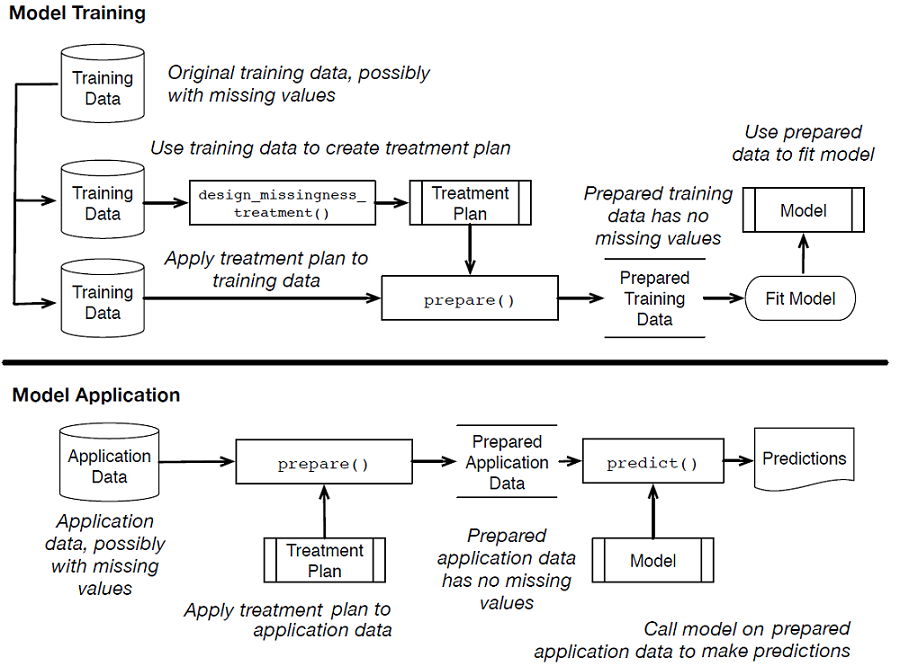
Creating and applying a simple treatment plan
Figure 4.8. Is a 35-year-old young?
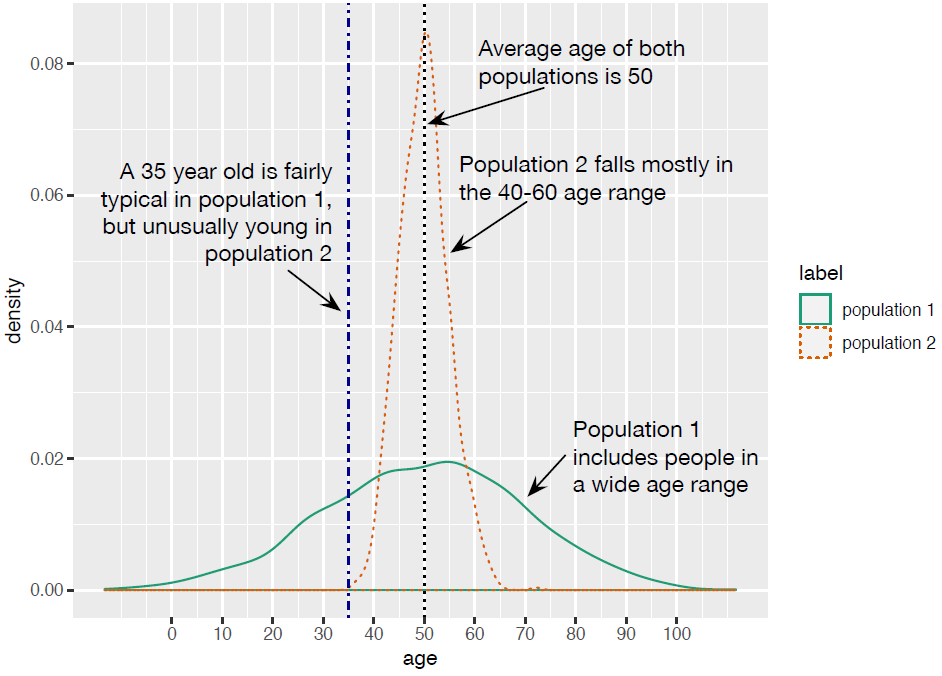
Is a 35-year-old young?
Figure 4.9. Is a 35-year-old young?
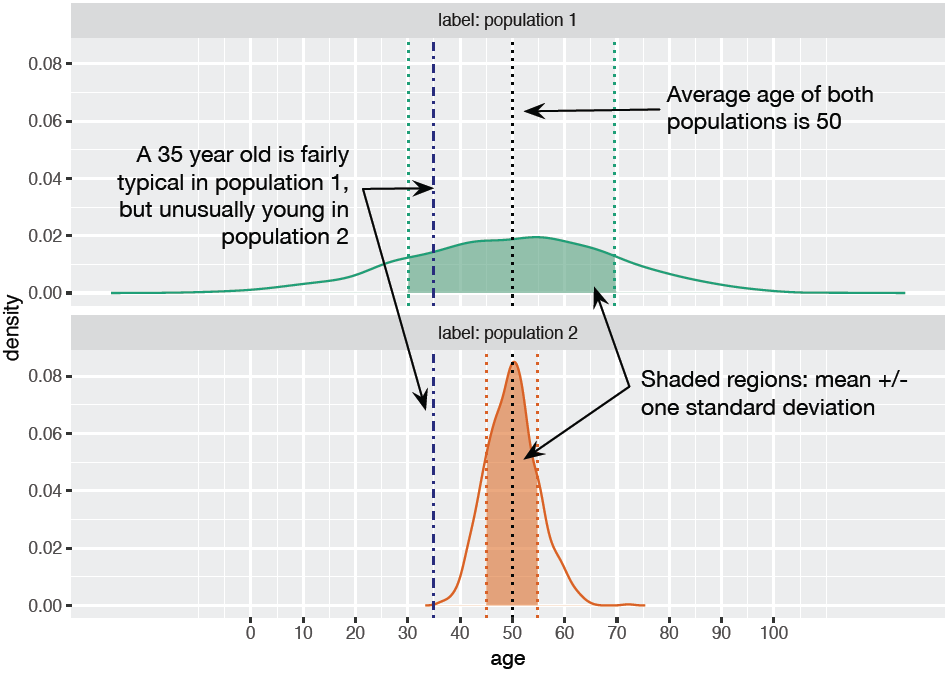
Is a 35-year-old young?
Figure 4.10. A nearly lognormal distribution and its log
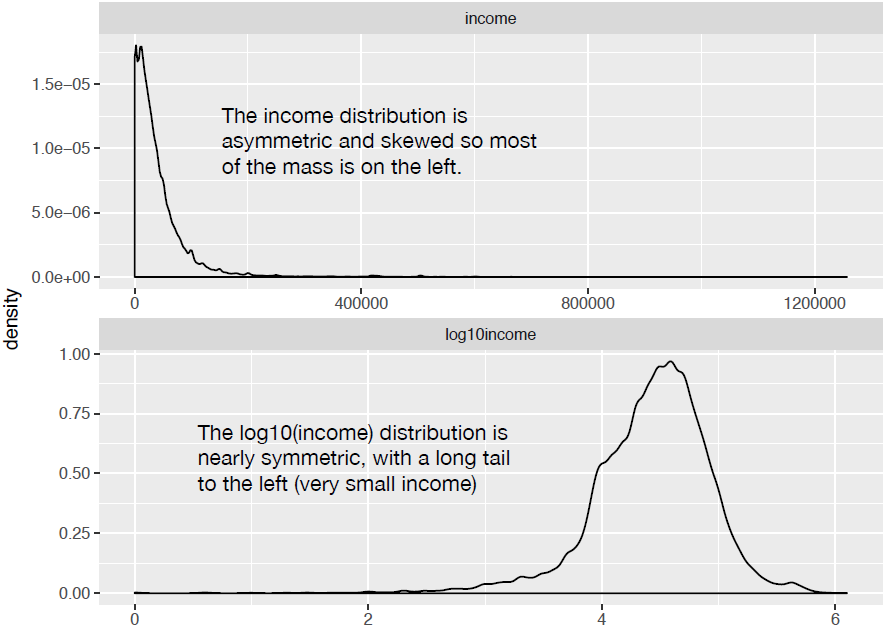
A nearly lognormal distribution and its log
Figure 4.11. Signed log lets you visualize non-positive data on a logarithmic scale.
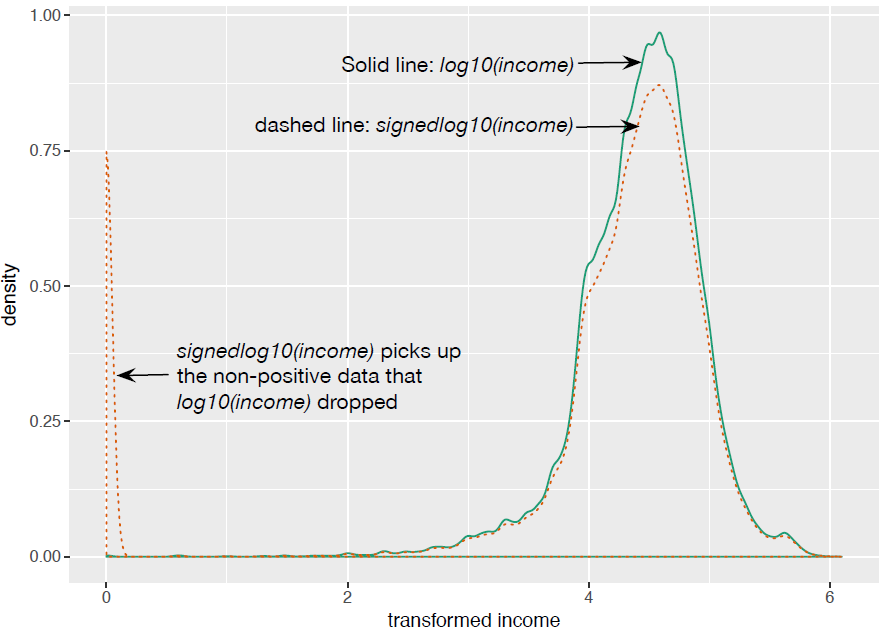
Signed log lets you visualize non-positive data on a logarithmic scale.
Figure 4.12. Splitting data into training and test (or training, calibration and test) sets
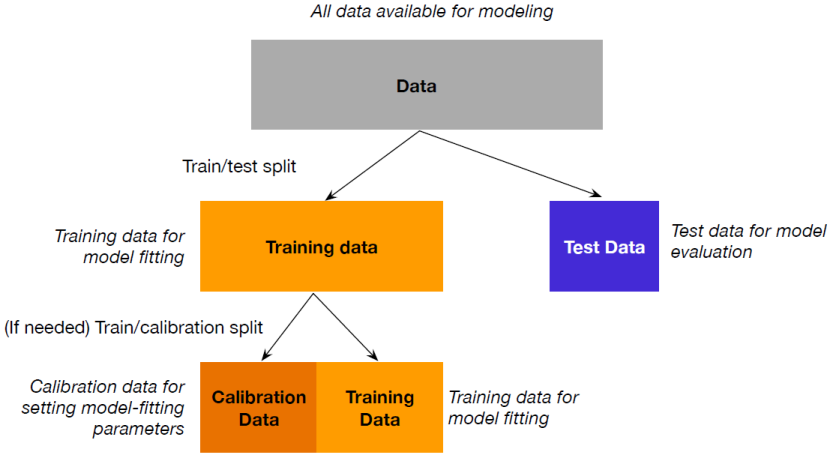
Splitting data into training and test (or training, calibration and test) sets
Figure 4.13. Example of dataset with customers and households
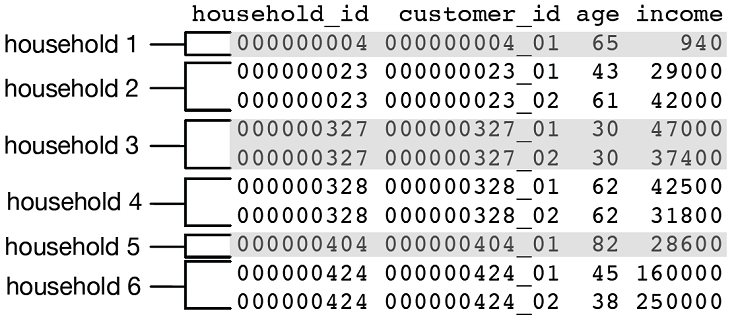
Example of dataset with customers and households
Figure 4.14. Example of dataset with customers and households
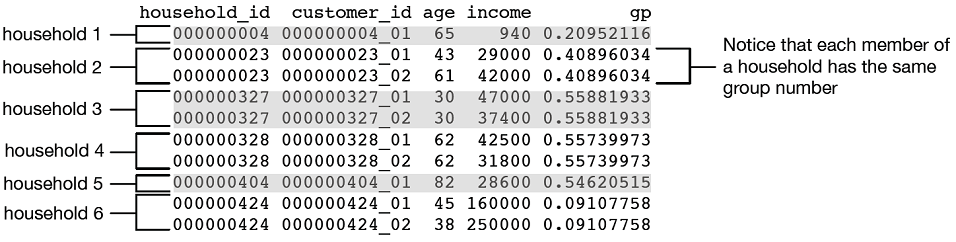
Example of dataset with customers and households
Figure 4.15. Recording data source, collection date, and treatment date with data
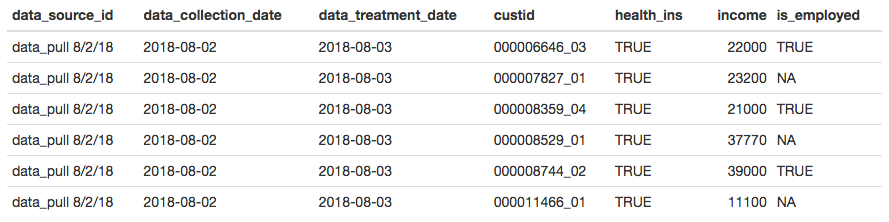
Recording data source, collection date, and treatment date with data

 Summary

At some point, you’ll have data quality that is as good as you can make it. You’ve fixed problems with missing data and performed any needed transformations. You’re ready to go on the modeling stage.

Remember, though, that data science is an iterative process. You may discover during the modeling process that you have to do additional data cleaning or transformation. You may have to go back even further and collect different types of data. That’s why we recommend adding columns for sample groups and data provenance to your datasets (and later, to the models and model output), so you can keep track of the data management steps as the data and the models evolve.

In part 2 of the book, we’ll talk about the process of building and evaluating models to meet your stated objectives.

In this chapter you have learned:

  • Different ways to handle missing values, and when different approaches are suitable.
  • How to use the vtreat package to manage missing values automatically.
  • How to normalize or rescale data, and when normalization/rescaling are appropriate.
  • How to log transform data, and when log transformations are appropriate.
  • How to implement a reproducible sampling scheme for creating test/train splits of your data.

FAQ

What kinds of data quality problems does Chapter 4 focus on?Fixing invalid and missing values, transforming variables so they’re easier to model, and organizing data for reliable modeling and evaluation. Examples include out-of-range ages or incomes, mixed coded/numeric fields, and wide datasets with many NAs.
How should I treat invalid or out-of-range values and missing data?Use domain knowledge to define valid ranges, convert invalid entries to missing (NA), and then apply a consistent missing-value strategy. This keeps the cleaning logic simple and allows you to reuse the same imputation approach across projects.
How do I handle fields that mix true values with special codes (like gas_usage)?Split the problem: (1) create indicator variables for each special code so the model can learn from the “why it’s special,” and (2) set the original field to NA where codes appear, then impute or otherwise treat it as a numeric measure for the remaining rows.
What’s the recommended approach to missing values in categorical vs numeric/logical variables?- Categorical: add an explicit “missing” (or “_invalid_”) level so the model sees missingness as a category. - Numeric/logical: impute a reasonable stand-in (often the mean) and add a companion missingness flag (for example, income_isBAD) so the model can detect systematic differences between imputed and observed values.
Are missing values usually random, and how should I reflect that uncertainty?Don’t assume randomness. When in doubt, treat missingness as potentially informative: impute values for usability and add missingness indicators so the model can learn whether missing entries signal a distinct subgroup.
What does the vtreat package do, and when should I use it?vtreat builds a reusable “treatment plan” that encodes how to handle missing and unexpected values, adds missingness indicators, and prepares both training and future data in the same way. It helps ensure repeatable, safe data transformations with no NAs before modeling.
Why and how should I normalize, center, and scale features?These transforms make variables comparable, improve numerical stability, and help methods that expect roughly linear relationships or similar value ranges. Compute means/standard deviations on training data and reuse them to transform new data so units stay consistent. Use conditional normalization (e.g., income divided by state median) when context matters.
When should I use log or signed-log transforms?Use log for skewed or wide-range variables (common with monetary amounts) and for multiplicative effects (percentage-type changes). If zeros/negatives occur, use a signed log (log of absolute value with the original sign, mapping small magnitudes to 0) or alternatives like arcsinh, acknowledging interpretability trade-offs.
How do I create reproducible train/test splits, and why does it matter?Create a random “group” column (e.g., runif) with a fixed seed and split by thresholds (e.g., gp ≤ 0.1 for test). This yields repeatable subsets that speed debugging, enable regression testing, and make experimental comparisons fair. The same idea works in databases using RAND.
How do I avoid leakage with multi-record entities and track provenance?Sample at the entity level: assign one random group value per entity (e.g., household), join it back, and split so all records of that entity land in the same set. Also record metadata (data source, collection date, treatment version/date) to compare models fairly and rerun treatments when procedures change.

pro $24.99 per month

  • access to all Manning books, MEAPs, liveVideos, liveProjects, and audiobooks!
  • choose one free eBook per month to keep
  • exclusive 50% discount on all purchases
  • renews monthly, pause or cancel renewal anytime

lite $19.99 per month

  • access to all Manning books, including MEAPs!

team

5, 10 or 20 seats+ for your team - learn more


choose your plan

team

monthly
annual
$49.99
$499.99
only $41.67 per month
  • five seats for your team
  • access to all Manning books, MEAPs, liveVideos, liveProjects, and audiobooks!
  • choose another free product every time you renew
  • choose twelve free products per year
  • exclusive 50% discount on all purchases
  • renews monthly, pause or cancel renewal anytime
  • renews annually, pause or cancel renewal anytime
  • Practical Data Science with R, Second Edition ebook for free

choose your plan

team

monthly
annual
$49.99
$499.99
only $41.67 per month
  • five seats for your team
  • access to all Manning books, MEAPs, liveVideos, liveProjects, and audiobooks!
  • choose another free product every time you renew
  • choose twelve free products per year
  • exclusive 50% discount on all purchases
  • renews monthly, pause or cancel renewal anytime
  • renews annually, pause or cancel renewal anytime
  • Practical Data Science with R, Second Edition ebook for free