This chapter introduces visualization as an essential part of data analysis, not just a way to present results to others but also a way to deepen the analyst’s own understanding. It emphasizes that while pandas data work is often numerical, people usually grasp patterns and relationships much more easily through charts, graphs, and other visual summaries. The chapter positions pandas plotting as a practical bridge to Matplotlib, while also noting Seaborn as a popular alternative for creating attractive plots with less manual customization.
The early examples focus on using pandas plotting tools to turn a cities data set into several kinds of charts. The analysis includes counting cities by state with grouped bar plots, examining city growth in Pennsylvania after cleaning percentage strings into numeric values, comparing Massachusetts city populations with a pie chart, and mapping latitude and longitude with a scatter plot. These exercises show that good visualization often depends on reshaping and cleaning the data first, such as filtering rows, selecting columns, setting indexes, sorting values, and converting strings into usable numbers before plotting.
The chapter then broadens into boxplots, correlation, and more advanced plotting with Seaborn. Boxplots are introduced as graphical versions of the five-number summary, helping identify spread, median, whiskers, and outliers; this is demonstrated with Chicago weather and then extended to multiple cities using combined data frames. Correlation is explained as a measure of how two numeric variables move together, and the chapter explores this with temperature data, taxi fares, and examples involving oil, ice cream, and travel. Seaborn is used to make scatter plots, line plots, boxplots, and histograms more expressive, showing how hue, style, faceting, and categorical views can reveal patterns that are harder to see in raw tables or simple plots.
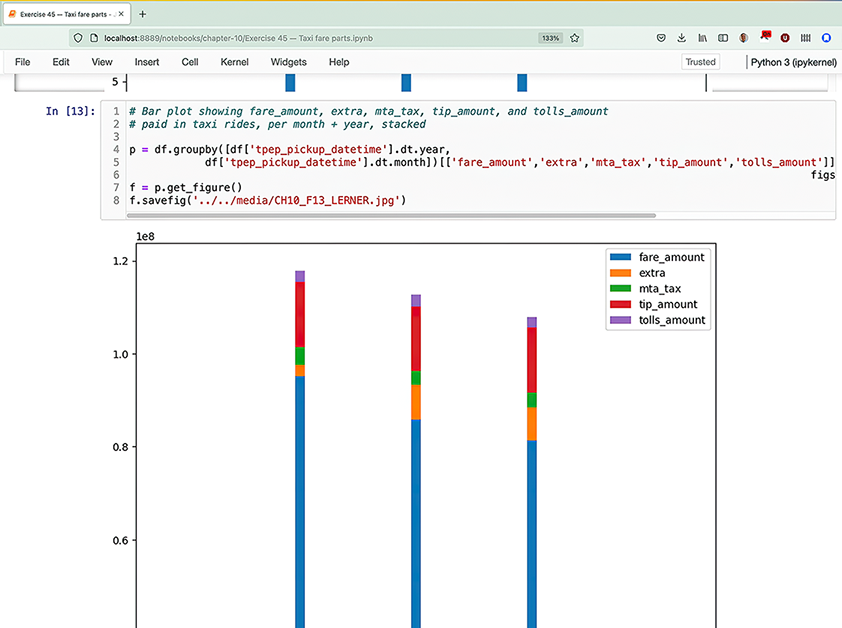
Screenshot of a Jupyter notebook combining code and plots
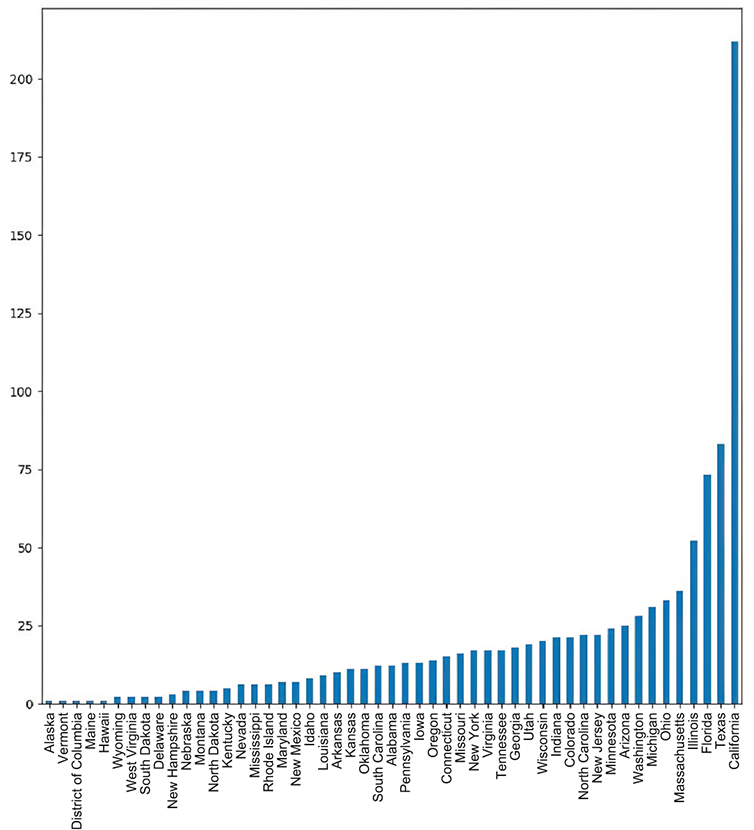
Bar plot showing how many large cities are in each state
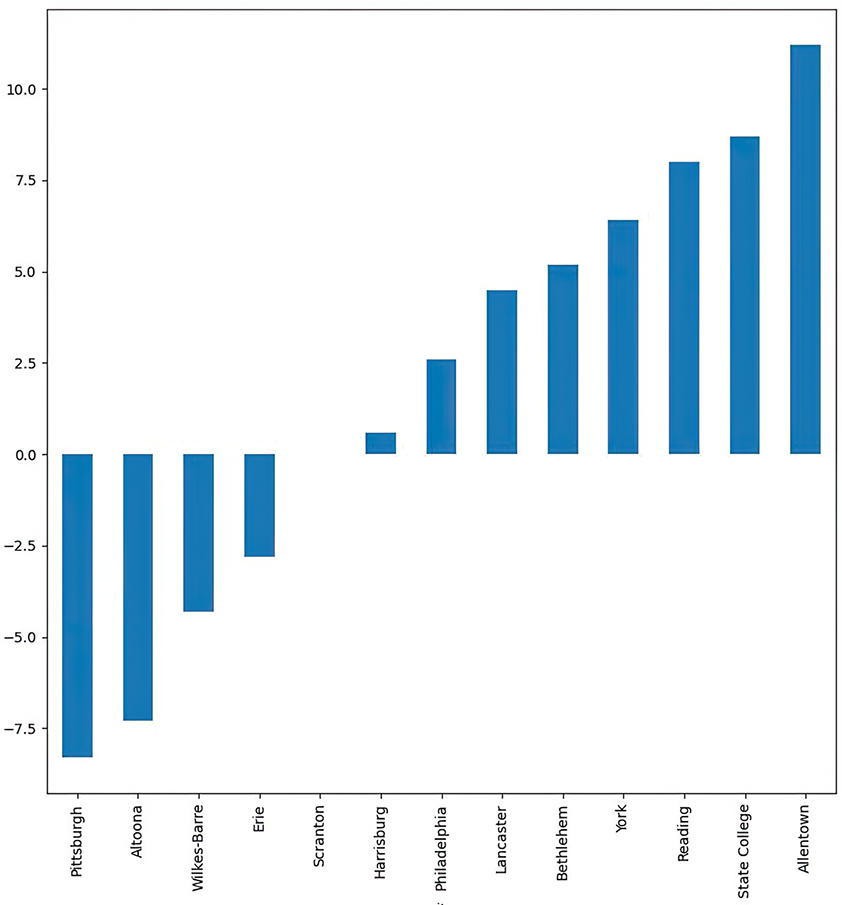
Bar plot showing growth in Pennsylvania cities
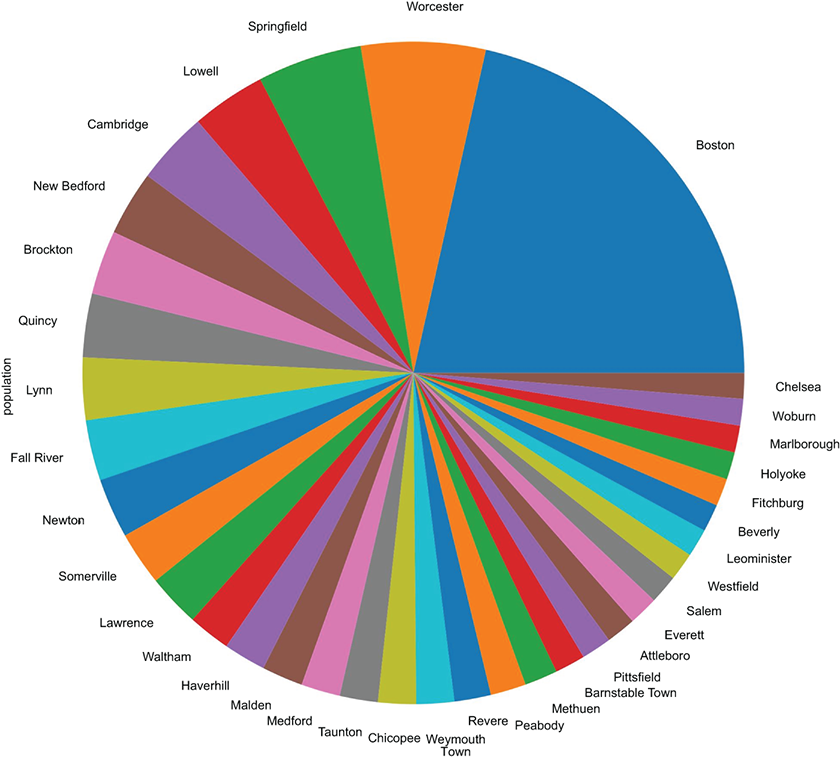
Pie chart showing the population of Massachusetts cities
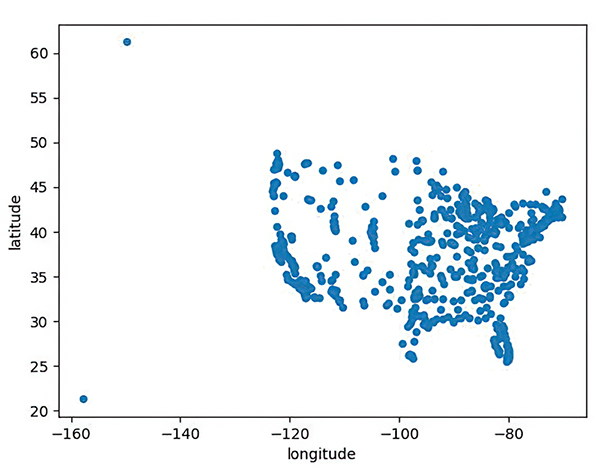
Scatter plot of cities’ longitude and latitude
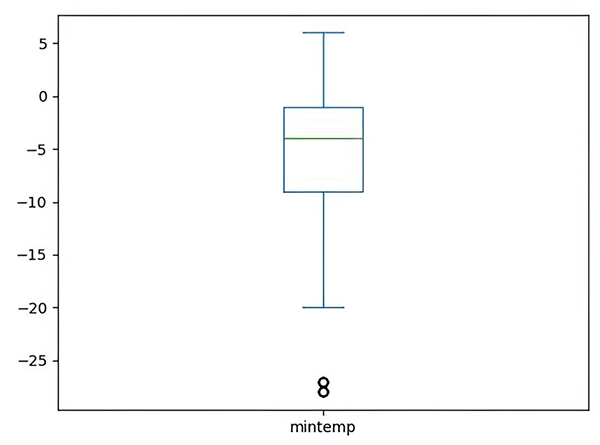
Boxplot of minimum temperatures in Chicago
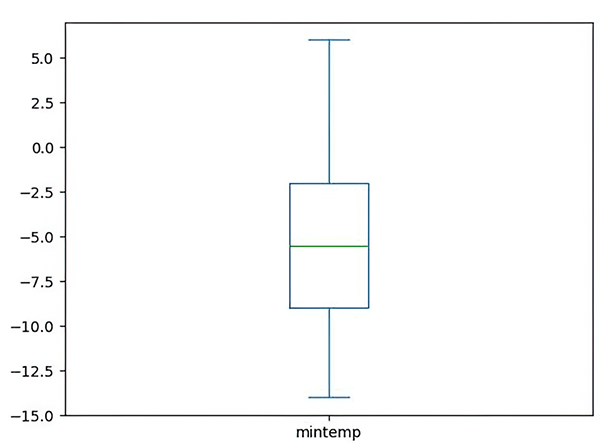
Boxplot for minimum Chicago temperatures in February
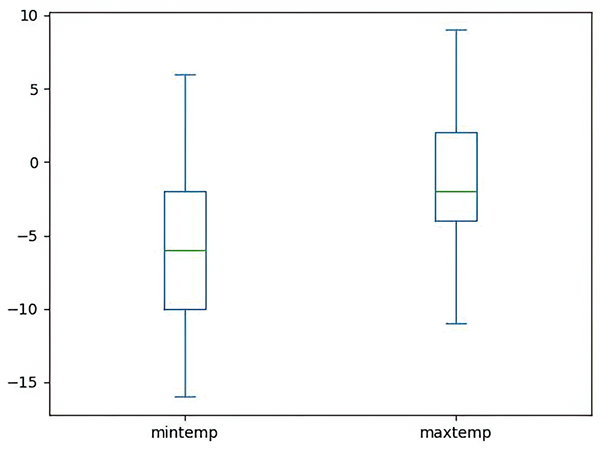
Boxplot for minimum and maximum Chicago temperatures in February and March
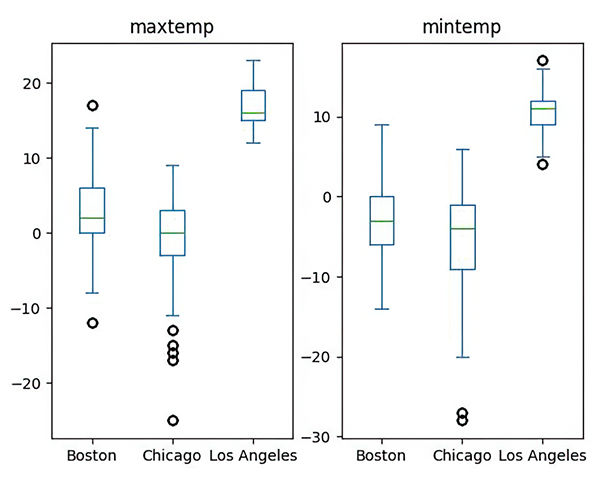
Boxplot for minimum and maximum temperatures in several cities
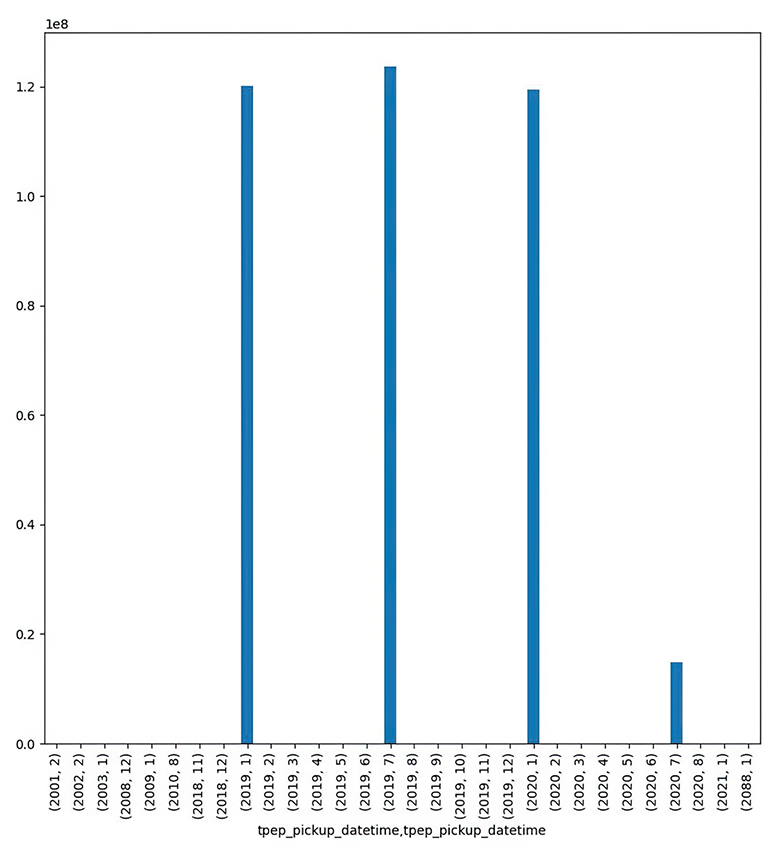
Bar plot showing how much money was paid to taxis in each month and year
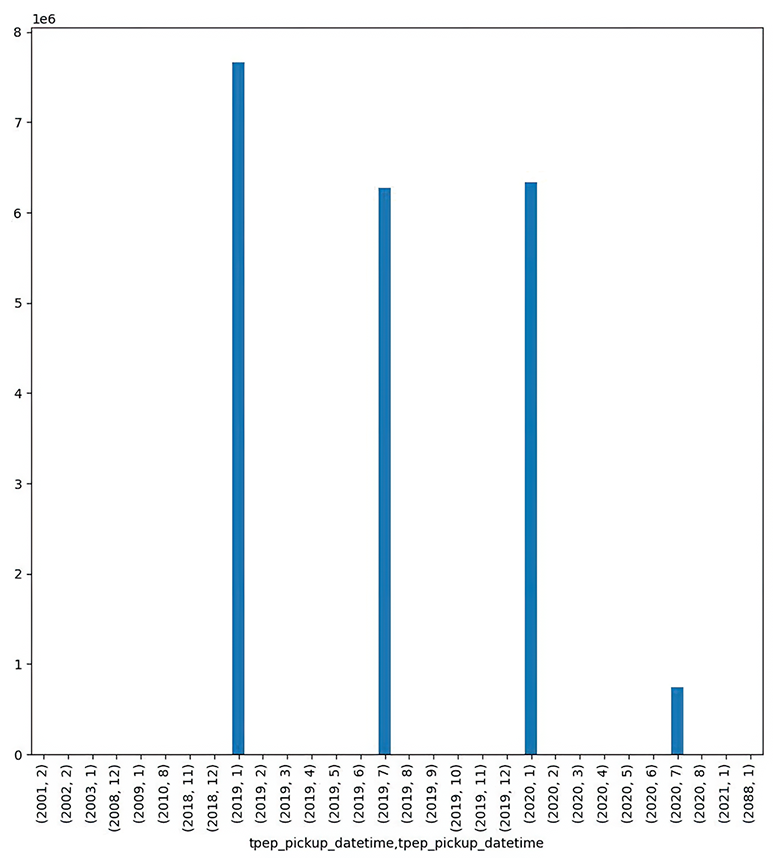
Bar plot showing how many taxi rides occurred per month and year
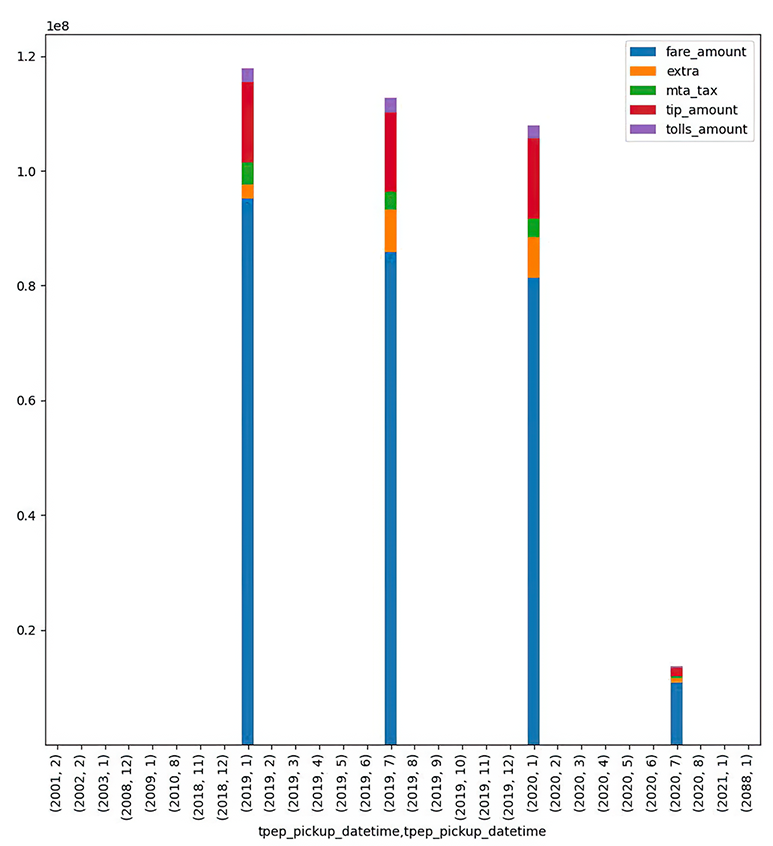
Stacked bar plot showing the relative components that go into the total fare per year and month
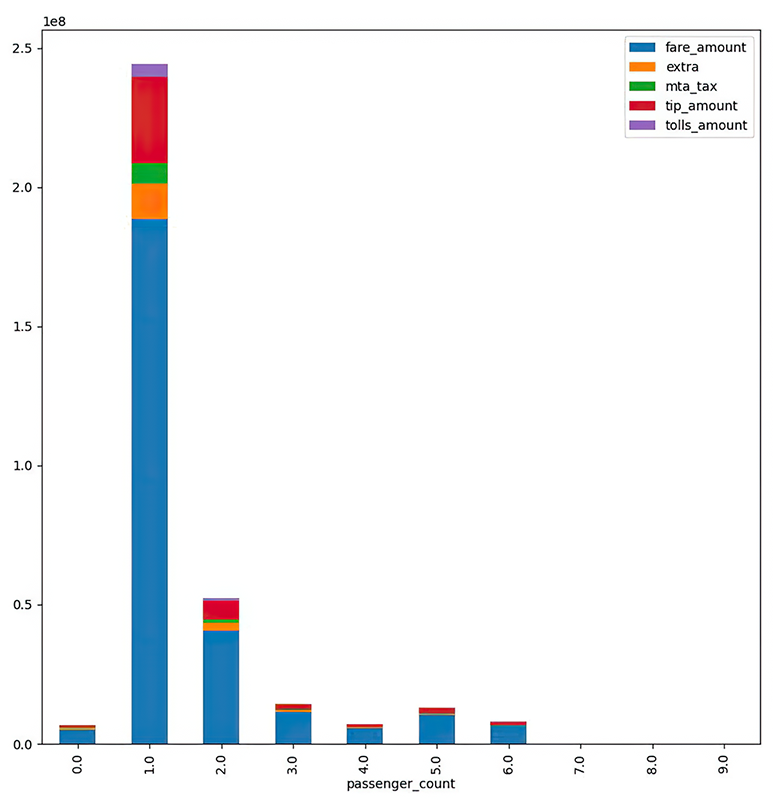
Stacked bar plot showing the relative components that go into the total fare per number of passengers
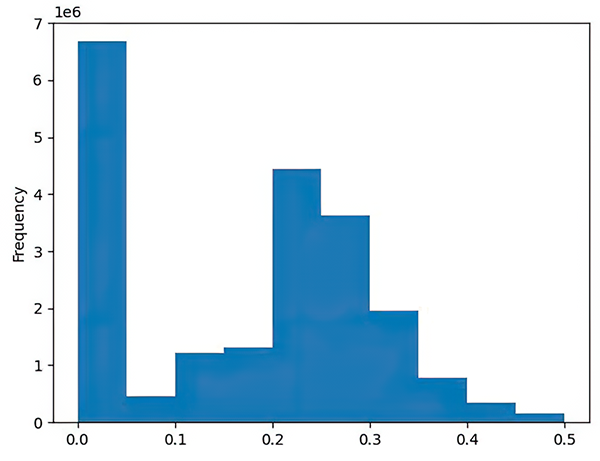
Histogram showing, across all rides, what nonzero percentage New York riders tip
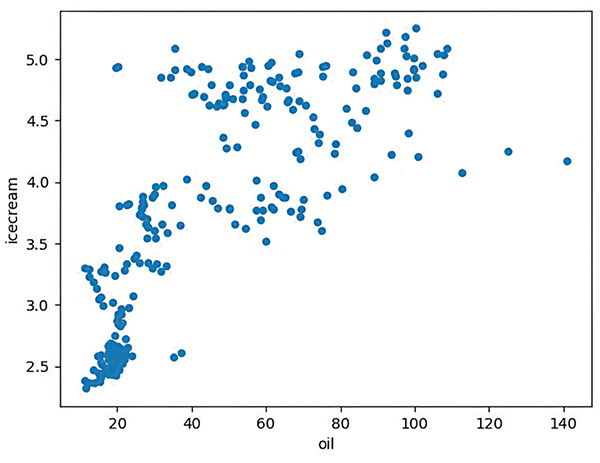
Scatter plot comparing oil prices and ice cream consumption
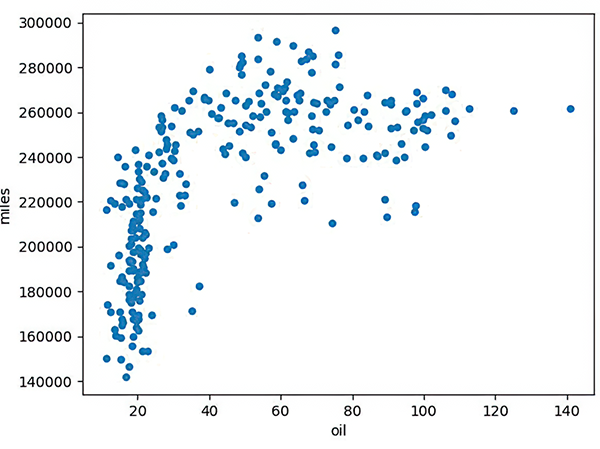
Scatter plot comparing oil prices and miles driven
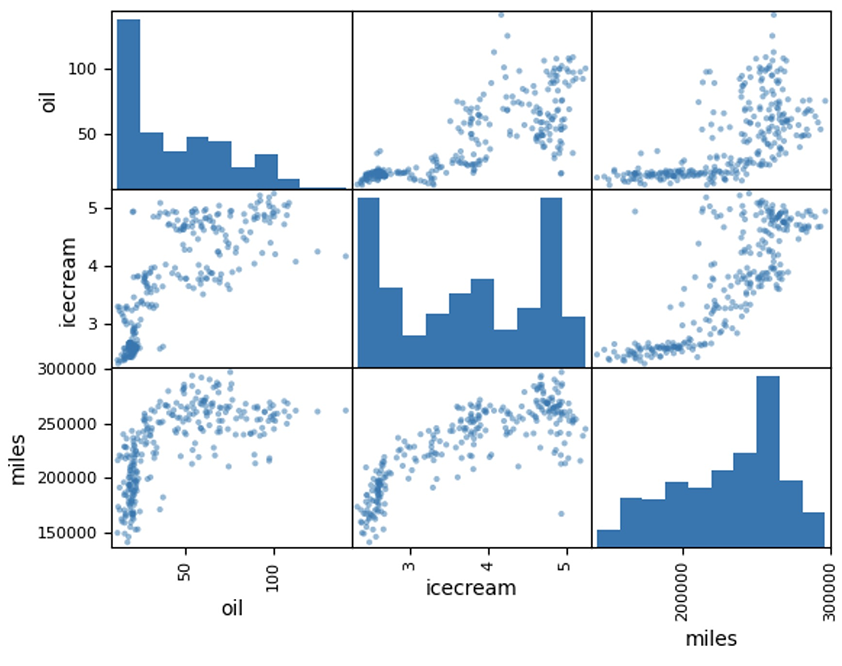
Scatter matrix
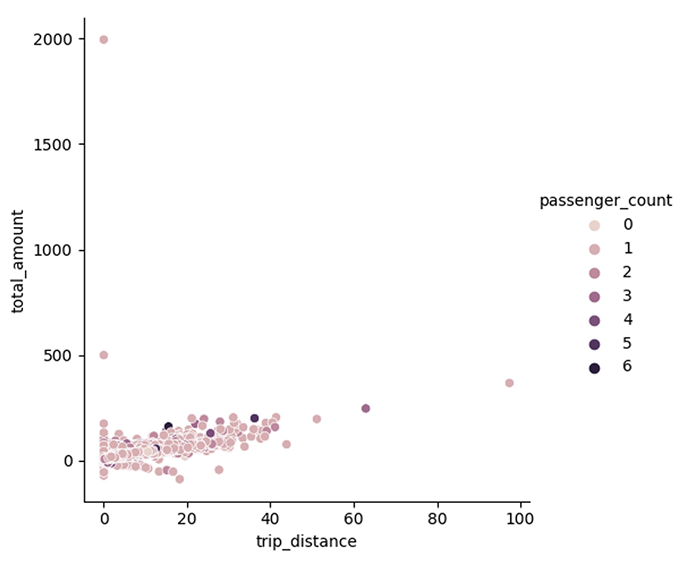
Scatter plot comparing trip_distance with total_amount
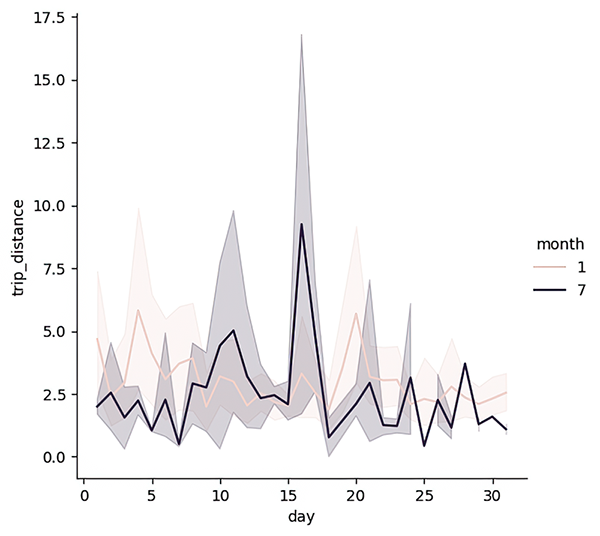
Line plot showing trip_distance per day, separated by month
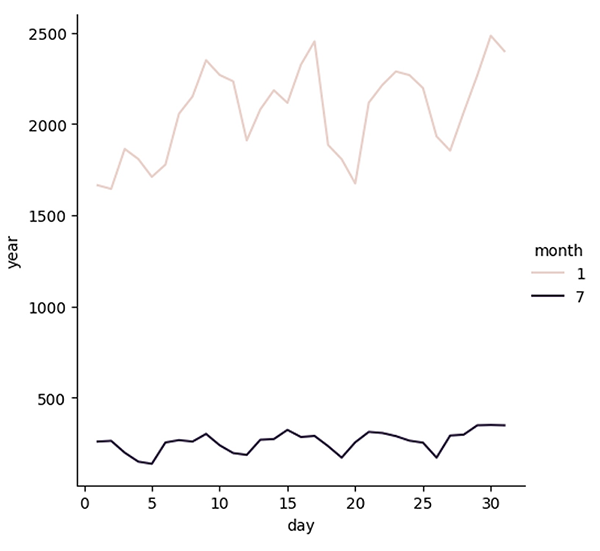
Line plot showing trip_distance per day, separated by month
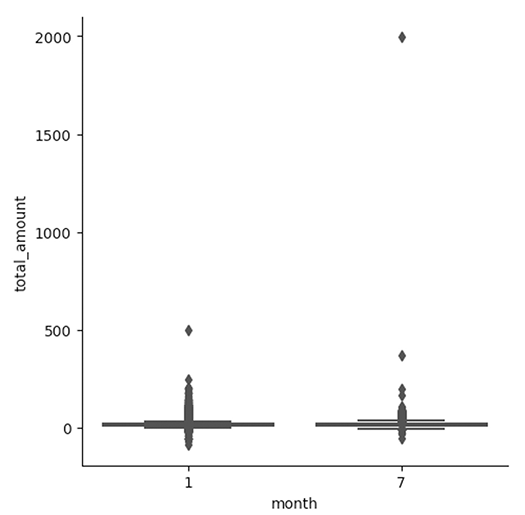
Boxplot for total_amount per month
Summary
Visualization is a key part of data science. We often think of it as a way to help non-experts to better understand our data, but it’s also a powerful way to better understand our own data, getting insights from a new perspective. In this chapter, we saw a number of the ways pandas can perform visualizations using a simplified API to Matplotlib. We also saw, in the final exercise, how the Seaborn package can create attractive plots using data frames with its own separate API on top of Matplotlib.
FAQ
What is the main goal of visualization in this chapter?
Visualization helps turn large collections of numbers into pictures that are easier for humans to understand, making relationships and patterns in data much clearer.Why does the chapter use pandas for plotting instead of calling Matplotlib directly?
Because pandas provides a convenient plotting API on top of Matplotlib, letting you create plots directly from data frames while still benefiting from Matplotlib under the hood when needed.What role does Jupyter play in working with visualizations?
Jupyter displays plots inline, so you can keep code, data, and graphs together in one notebook, which makes analysis and sharing much easier.How do you count how many cities are in each state in the cities exercise?
Usegroupby('state')['city'].count() to count the number of city rows per state, then sort the result before plotting it as a bar chart.Why is sort_values() used before creating the state bar plot?
It orders the states from the fewest cities to the most cities, which makes the bar chart easier to read and matches the exercise requirement.How do you prepare Pennsylvania city growth values for plotting?
Filter rows wherestate == 'Pennsylvania', keep the city and growth columns, set city as the index, remove the % sign, convert the values to numbers, and sort them.Why is the growth_from_2000_to_2013 column converted from text to a number?
Because the values contain a percent sign, so they must be cleaned and converted to a numeric type before they can be plotted correctly.How do you create the Massachusetts pie chart?
Select the Massachusetts rows, keepcity and population, set city as the index, then plot the population series as a pie chart.
 Pandas Workout ebook for free