This chapter introduces pandas through the lens of the Series, showing that a data frame is essentially a collection of one-dimensional series objects. It emphasizes that many familiar methods work on both series and data frames, but on a data frame they usually produce one result per column. The chapter also highlights the importance of indexes for selecting, aligning, and transforming data, and it introduces common conventions for naming pandas objects as well as useful reference tools for working in Jupyter and with core Python and NumPy features.
Most of the chapter is built around hands-on exercises that teach the basics of creating series, setting indexes, and using aggregation methods such as mean, max, min, standard deviation, and descriptive summaries. The reader learns how to generate reproducible random data with NumPy generators, how to attach meaningful string indexes, and how to slice series by position or label using ordinary slicing, .iloc, and .loc. The text also explains subtle but important details such as the inclusive endpoint behavior of .loc, the difference between population and sample standard deviation, and how data type choices affect memory use and correctness.
Later examples build on these fundamentals to show pandas’ vectorized behavior, where arithmetic and comparisons operate elementwise and align by index rather than by position. This leads to practical techniques for scaling scores, transforming values through broadcasting, and selecting or replacing values with boolean mask indexes. The chapter closes by showing how to count values, group data into categories with value_counts and pd.cut, and work with real-world CSV data. Across all of these examples, the main lesson is that understanding series, indexes, and data types unlocks most everyday pandas workflows.
Each of a data frame’s columns is a series.

Invoking a series method (such as mean) on a data frame often returns one value for each column.

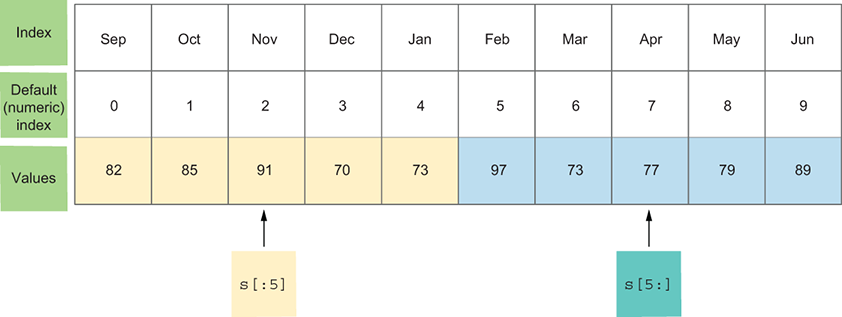
Retrieving slices from our series
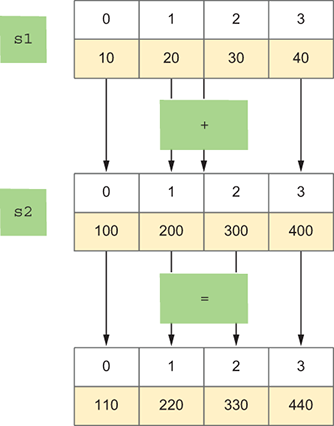
When we add two series together, the result is a new series—the result of adding elements at the same index.
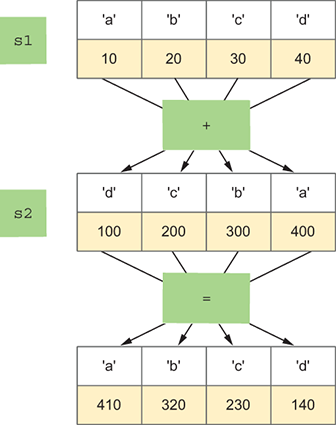
Vectorized operations work using the index, not the position.
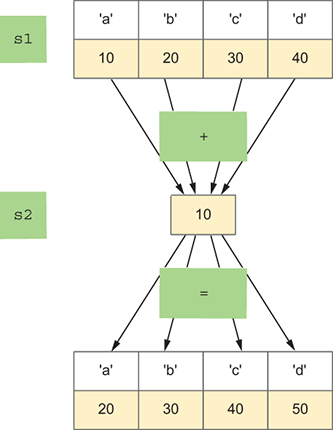
Operations involving a series and a scalar value result in broadcasting the operation, resulting in a new series.
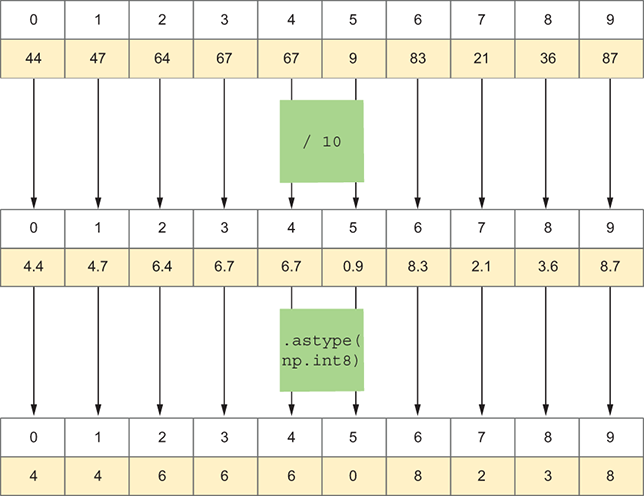
Graphical depiction of dividing the series by 10, converting to np.int8
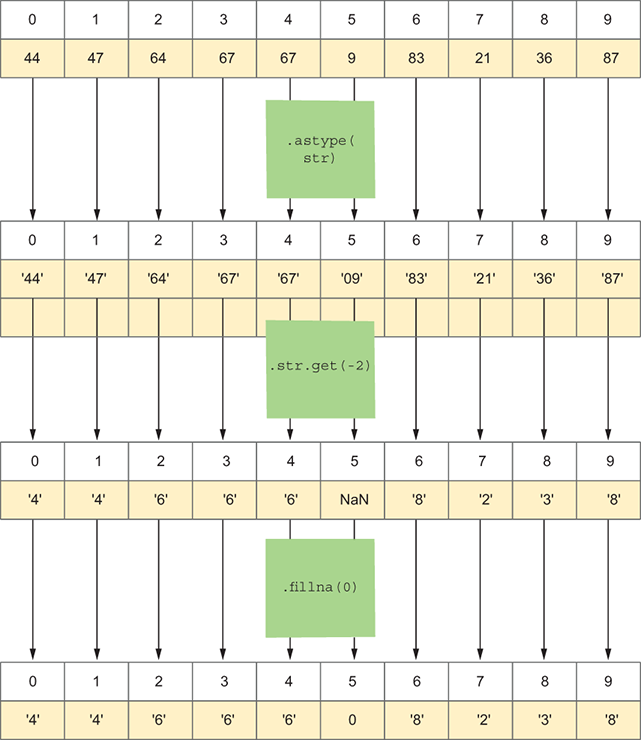
Graphical depiction of turning the series into strings, retrieving the item at index –2, and replacing NaN with 0
Summary
In this chapter, we saw that a pandas series provides powerful tools to analyze data. Whether it’s the index, reading data from files, calculating descriptive statistics, retrieving values via fancy indexing, or even categorizing our data via numeric boundaries, we can do a lot. In the next chapter, we’ll expand our reach to look at data frames, the two-dimensional data structures that most people think of when they work with pandas.

 Pandas Workout ebook for free