3 Create your first Knowledge Graph from ontologies
Building a useful knowledge graph starts with business goals and data understanding, not technology. The chapter frames knowledge graph construction as a semantic integration problem: fusing heterogeneous data sources that differ by format, storage, syntax, and—crucially—meaning. It proposes using ontologies as a reference schema and controlled vocabulary to harmonize synonyms, disambiguate acronyms, and align different levels of granularity. Grounding the discussion in a clinical use case—supporting clinicians who must recognize rare diseases—the chapter adopts the Human Phenotype Ontology and an ontology-annotated dataset to create a unified, queryable representation that preserves provenance and enables exploration of disease–phenotype relationships.
The chapter compares the main knowledge graph technologies through a goal-driven lens. RDF excels at standardized, interoperable representations and rich semantics for reasoning, but requires modeling patterns (n-ary relations, named graphs, or RDF-star) to attach metadata to specific assertions. Labeled Property Graphs attach properties directly to nodes and edges, making them efficient and intuitive for relationship-centric metadata such as evidence, source, frequency, onset, and curation details. Given clinicians’ needs to compare and trace annotation-level details, the chapter favors LPG for the core graph while noting bridges between the two worlds and vendor tooling that brings inference capabilities to property graphs. The takeaway is pragmatic: let the use case dictate the model.
Practically, the chapter walks through a repeatable pipeline aligned with business and data understanding, preparation, model creation, and querying. It imports the HPO ontology, derives clean identifiers and labels, ingests the annotations file to create disease nodes and disease–phenotype links, and enriches relationships with provenance and interpretive fields (evidence categories, frequency, onset, curator, dates). After pruning extraneous ontology scaffolding, the resulting graph supports queries that rank diseases by observed phenotypic features, inspect co-occurrence patterns, and trace sources. Finally, ontology-based reasoning over the HPO hierarchy enables inference from high-level categories down to specific traits, letting clinicians navigate different granularities with a precise vocabulary, transparent provenance, and actionable insights for rare disease diagnosis.
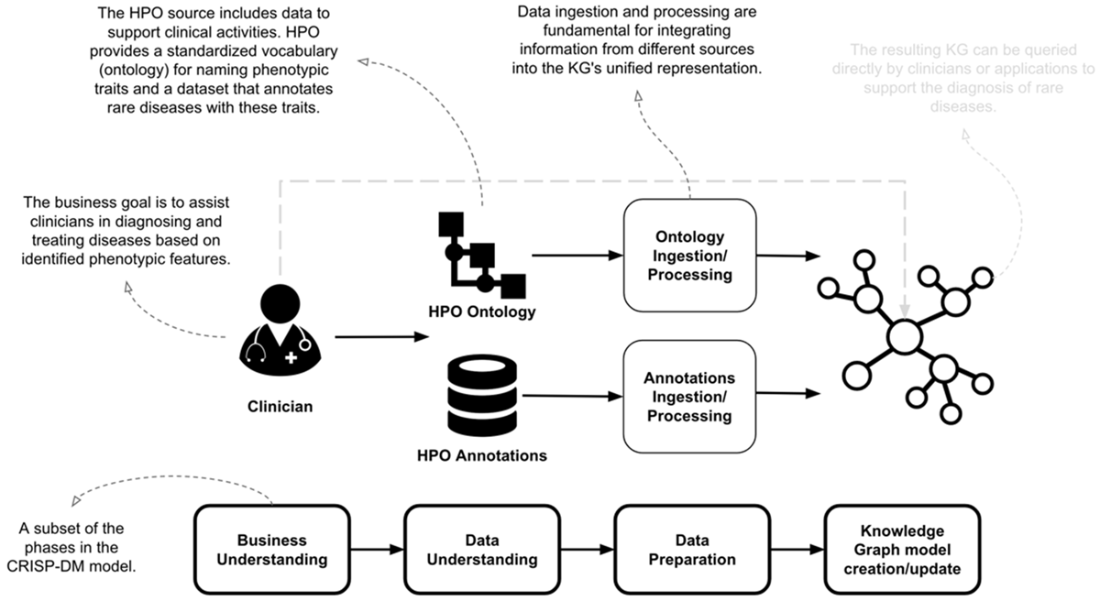
The mental model describing the KG construction process as a specification of the CRIPS-DM model, from understanding the business goal to defining the KG queries that support the clinicians' activities.
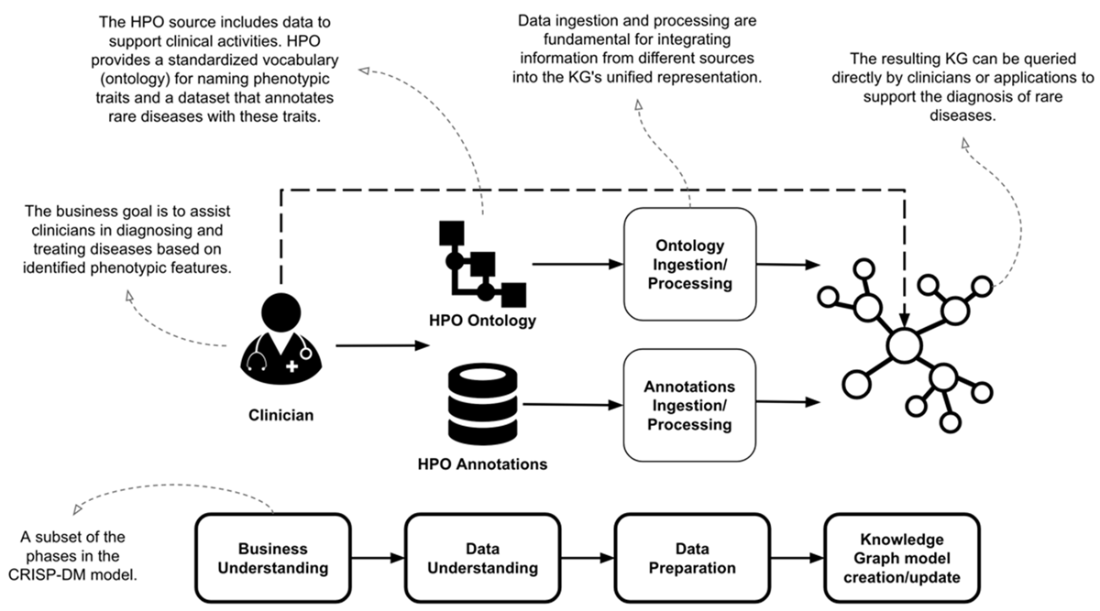
The CRIPS-DM model adapted to KGs. A subset of the components of this diagram, including business understanding, data understanding, data preparation, and KG model creation/update, represent key phases described in this chapter.

Understanding the business domain for creating a KG that supports the clinicians' activities. This phase is not strictly related to the technical aspects, but it is fundamental for the next steps.
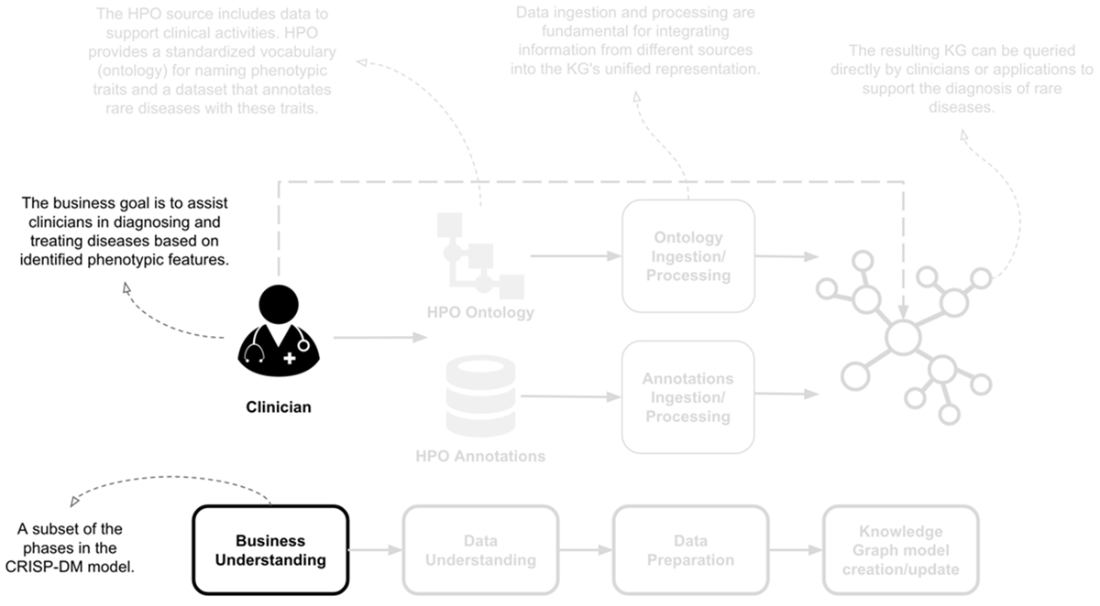
An annotated Venn diagram shows that Type 1 Diabetes Mellitus can be considered as either a disease or a phenotypic feature. Based on the context, two different IDs can be adopted.
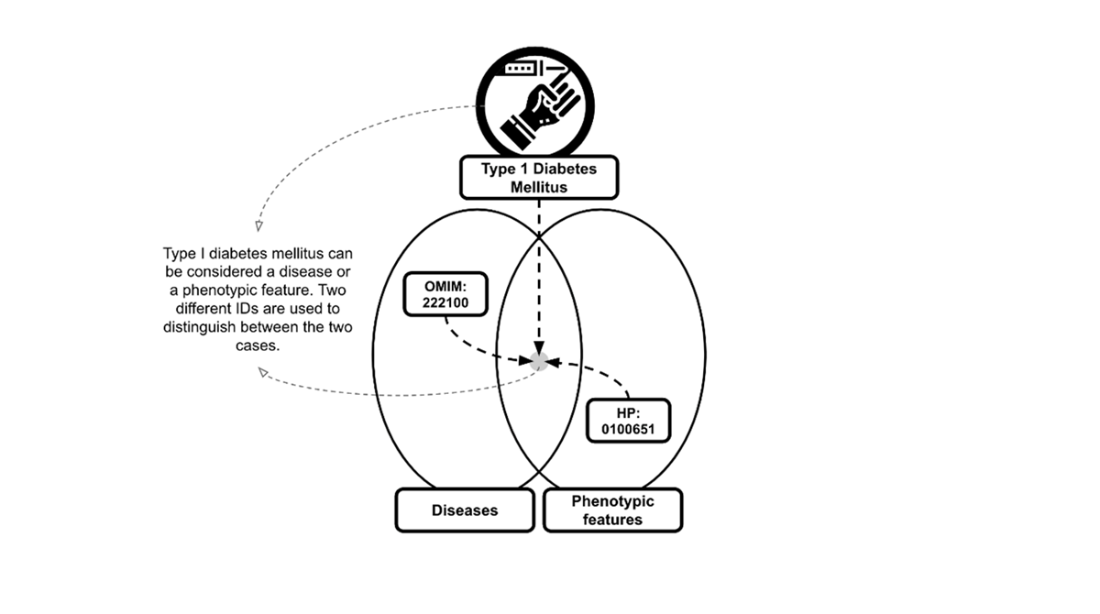
Understanding the data to support the clinicians' activities. This fundamental explorative phase gets the key information needed to construct the KG.
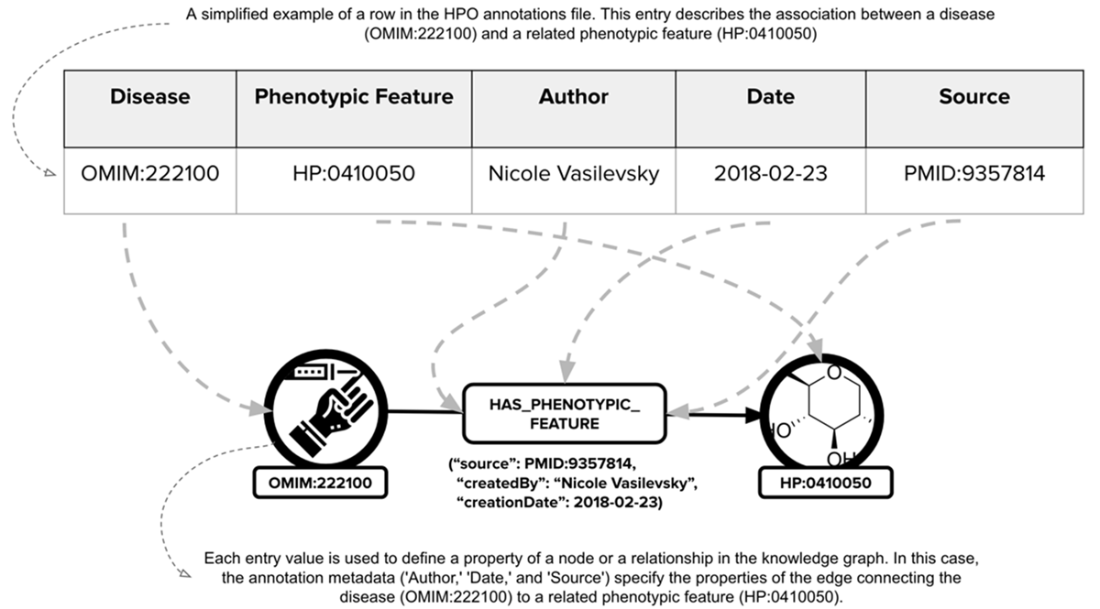
Data transformation from a table row to a KG edge. Information included in this table is adapted to define the properties of nodes and the edges of the KG.
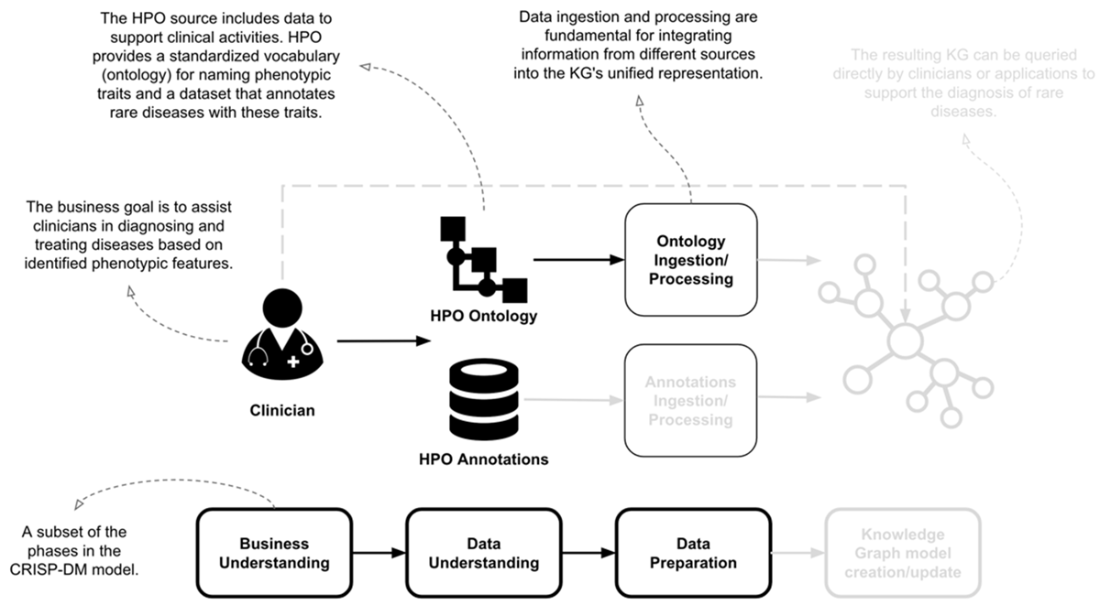
Ontology ingestion and processing.
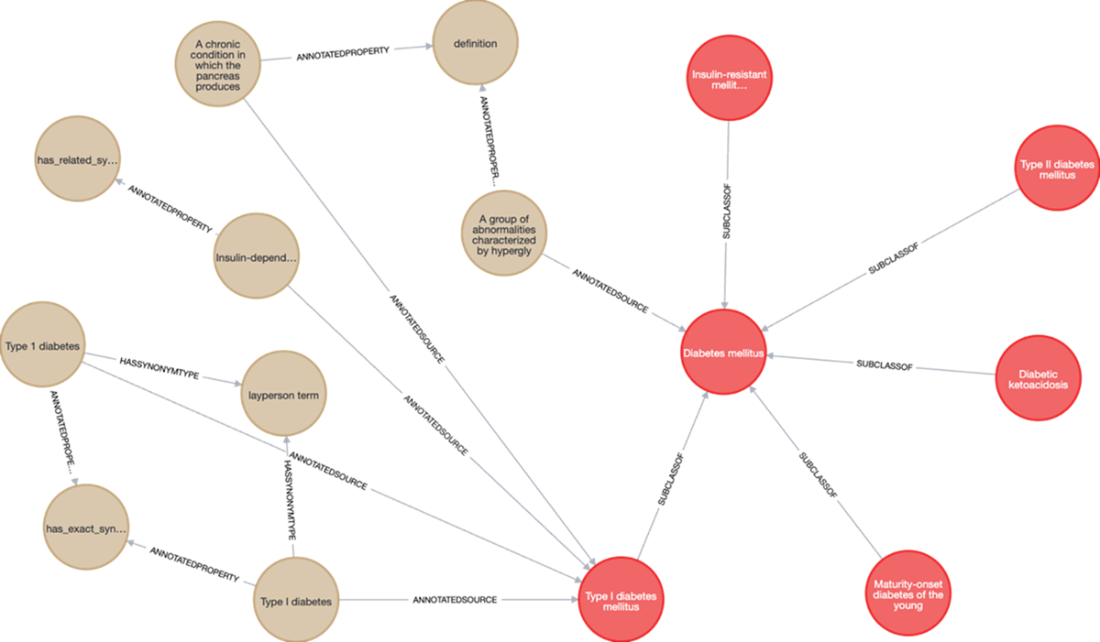
A portion of the HPO ontology loaded in the graph database using LPG as storage model. We can distinguish between two types of information: ontological information (left side) and domain-specific information related to the phenotypic features (right side).
Annotation data set ingestion and processing to finalize the construction of the KG.
Querying the generated KG to support the clinician's activities.
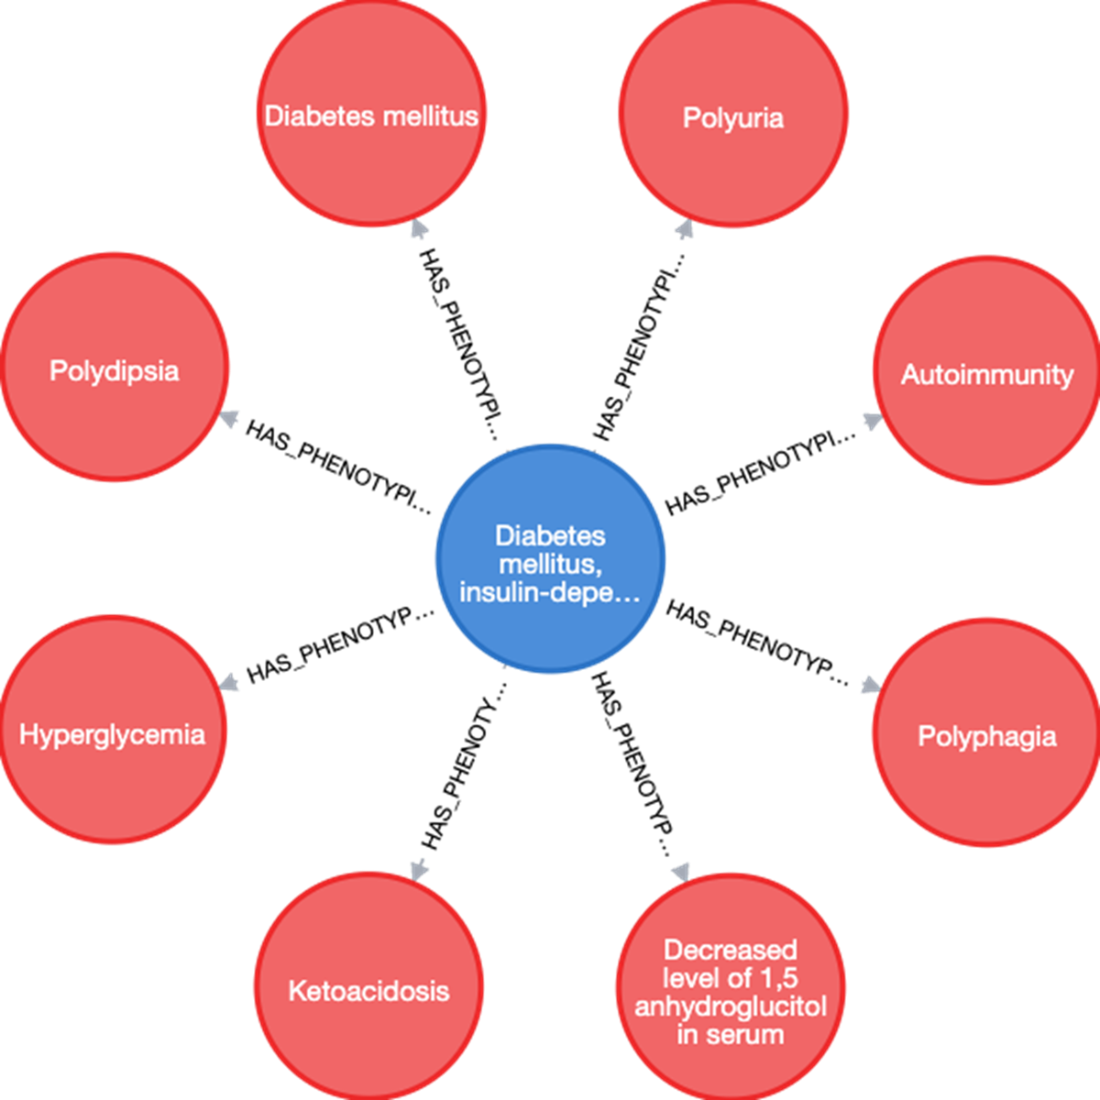
Result of a query that gets all the phenotype features related to Type 1 diabetes.
Summary
- Constructing the knowledge graph (KG) is a complex process because it requires extracting and integrating information from heterogeneous sources.
- Incorporating these sources aims to harmonize their data and leads to a coherent perspective on the general information.
- At the end of the building process, the resulting KG must be a unified, well-grounded, and meaningful representation of data from different sources, where the individual pieces of information are fused into a unique view.
- A well-driven KG construction requires a clear idea of the problem you want to solve, an understanding of the reference domain, and a phase involving data scouting, exploration, and comprehension.
- The Resource Description Framework (RDF) and the labeled property graph (LPG) are two of the most prominent technologies for materializing KGs.
- The RDF data model focuses on knowledge representation and is particularly suitable for constructing ontologies.
- The LPG approach intends to provide a fast and query-based traversal mechanism of graph data and path analysis features, emphasizing the efficiency of data storage and access.
- Understanding the differences between RDF and LPG is crucial to selecting the best technologies for your specific purpose.
- Building a KG from the Human Phenotype Ontology (HPO) dataset can be particularly helpful to clinicians, which enables them to make better diagnoses, starting with the analysis of the phenotypic features detected in a patient.
- Kohler, S., Gargano, M., Matentzoglu, N., Carmody, L. C., Lewis-Smith, D., Vasilevsky, N. A., ... & Robinson, P. N. (2021). The human phenotype ontology in 2021. Nucleic acids research, 49(D1), D1207-D1217. https://academic.oup.com/nar/article/49/D1/D1207/6017351?login=true
- Orlandi, F., Graux, D., & O'Sullivan, D. (2021, January). Benchmarking RDF Metadata Representations: Reification, Singleton Property, and RDF. In 2021 IEEE 15th International Conference on Semantic Computing (ICSC) (pp. 233-240). IEEE. https://ieeexplore.ieee.org/abstract/document/9364401/
- Stickle, D., & Turk, J. (1997). A kinetic mass balance model for 1, 5-anhydroglucitol: applications to monitoring of glycemic control. American Journal of Physiology-Endocrinology and Metabolism, 273(4), E821-E830. https://journals.physiology.org/doi/full/10.1152/ajpendo.1997.273.4.E821

 Knowledge Graphs and LLMs in Action ebook for free
