Appendix C. Build knowledge graphs from structured sources
This appendix demonstrates how to build a fit-for-purpose knowledge graph from structured and semi-structured sources, using a biomedical use case that predicts associations between microRNAs and diseases. It follows a CRISP-DM-inspired approach: clarify goals and domain concepts, select minimally sufficient data, iterate on a pragmatic schema, and keep the graph simple enough to reason about while enabling downstream link prediction. Rather than “ingest everything,” it advocates a targeted, incremental strategy that preserves provenance and semantic nuances so that later modeling and analysis are both explainable and extensible.
The construction begins by importing complementary datasets that encode known miRNA–disease links (e.g., HMDD, dbDEMC, miR2Disease), modeling them with distinct relationship types to retain meaning and source traceability. A central challenge—heterogeneous disease naming—is handled through entity normalization with UMLS-driven NLP (via scispaCy), creating dedicated NormalizedDisease nodes to reconcile synonyms without losing original data. The appendix evaluates normalization effects with graph algorithms, showing improved connectivity patterns and shorter miRNA-to-miRNA paths (via WCC and all-pairs shortest paths), which are beneficial for message-passing embeddings and link prediction. It also discusses large language models as an alternative for entity reconciliation, noting their flexibility alongside reproducibility and cost trade-offs.
After establishing a high-quality backbone, the graph is enriched with miRNA-centric knowledge: references and intra-miRNA relations (miRBase), predicted targets with confidence scores (miRDB), and functional similarity scores (MISIM). These additions provide both direct and induced similarity signals that can be probed with Neo4j GDS algorithms (node similarity, filtered similarity) and weighed path metrics such as DWPC to surface plausible disease–target connections (illustrated on celiac disease). The appendix closes with practical guidance: combine multiple curated sources, reconcile and clean entities early, preserve provenance, and validate with lightweight analytics before deploying more complex graph machine learning.
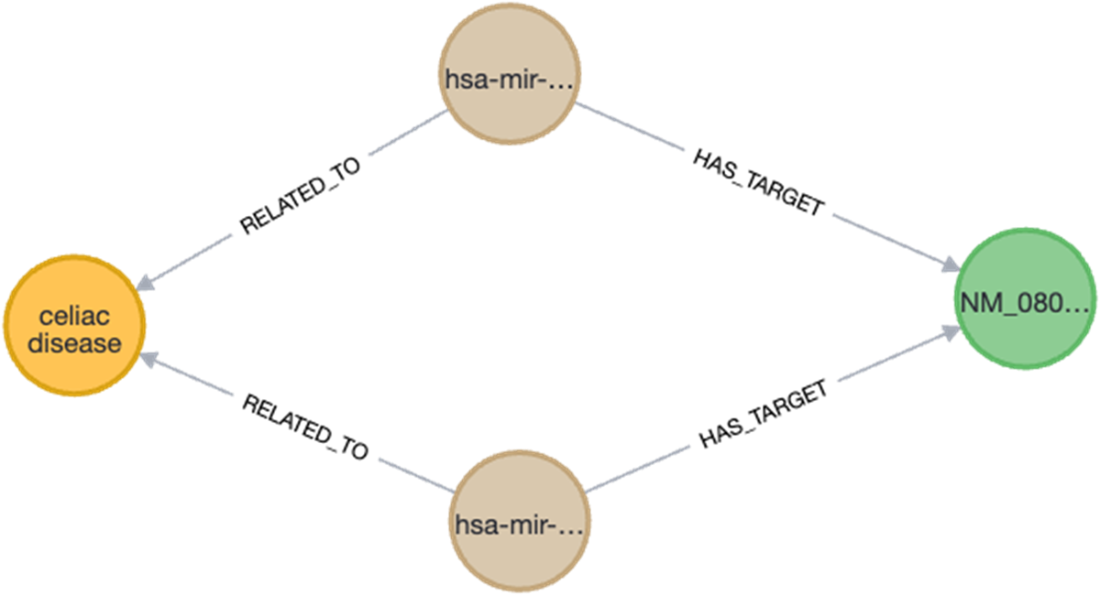
Figure C.1 An example of relationships between a disease, the celiac disease, and the miRNA. Many of these connections are known, but the vast majority must be discovered by clinicians and researchers. Our work in this chapter aims at helping this process.
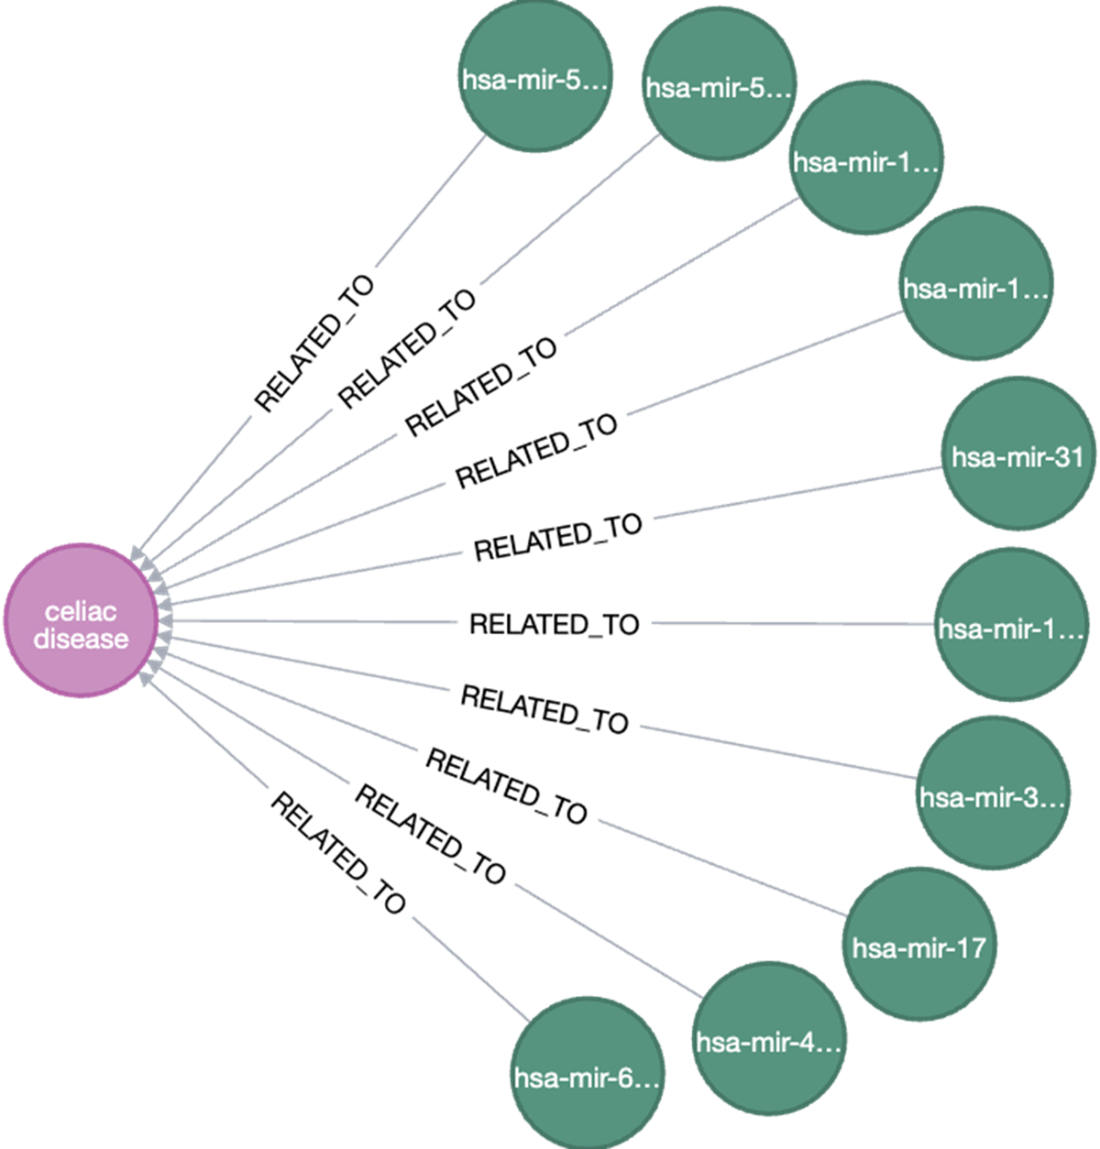
Figure C.2 CRISP-DM Model adapted to Knolwedge Graphs
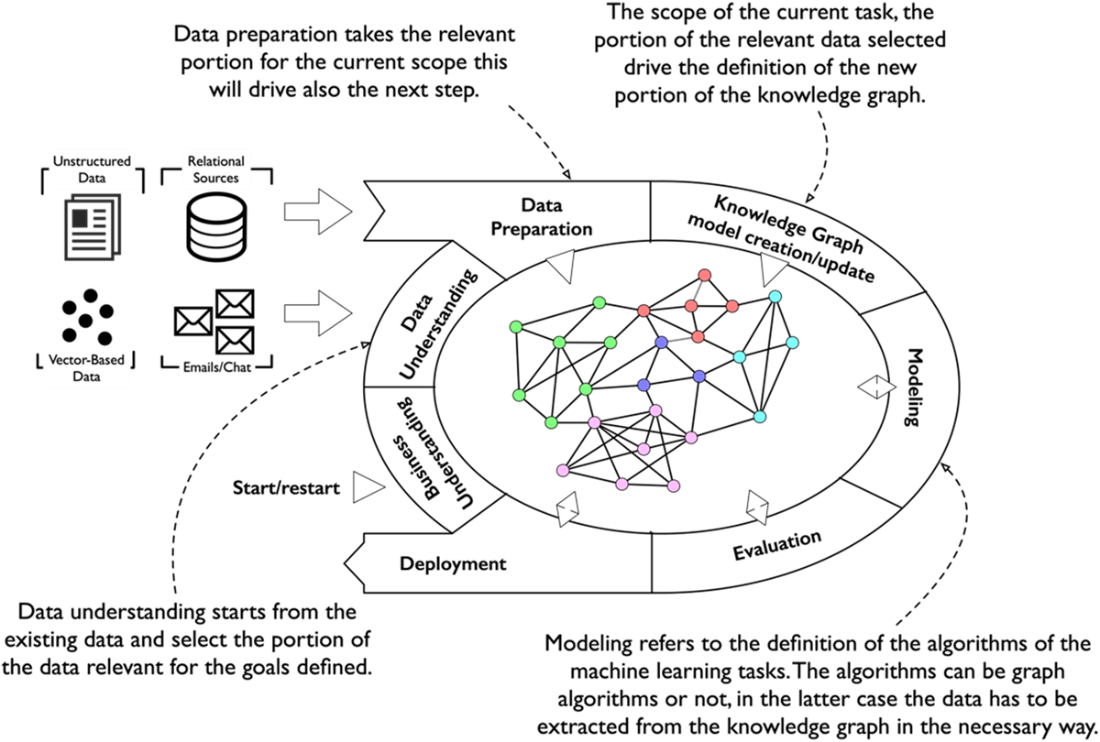
Figure C.3 Information encoded into DNA portions get transcribed into messenger RNA (mRNA) and then translated into amino acid chains that make up the synthesized protein.
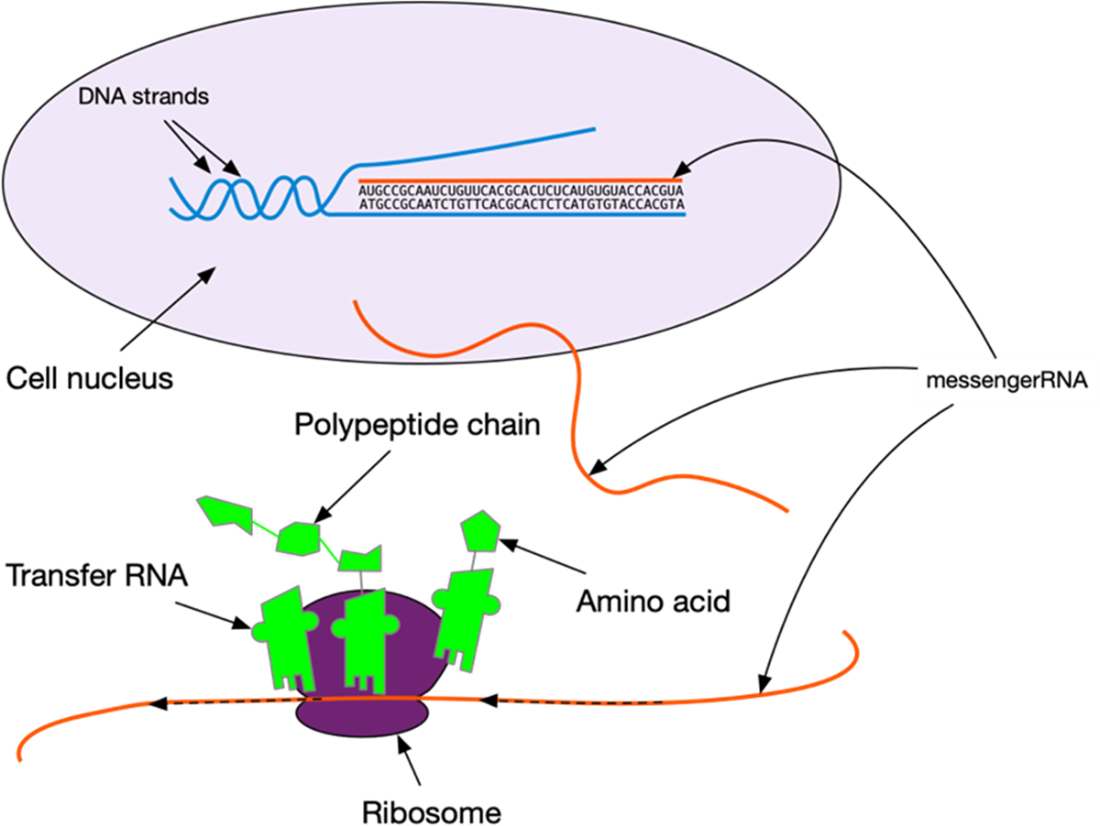
Figure C.4 MiRNA sequences are too small to translate into protein but big enough to target a specific mRNA. When this appends the mRNA cannot flow through the ribosome and the protein synthesis cannot take place.
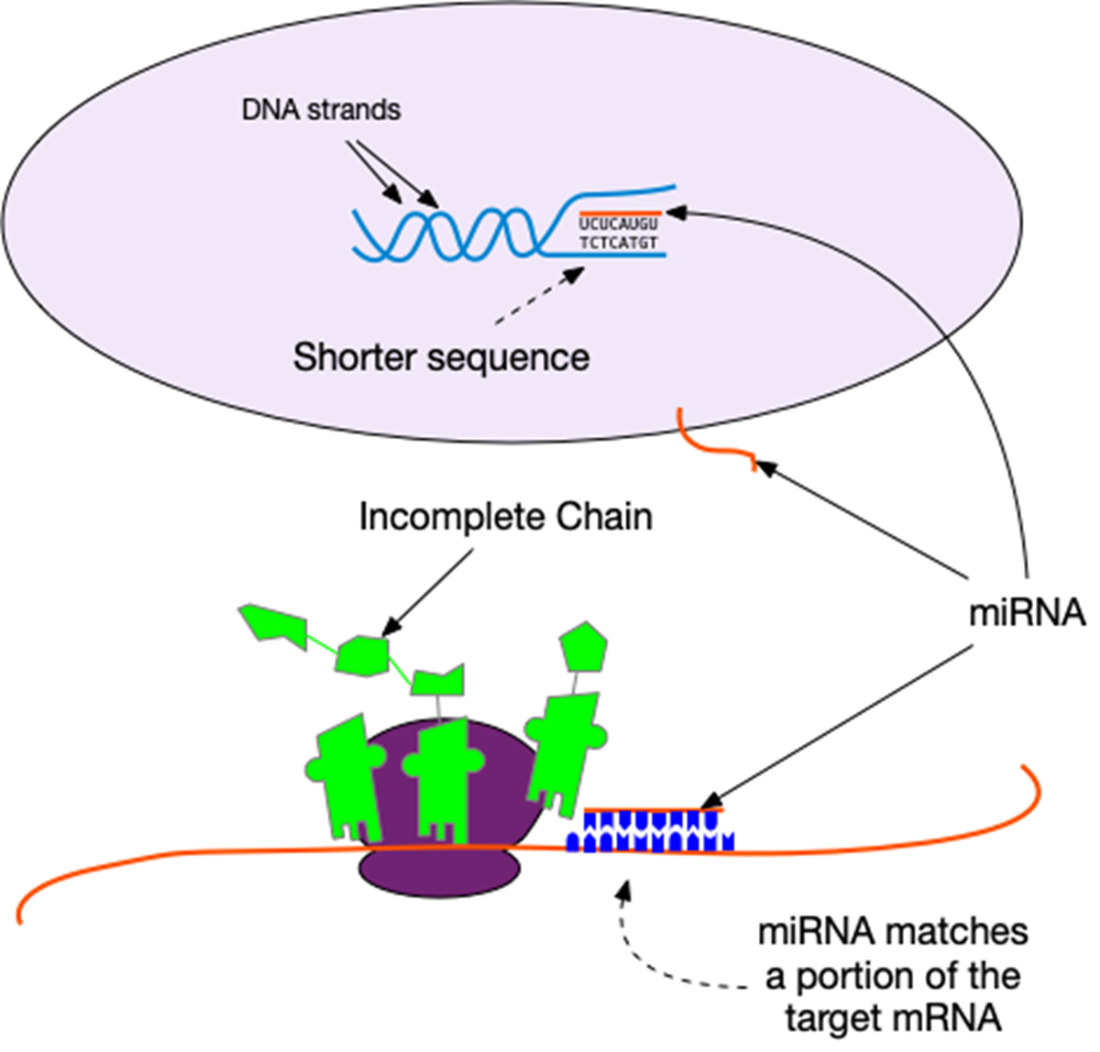
Figure C.5 Datasets A is more balanced and includes reference publications, Datasets B is focused on fewer diseases but includes more miRNA. After the ingestion the information coming from different sources is unified in a single source of truth.
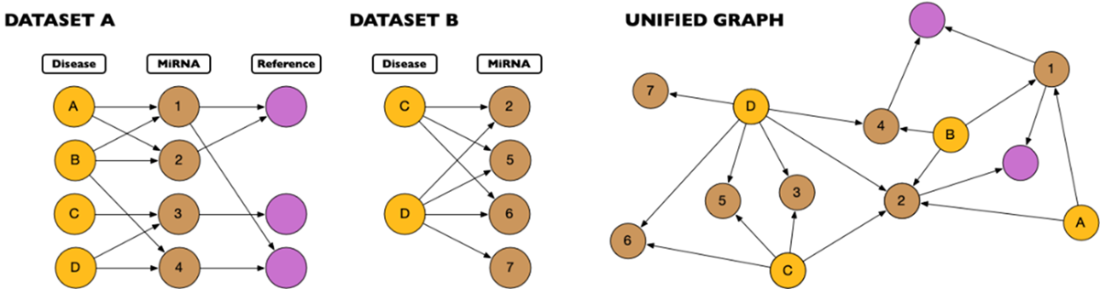
Figure C.6 First iteration target Schema. It contains the type of relationships – REGULATES or RELATED_TO – we would like to predict.
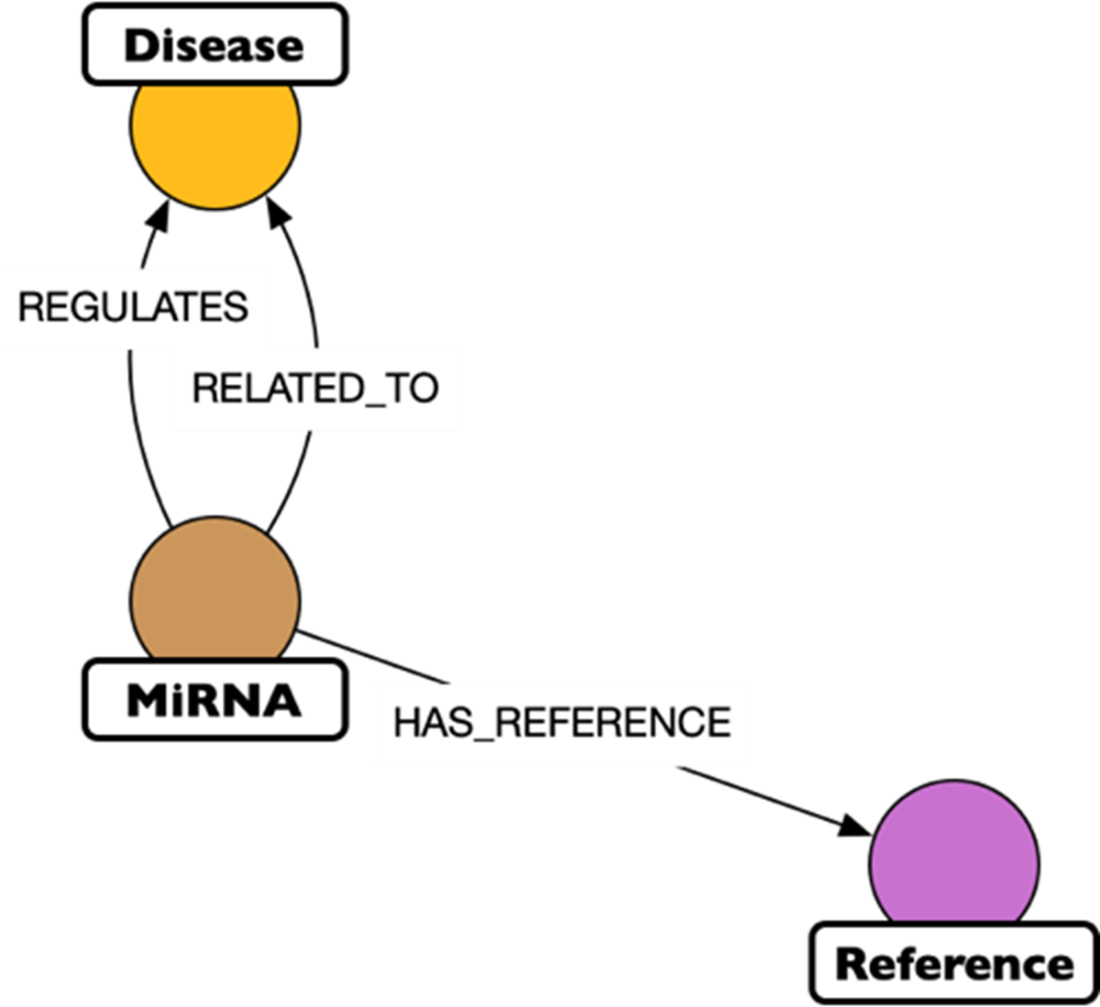
Figure C.7 Record as a graph portion stored in the database.
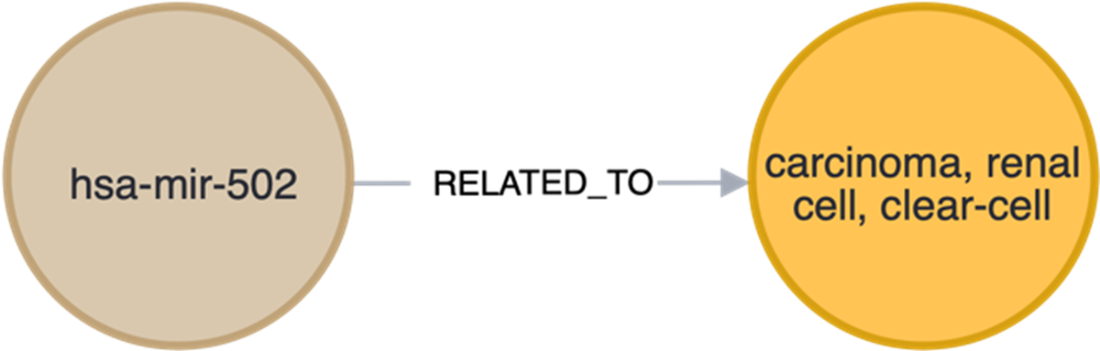
Figure C.8 Merging datasets allows information fusion. We are using two types of relationships for the two databases: RELATED_TO for the HMDD dataset, REGULATES for dbDEMC.
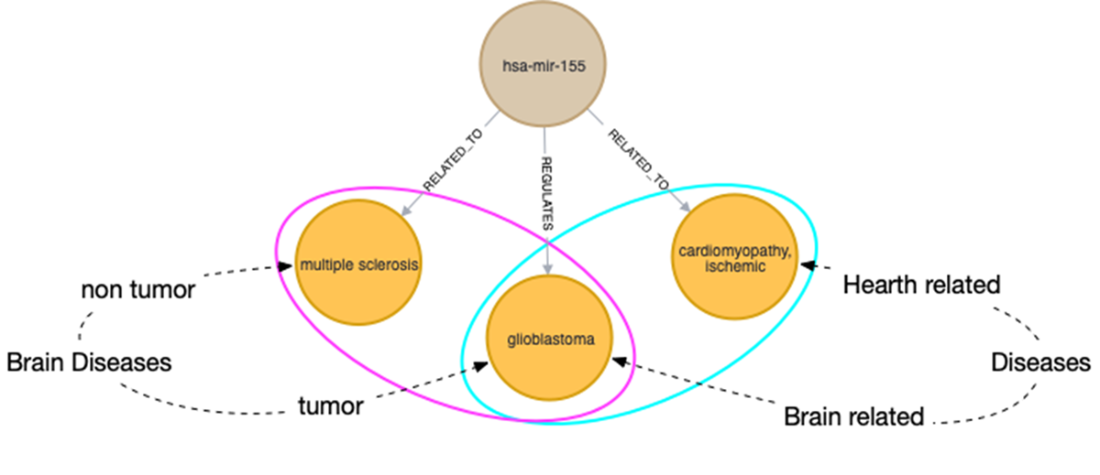
Figure C.9 Venn diagram representing the unique miRNA distribution. It clearly shows the overlapping miRNAs among 2 or three of the datasets.
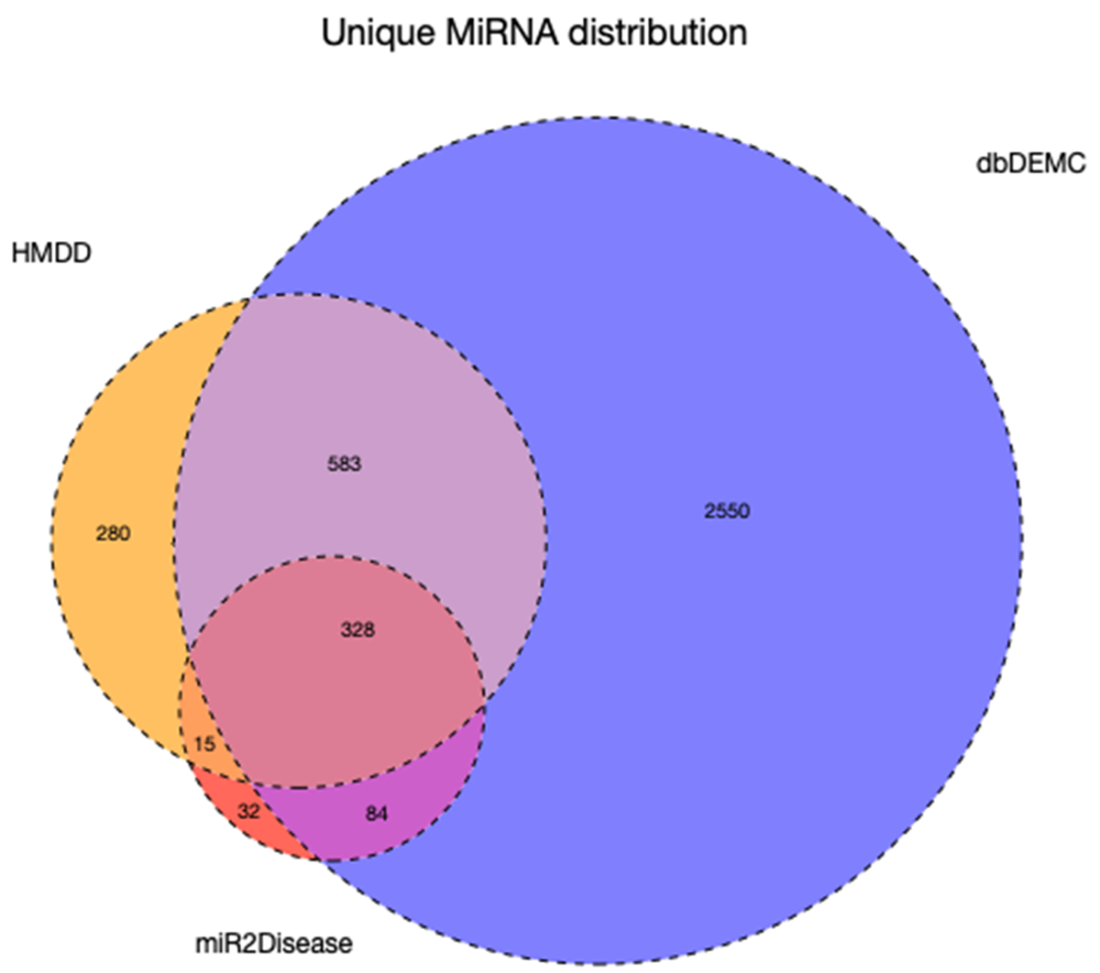
Figure C.10 miRNAs apparently referring to different diseases.
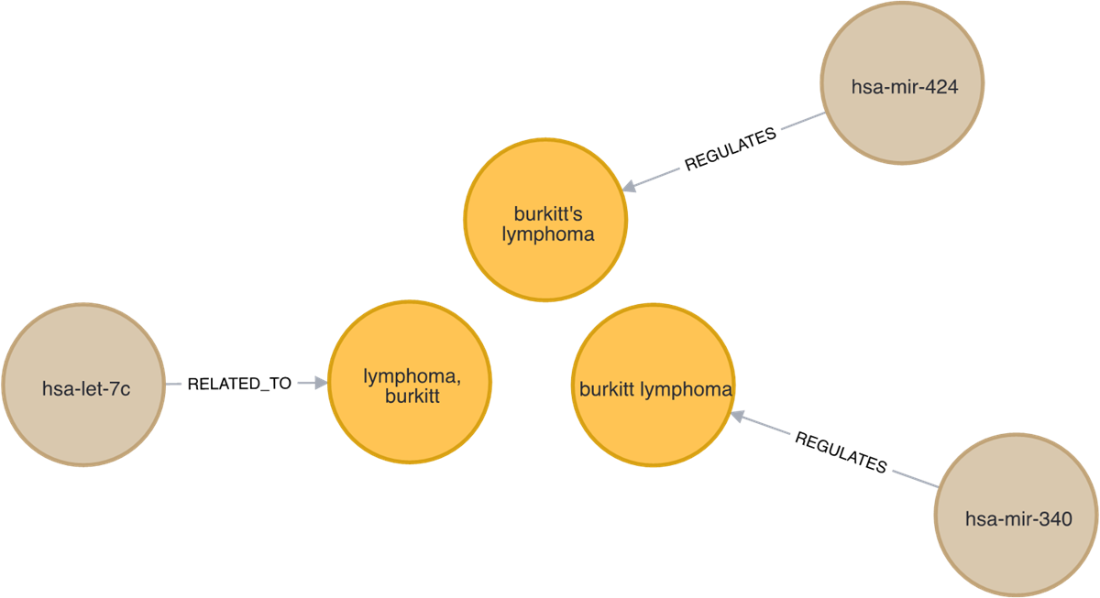
Figure C.11 Update target schema containing normalized Disease.
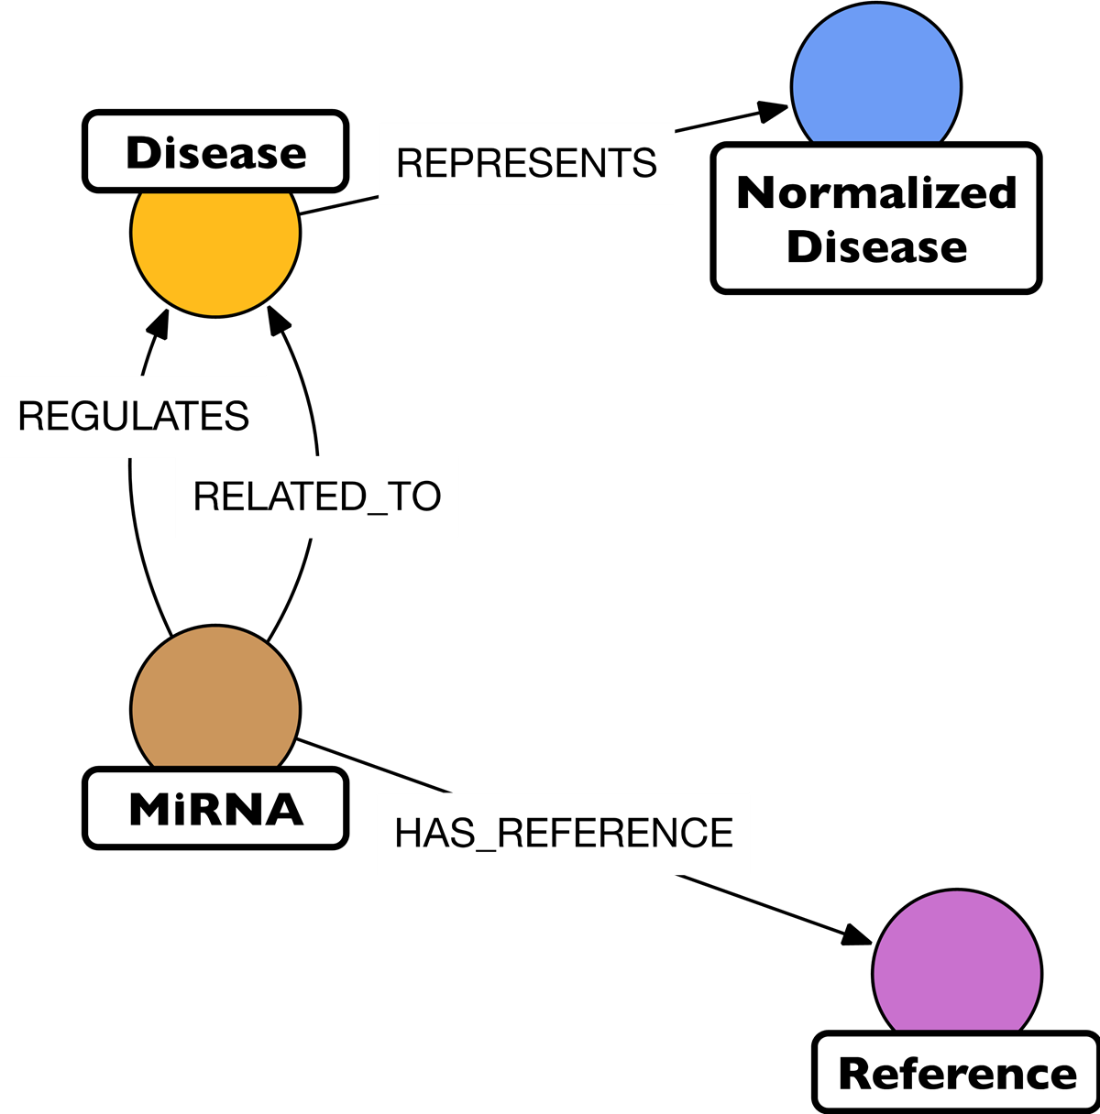
Figure C.12 miRNAs now connected to the through the NormalizedDisease node “Burkitt Lymphoma”.
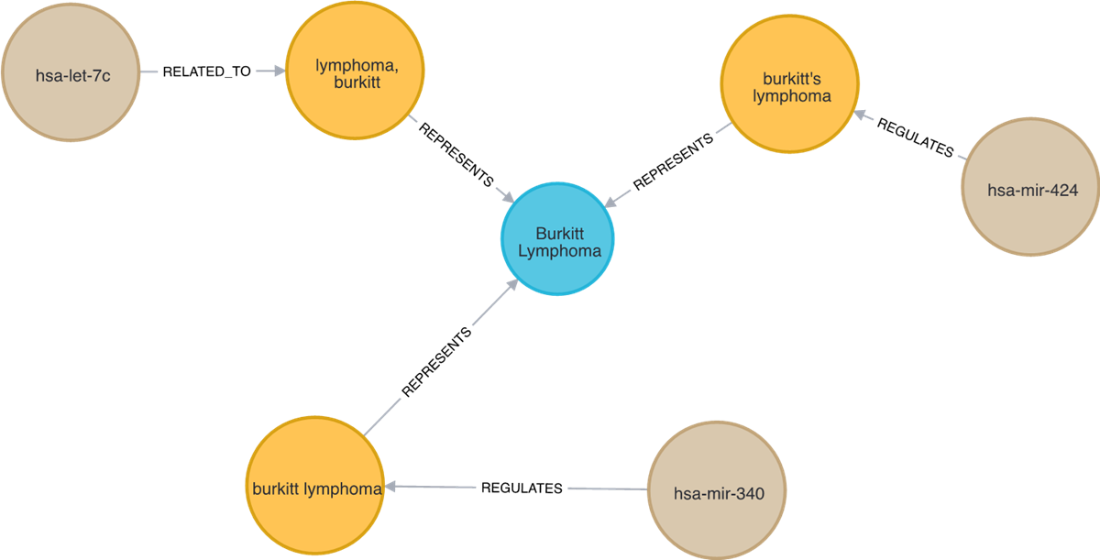
Figure C.13 Chain of miRNAs connected through Disease nodes
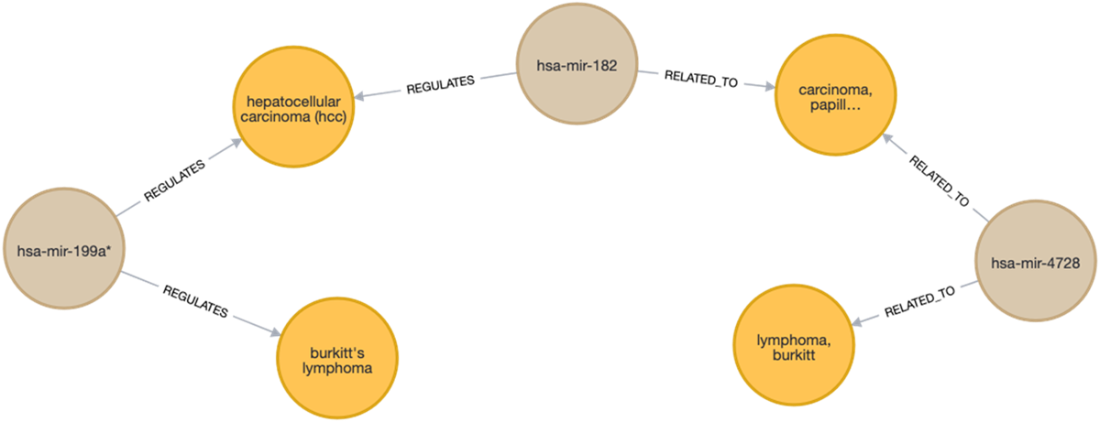
Figure C.14 The same chain of miRNAs in Figure C.13 after the connection through NormalizedDisease nodes.
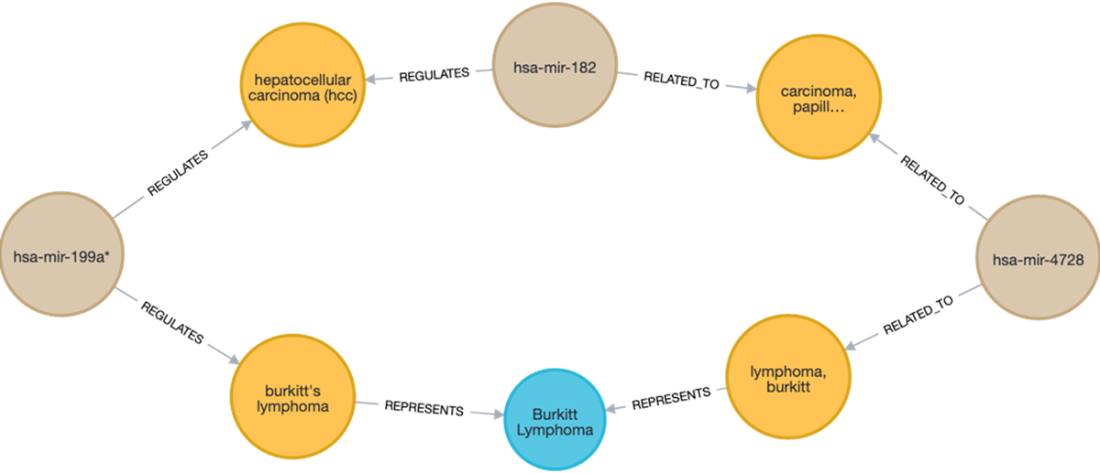
Figure C.15 Updated version of the target schema.
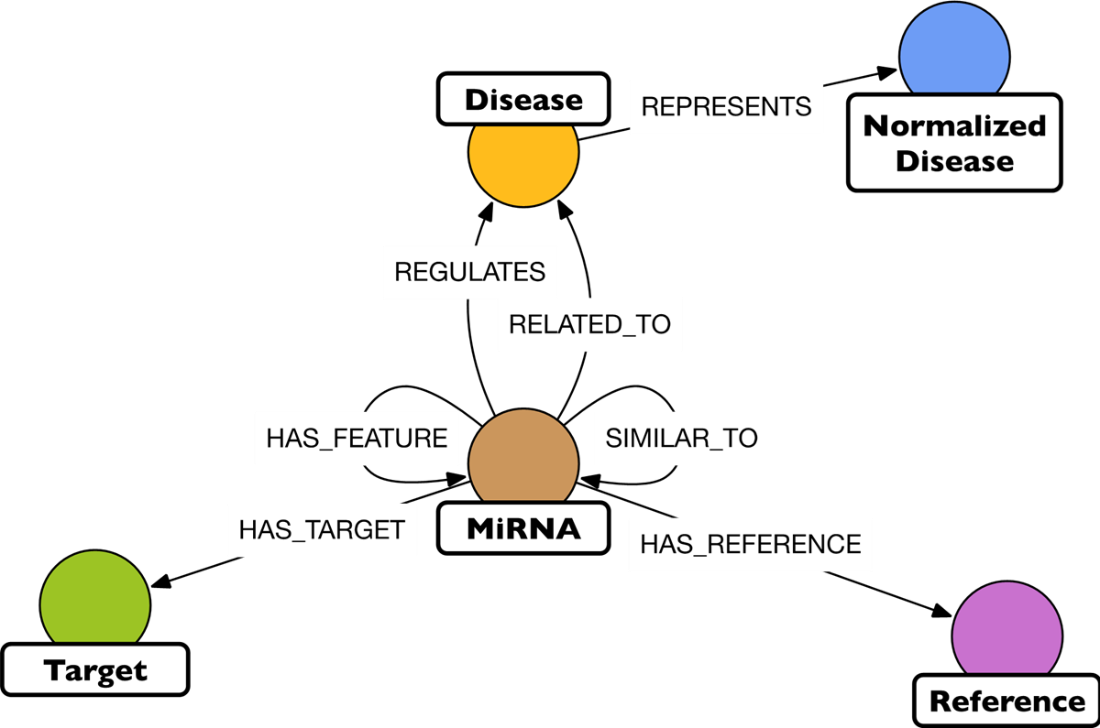
Figure C.16 Example of direct similarity and similarity induced by shared nodes. The model will learn which similarity is most relevant for the link prediction task.
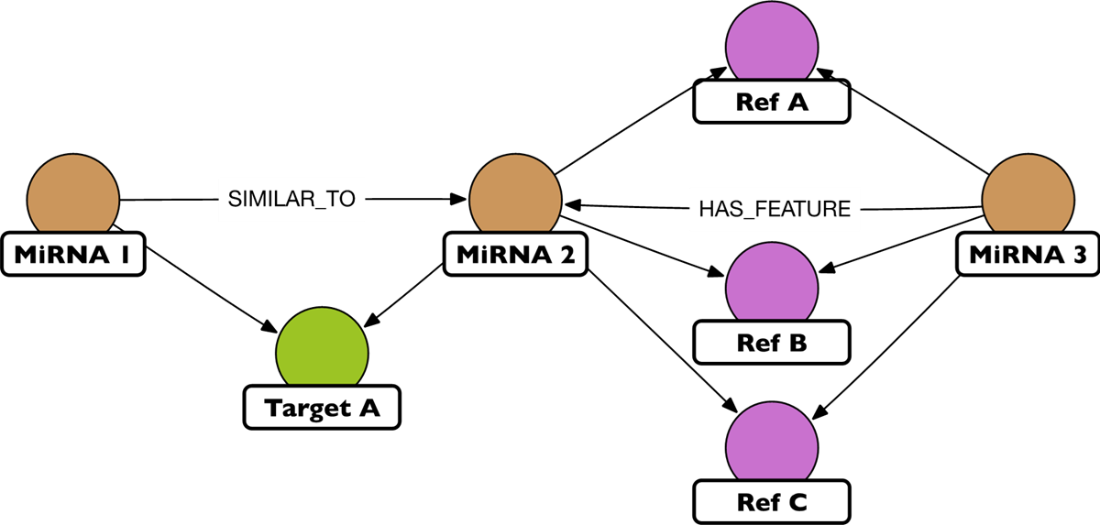
Figure C.17 Same record from miRDB as it is stored in the graph.
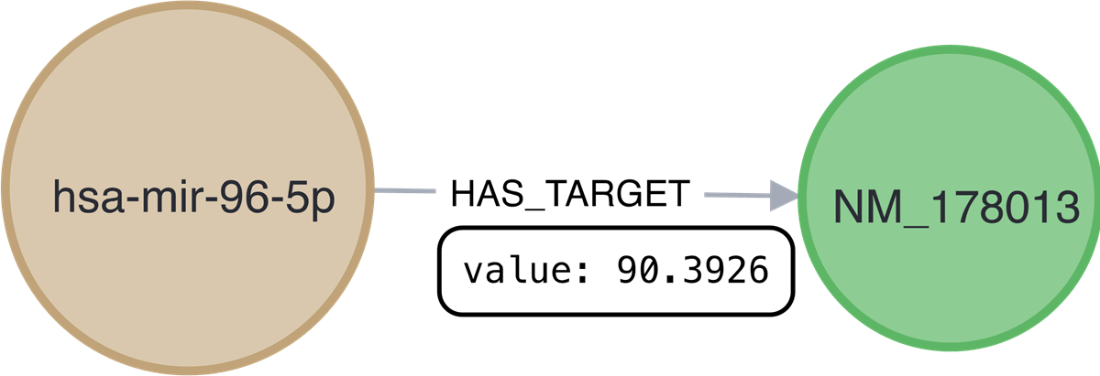
Figure C.18 Same record as it is stored in the graph.
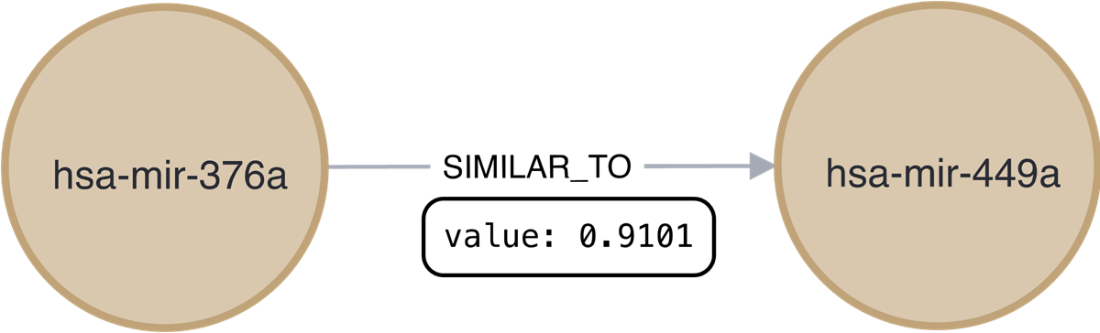
Figure C.19 MiRNA2 is more similar to MiRNA3 as it is to MiRNA1. The thicker the arrow lines, the stronger targets connections
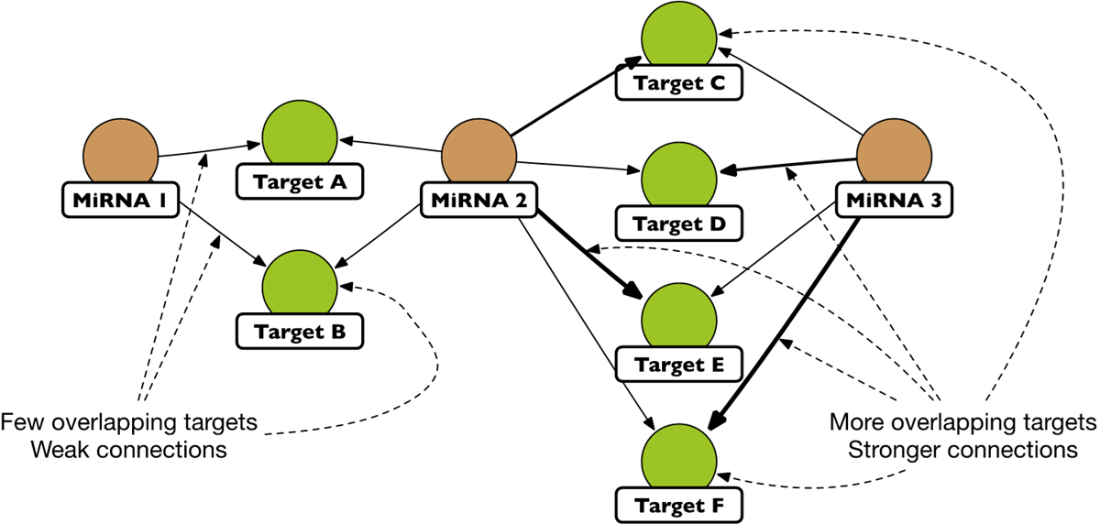
Figure C.20 The topmost result from the similarity computation as it appears in the graph.
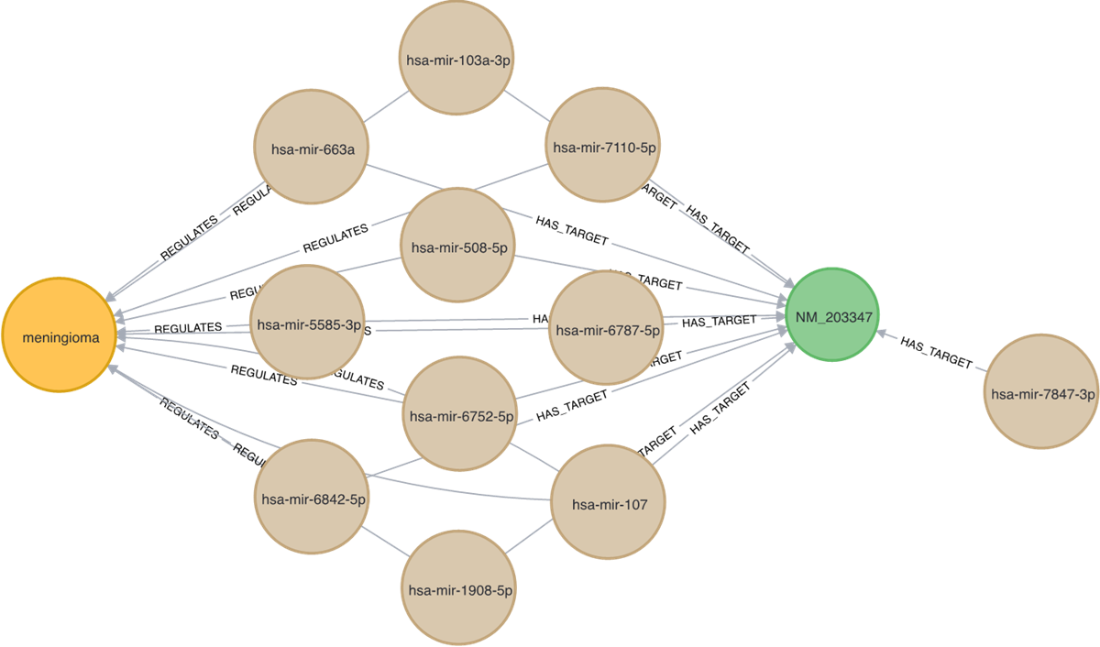
Figure C.21 Paths between the celiac disease and the target NM_080601 that is the first in the results.
C.5 Reference
- Lee, Rosalind C., Rhonda L. Feinbaum, and Victor Ambros. "The C. elegans heterochronic gene lin-4 encodes small RNAs with antisense complementarity to lin-14." cell 75.5 (1993): 843-854.
- Jonas, Stefanie, and Elisa Izaurralde. "Towards a molecular understanding of microRNA-mediated gene silencing." Nature reviews genetics 16.7 (2015): 421-433.
- Chen, Xing, et al. "RBMMMDA: predicting multiple types of disease-microRNA associations." Scientific reports 5.1 (2015): 13877.
- Bartel, David P. "MicroRNAs: target recognition and regulatory functions." cell 136.2 (2009): 215-233.
- Miska, Eric A. "How microRNAs control cell division, differentiation and death." Current opinion in genetics & development 15.5 (2005): 563-568.
- Cheng, Angie M., et al. "Antisense inhibition of human miRNAs and indications for an involvement of miRNA in cell growth and apoptosis." Nucleic acids research 33.4 (2005): 1290-1297.
- Cui, Qinghua, et al. "Principles of microRNA regulation of a human cellular signaling network." Molecular systems biology 2.1 (2006): 46.
- Chen, Xing, Ming-Xi Liu, and Gui-Ying Yan. "RWRMDA: predicting novel human microRNA–disease associations." Molecular BioSystems 8.10 (2012): 2792-2798.
- Chen, Xing, and Gui-Ying Yan. "Semi-supervised learning for potential human microRNA-disease associations inference." Scientific reports 4.1 (2014): 5501.
- Li, Jingjing, et al. "Evidence for positive selection on a number of microRNA regulatory interactions during recent human evolution." PLoS genetics 8.3 (2012): e1002578.
- Chen, Kevin, and Nikolaus Rajewsky. "Natural selection on human microRNA binding sites inferred from SNP data." Nature genetics 38.12 (2006): 1452-1456.
- Saunders, Matthew A., Han Liang, and Wen-Hsiung Li. "Human polymorphism at microRNAs and microRNA target sites." Proceedings of the National Academy of Sciences 104.9 (2007): 3300-3305.
- Sethupathy, Praveen, and Francis S. Collins. "MicroRNA target site polymorphisms and human disease." Trends in genetics 24.10 (2008): 489-497.
- Deng, Su-Ping, Lin Zhu, and De-Shuang Huang. "Predicting hub genes associated with cervical cancer through gene co-expression networks." IEEE/ACM Transactions on Computational Biology and Bioinformatics 13.1 (2015): 27-35.
- Deng, Su-Ping, Lin Zhu, and De-Shuang Huang. "Mining the bladder cancer-associated genes by an integrated strategy for the construction and analysis of differential co-expression networks." BMC genomics. Vol. 16. No. 3. BioMed Central, 2015.
- Eulalio, Ana, Eric Huntzinger, and Elisa Izaurralde. "Getting to the root of miRNA-mediated gene silencing." Cell 132.1 (2008): 9-14.
- Ambros, Victor. "The functions of animal microRNAs." Nature 431.7006 (2004): 350-355.
- Chen, Xing, et al. "MicroRNAs and complex diseases: from experimental results to computational models." Briefings in bioinformatics 20.2 (2019): 515-539.5.1.3
- Lukasik, Anna, Maciej Wójcikowski, and Piotr Zielenkiewicz. "Tools4miRs–one place to gather all the tools for miRNA analysis." Bioinformatics 32.17 (2016): 2722-2724.
- Lu, Ming, et al. "An analysis of human microRNA and disease associations." PloS one 3.10 (2008): e3420.
- Li, Yang, et al. "HMDD v2. 0: a database for experimentally supported human microRNA and disease associations." Nucleic acids research 42.D1 (2014): D1070-D1074.
- Huang, Zhou, et al. "HMDD v3. 0: a database for experimentally supported human microRNA–disease associations." Nucleic acids research 47.D1 (2019): D1013-D1017.
- Xu, Feng, et al. "dbDEMC 3.0: functional exploration of differentially expressed miRNAs in cancers of human and model organisms." Genomics, Proteomics & Bioinformatics 20.3 (2022): 446-454.
- Jiang, Qinghua, et al. "miR2Disease: a manually curated database for microRNA deregulation in human disease." Nucleic acids research 37.suppl_1 (2009): D98-D104.5.2.2
- Bodenreider, Olivier. "The unified medical language system (UMLS): integrating biomedical terminology." Nucleic acids research 32.suppl_1 (2004): D267-D270.
- Kozomara, Ana, Maria Birgaoanu, and Sam Griffiths-Jones. "miRBase: from microRNA sequences to function." Nucleic acids research 47.D1 (2019): D155-D162.
- Kozomara, Ana, and Sam Griffiths-Jones. "miRBase: annotating high confidence microRNAs using deep sequencing data." Nucleic acids research 42.D1 (2014): D68-D73.
- Kozomara, Ana, and Sam Griffiths-Jones. "miRBase: integrating microRNA annotation and deep-sequencing data." Nucleic acids research 39.suppl_1 (2010): D152-D157.
- Griffiths-Jones, Sam, et al. "miRBase: microRNA sequences, targets and gene nomenclature." Nucleic acids research 34.suppl_1 (2006): D140-D144.
- Chen, Yuhao, and Xiaowei Wang. "miRDB: an online database for prediction of functional microRNA targets." Nucleic acids research 48.D1 (2020): D127-D131.
- Liu, Weijun, and Xiaowei Wang. "Prediction of functional microRNA targets by integrative modeling of microRNA binding and target expression data." Genome biology 20 (2019): 1-10.
- Kern, Fabian, et al. "miRTargetLink 2.0—interactive miRNA target gene and target pathway networks." Nucleic acids research 49.W1 (2021): W409-W416.
- Li, Jianwei, et al. "MISIM v2. 0: a web server for inferring microRNA functional similarity based on microRNA-disease associations." Nucleic acids research 47.W1 (2019): W536-W541.
- Spalinger, Marianne R., et al. "Role of protein tyrosine phosphatases in regulating the immune system: implications for chronic intestinal inflammation." _Inflammatory bowel diseases_ 21.3 (2015): 645-655.
- Yao, Ying, et al. "Differential expression profile of gluten-specific T cells identified by single-cell RNA-seq." _Plos one_ 16.10 (2021): e0258029.

 Knowledge Graphs and LLMs in Action ebook for free
