Appendix A. Introduction to graphs
This appendix offers a concise, high-level introduction to graphs as simple yet powerful structures for representing relationships. It frames graphs as the mathematical backbone of networks found across many domains—from social and information systems to communication and transportation—and highlights why their visual and analytical expressiveness makes them ideal for uncovering patterns. Combining graph algorithms, visualization, and machine learning can reveal structure and behavior that are difficult to detect with traditional tools, as illustrated by real-world investigations and market analyses.
The text defines a graph as a set of vertices connected by edges and reviews key variations and properties. It distinguishes directed from undirected graphs and unweighted from weighted graphs, then introduces core notions such as adjacency, incident edges, complete graphs, and vertex degree (including in-degree and out-degree for directed graphs). It also covers paths, simple paths, and cycles. Moving from abstract graphs to networks, it shows how adding semantics to vertices and edges lets the same structure model different real systems, and it discusses how external forces and principles like homophily shape network evolution, with implications for tasks such as viral diffusion, prediction, and recommendations.
Finally, the appendix presents the two standard graph representations used in computation: adjacency lists and adjacency matrices. Adjacency lists store each vertex’s neighbors and are space-efficient for sparse graphs, easily extended to handle weights, and well-suited to dynamic updates; their memory use grows with the number of vertices plus edges. Adjacency matrices record edge presence (or weights) in a square matrix indexed by vertices, make edge existence checks and in-/outbound inspection straightforward, and are symmetric for undirected graphs; they require memory that grows with the square of the number of vertices. The choice between them depends on graph density, the operations needed, and practicality.
Figure A.1 The bridges in Königsberg, Russia that led Leonhard Euler to the invention of graph theory in 1736
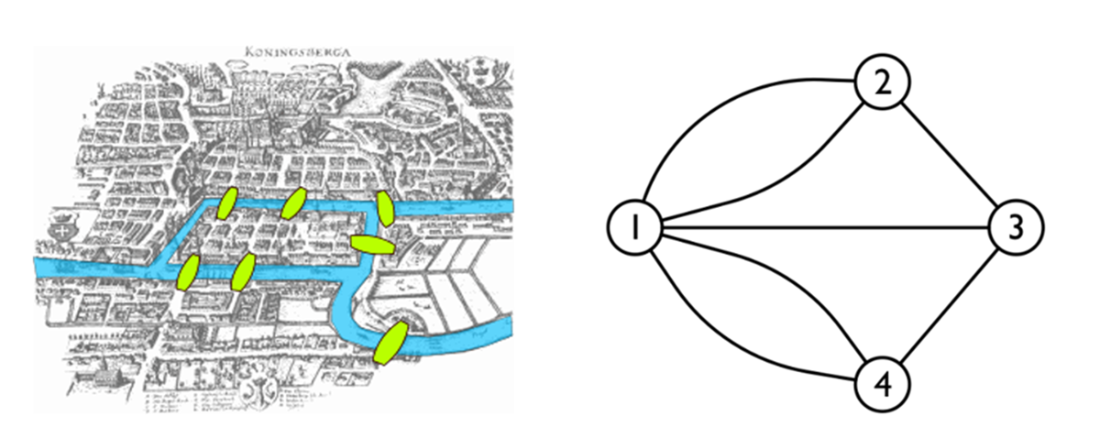
Figure A.2 The undirected graph on V = {1, 2, 3, 4, 5} with the edge set as E = {(1,2), (1,5), (2,5), (2,4), (4,3)}
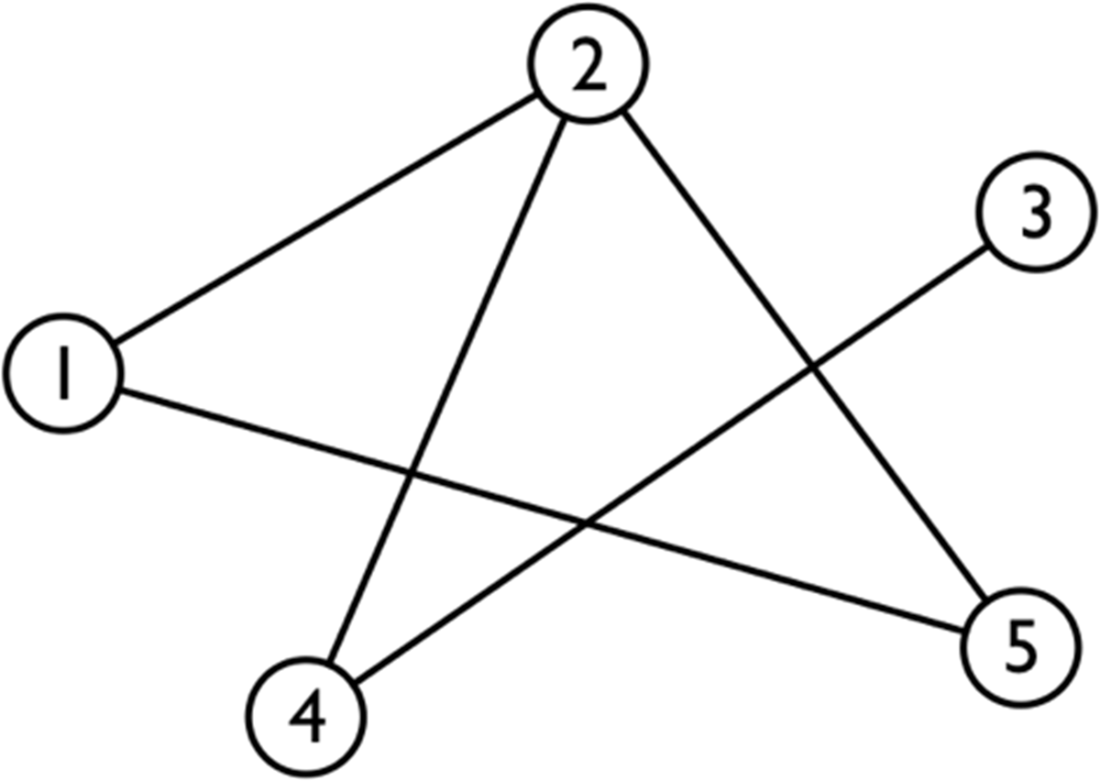
Figure A.3 The directed graph on V = {1, …, 5} with the edge set as E = {(1,2), (2,5), (5,1), (2,4), (3,4)}
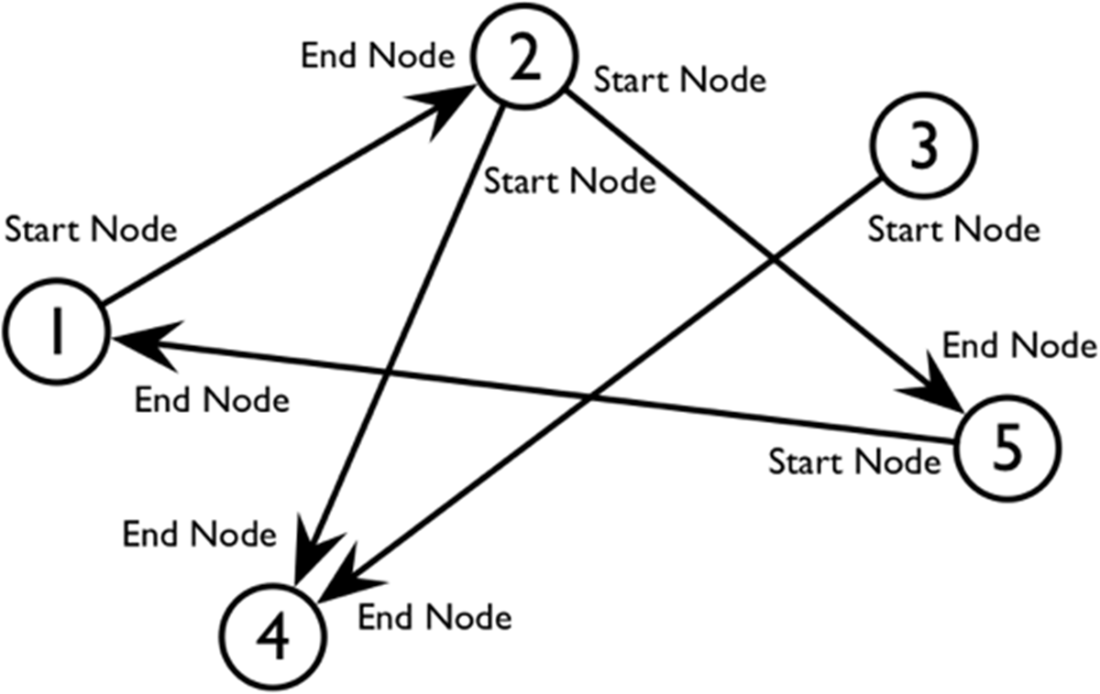
Figure A.4 An undirected weighted graph (a) and a directed weighted graph (b)
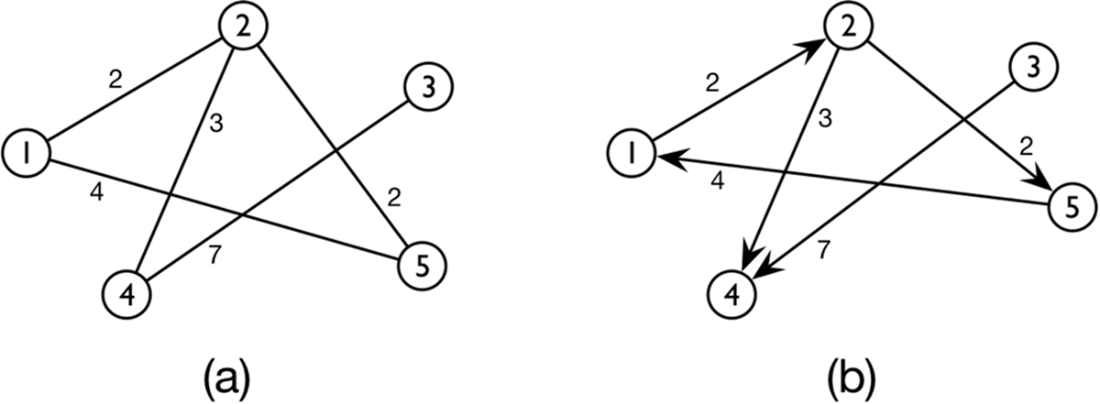
Figure A.5 A complete graph, where each vertex is connected to all the others
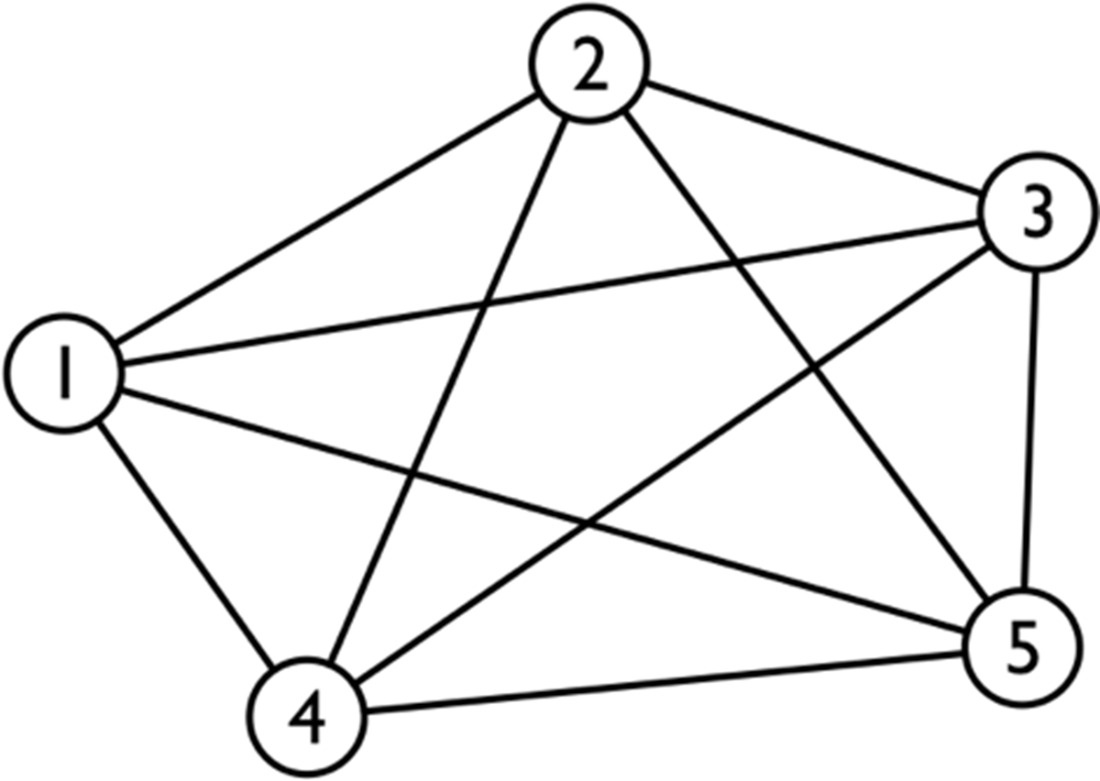
Figure A.6 A nontrivial generic graph
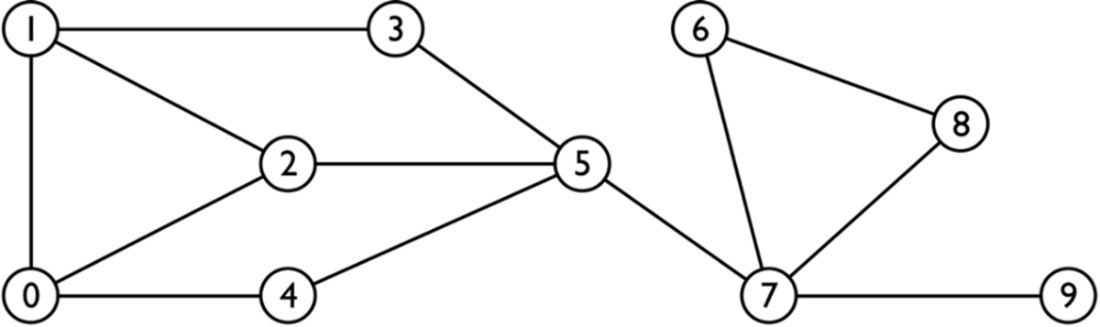
Figure A.7 Clockwise from top left: co-occurrence network (https://en.wikipedia.org/wiki/Co-occurrence_network), ARPA network 1974 (https://en.wikipedia.org/wiki/ARPANET), London Tube network (https://tfl.gov.uk/tfl/syndication/widgets/tubemap/default-search.html), and electrical grid (https://en.wikipedia.org/wiki/Electrical_grid)
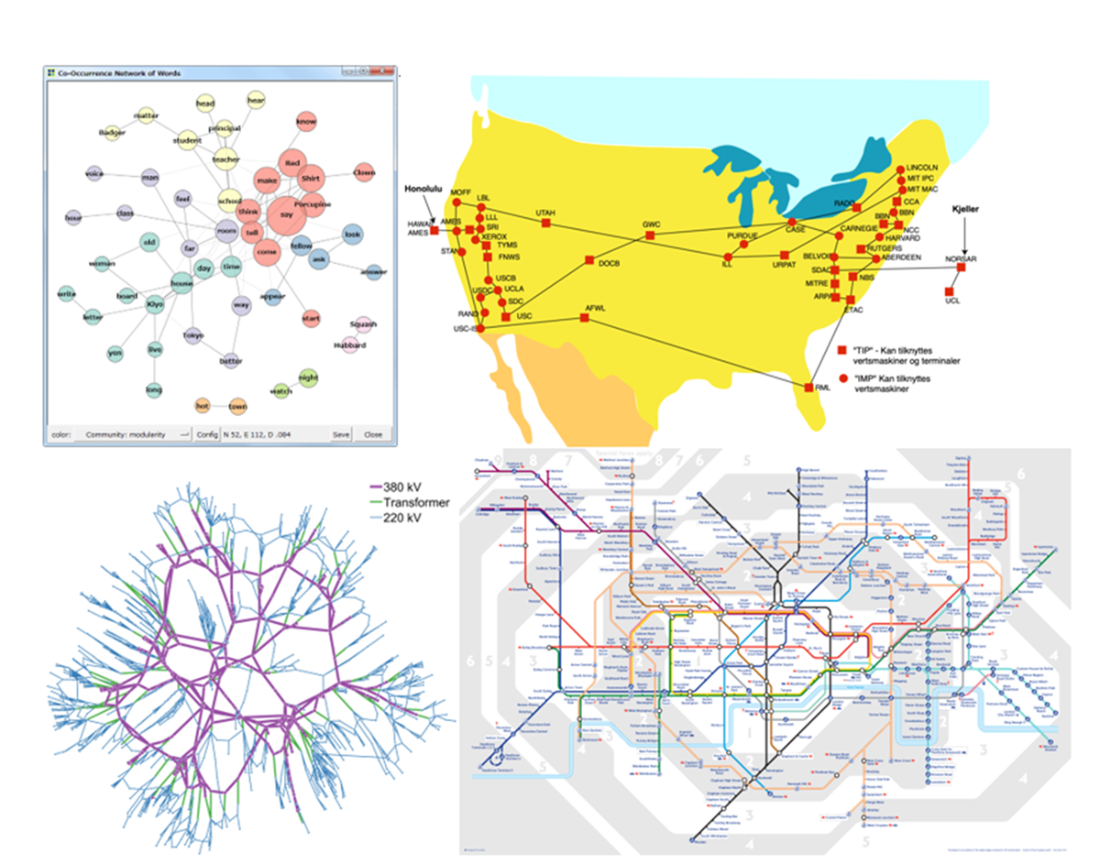
Figure A.8 An example of the graph visualization for the Panama Papers
Figure A.9 Network map of US political books in 2008 [4]
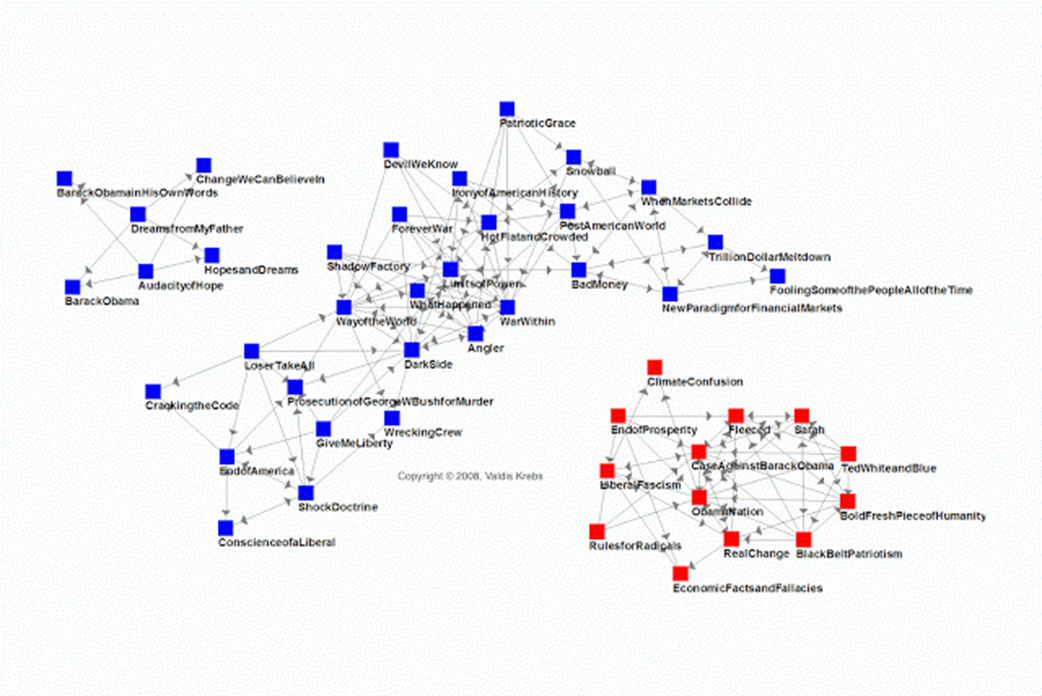
Figure A.10 Network map of US political books in 2012 [4]
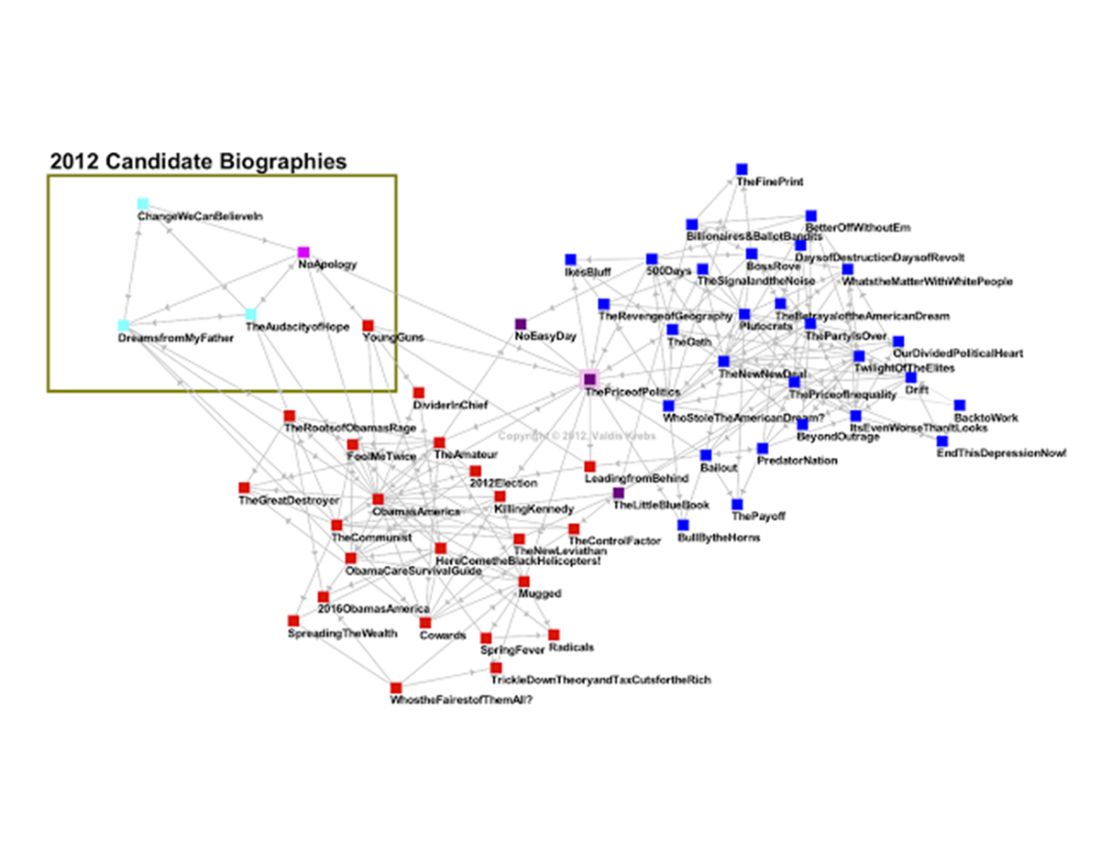
Figure A.11 An undirected graph (a) and the related representation as an adjacency list (b)
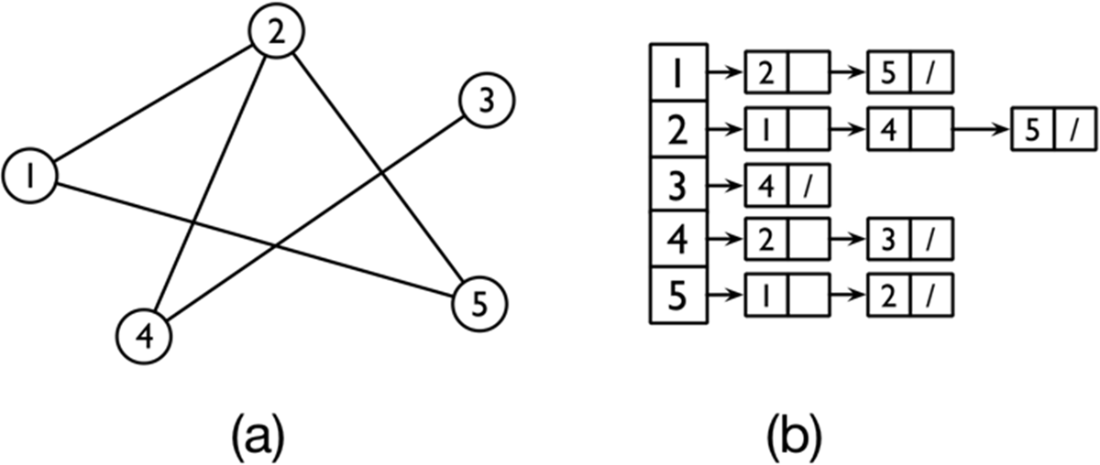
Figure A.12 A directed graph (a) and the related representation as an adjacency list (b)
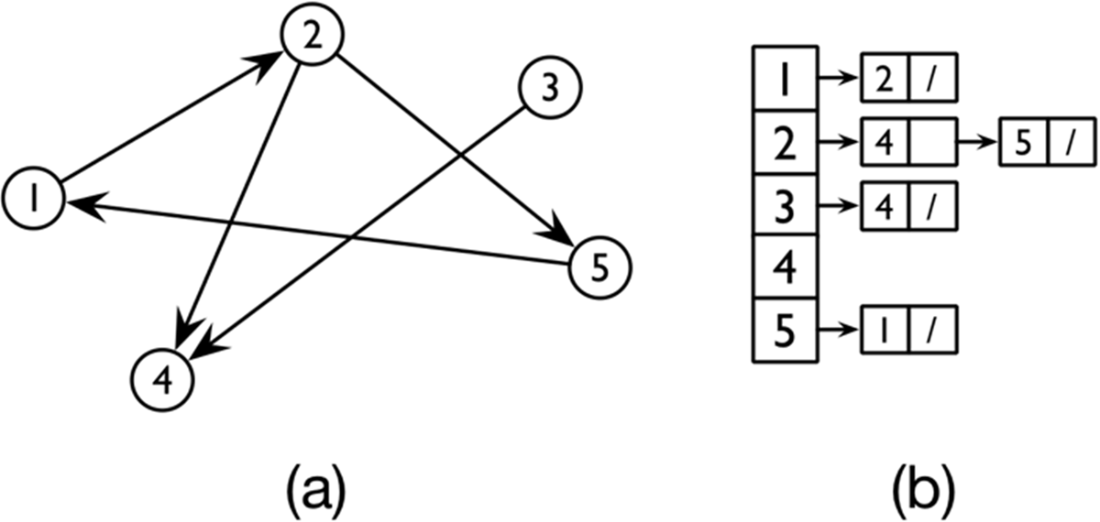
Figure A.13 An undirected graph (a) and the related representation as an adjacency matrix (b)
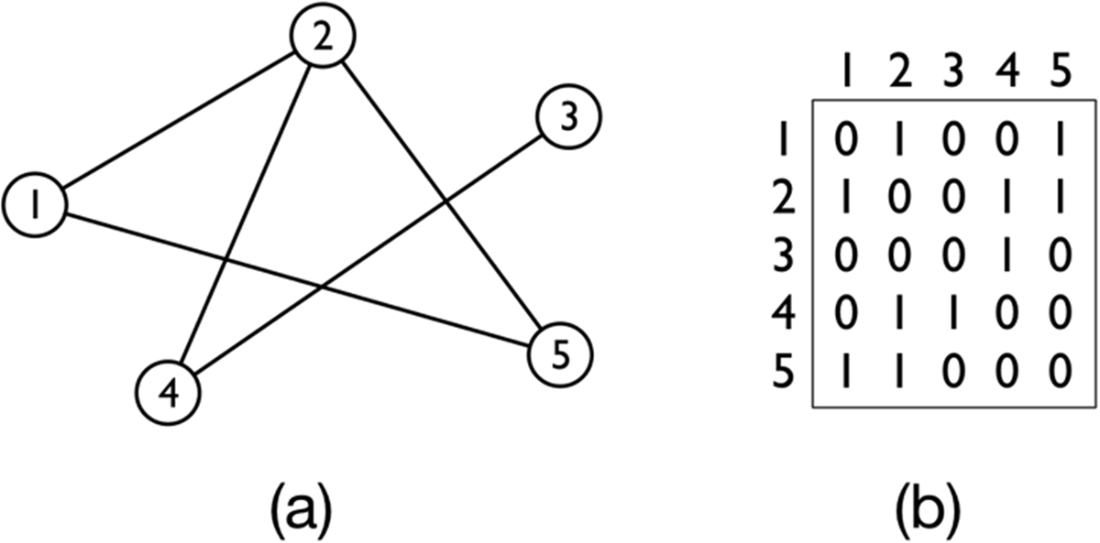
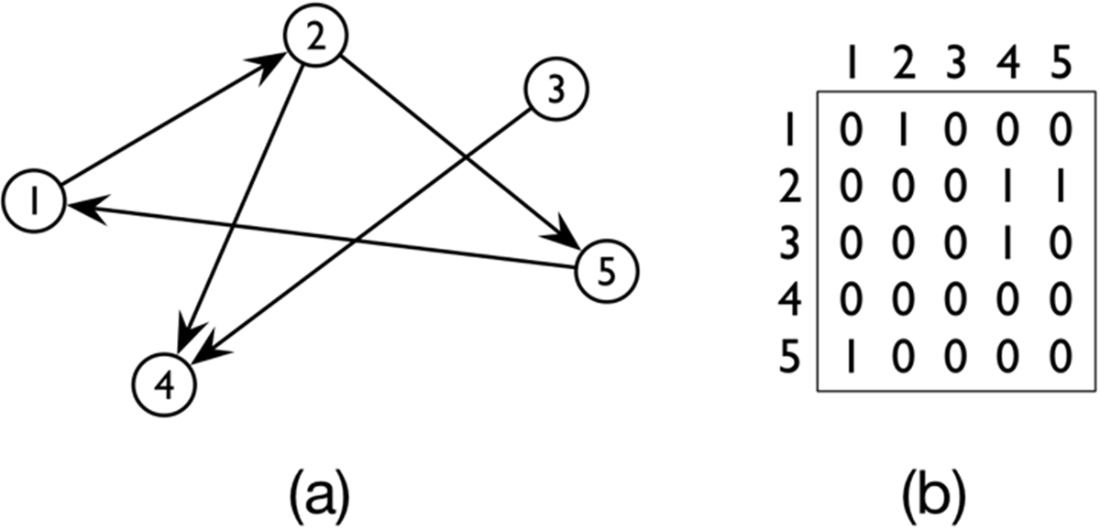
Figure A.14 A directed graph (a) and the related representation as an adjacency matrix (b)
FAQ
What is a graph?
A graph is a mathematical data structure made of a set of vertices (nodes) and edges (links) that model relationships among objects. Formally, a graph G = (V, E) has vertices V and edges E between pairs of vertices. The concept traces back to Euler’s 1736 solution to the Seven Bridges of Königsberg problem.How do directed and undirected graphs differ?
In a directed graph, each edge has a direction and can be traversed only from its start node (tail) to its end node (head). In an undirected graph, edges have no direction and can be traversed both ways. Many real-world systems can be modeled either way, depending on whether the relation is inherently one-way (e.g., a hyperlink) or mutual (e.g., friendship).What are weighted and unweighted graphs?
Unweighted graphs treat all edges as equal. Weighted graphs assign a numeric value (weight) to each edge to encode significance such as cost, distance, capacity, or strength of connection. Algorithms can use these weights to find, for example, the least-cost path.What do adjacency, incidence, and complete graph mean?
- Two vertices are adjacent (neighbors) if there is an edge between them.- An edge is incident on the two vertices it connects.
- A complete graph is one where every pair of distinct vertices is connected by an edge.
What is the degree of a vertex, and how are in-degree and out-degree defined?
- In an undirected graph, the degree of a vertex is the number of incident edges (equivalently, number of neighbors).- In a directed graph, in-degree counts incoming edges; out-degree counts outgoing edges.
- The average degree is the sum of all vertex degrees divided by the number of vertices.
What are paths, simple paths, and cycles?
A path is a sequence of vertices where each consecutive pair is connected by an edge. A simple path has no repeated vertices. A cycle is a path whose first and last vertex are the same.How are graphs used as models of real-world networks?
When vertices and edges are given semantics (names and meanings), a graph becomes a network model of a real system. The same abstract graph can model different domains by changing semantics, for example:- Social networks (people and their relationships)
- Informational networks (web pages and hyperlinks, papers and citations)
- Communication networks (devices and links)
- Transportation networks (cities and routes)
Why are graphs powerful for analysis and visualization?
Graphs are highly communicative “information maps.” They help reveal clusters, bridges, and complex patterns that are hard to see in tabular data. Real-world investigations (e.g., the Panama Papers) and market analyses (e.g., political book “also-bought” networks) use graph algorithms and visualization to surface hidden structures.What is homophily, and why does it matter?
Homophily (“love of the same”) is the tendency for links in social networks to form between similar individuals. It influences how networks evolve and is useful in machine learning tasks such as recommendations—especially for cold start cases where a new user can be served suggestions based on similar connected users.How are graphs represented for computation: adjacency lists vs. adjacency matrices?
- Adjacency list: for each vertex u, store a list of adjacent vertices v. Space is proportional to |V| + |E|; ideal for sparse graphs; easy to extend with edge weights.- Adjacency matrix: a |V| × |V| matrix A where A[u,v] = 1 (or a weight) if an edge exists, else 0. Space is proportional to |V|²; faster to test if an edge exists; convenient for small or dense graphs. Both representations work for directed and undirected graphs; choose based on density, memory, and access patterns.

 Knowledge Graphs and LLMs in Action ebook for free
