9 Garbage Collection
This chapter reframes JavaScript memory management as a performance issue rather than a safety issue. Because the ECMAScript specification says almost nothing about garbage collection, engines are free to implement it very differently, but your code still pays the cost in latency. The key lesson is that allocation itself is usually cheap in modern engines; what matters is how long objects stay reachable. Objects that die young are easy for the collector to reclaim, while objects that survive longer, especially through closures, timers, promises, or caches, create more work and can lead to pauses, throughput loss, and visible slowdowns.
The chapter first explains the basic idea of tracing garbage collection and why it replaced simple reference counting. Tracing begins from roots and follows references outward, so circular references are not a problem as long as nothing in the root set can still reach them. It then walks through V8’s generational collector: a young generation collected by the Scavenger through copying and compaction, and an old generation handled with marking, sweeping, and occasional compaction. V8 uses incremental and concurrent marking to reduce pauses, write barriers and remembered sets to track cross-generation references, and idle-time collection in browsers to hide work when the main thread is free. Trace output from Node.js shows how healthy programs stay mostly in cheap scavenges, while leaks push objects into old space and trigger increasingly expensive mark-compact cycles.
The chapter also compares V8 with JavaScriptCore’s Riptide collector, which avoids moving objects and instead uses sticky mark bits, lazy sweeping, and a retreating wavefront barrier. That design trades copying and compaction costs for fragmentation and different failure modes, including a “death spiral” when heavy mutation of old objects keeps forcing rescans. Across both engines, the practical guidance is the same: reduce unnecessary reachability, keep closures small, avoid holding large request data across async boundaries, and be careful with patterns like chained array methods, JSON round-tripping, and string concatenation in loops when they create long-lived structures. WeakMap, WeakSet, WeakRef, and FinalizationRegistry can help when you need associations without ownership, but they should be used sparingly and never as a substitute for clear lifetime design.
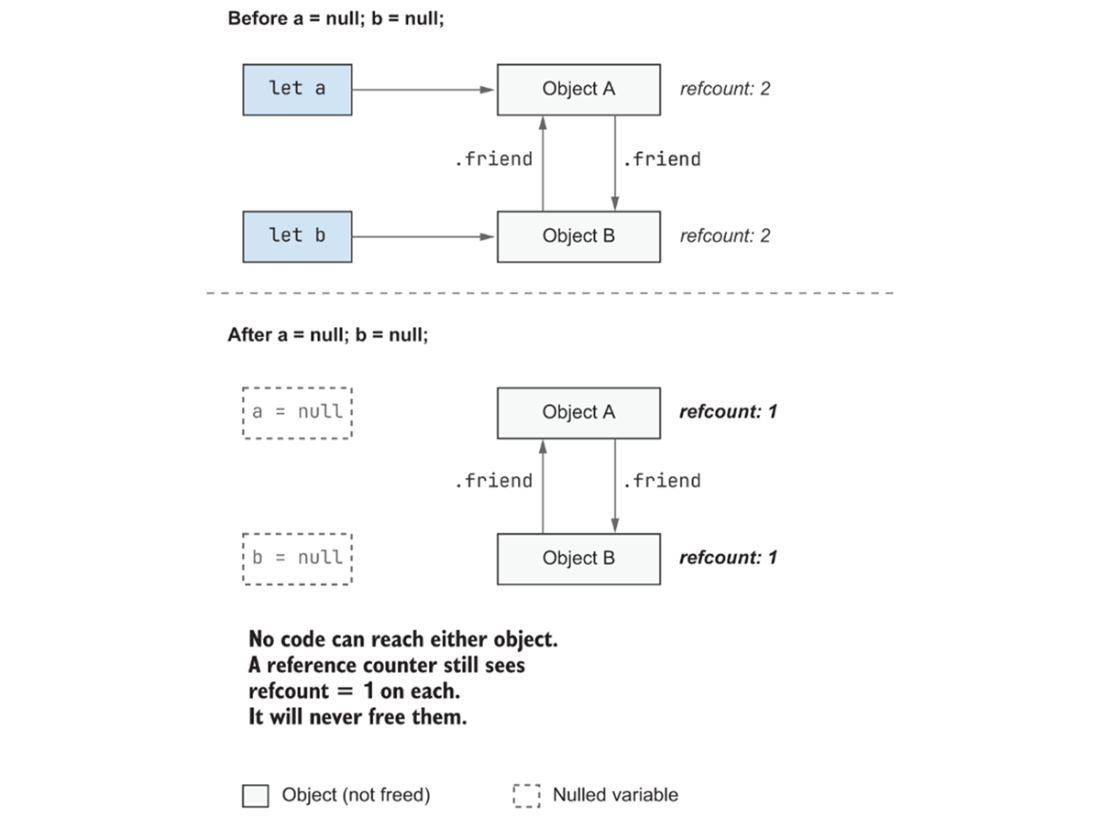
Circular references defeat reference counting. Before the variables are nulled, each object has a reference count of two: one from its variable and one from the other object’s .friend property. After both variables are set to null, each object’s count drops to one, not zero. The reference counter will never free either object even though no other code can reach them.
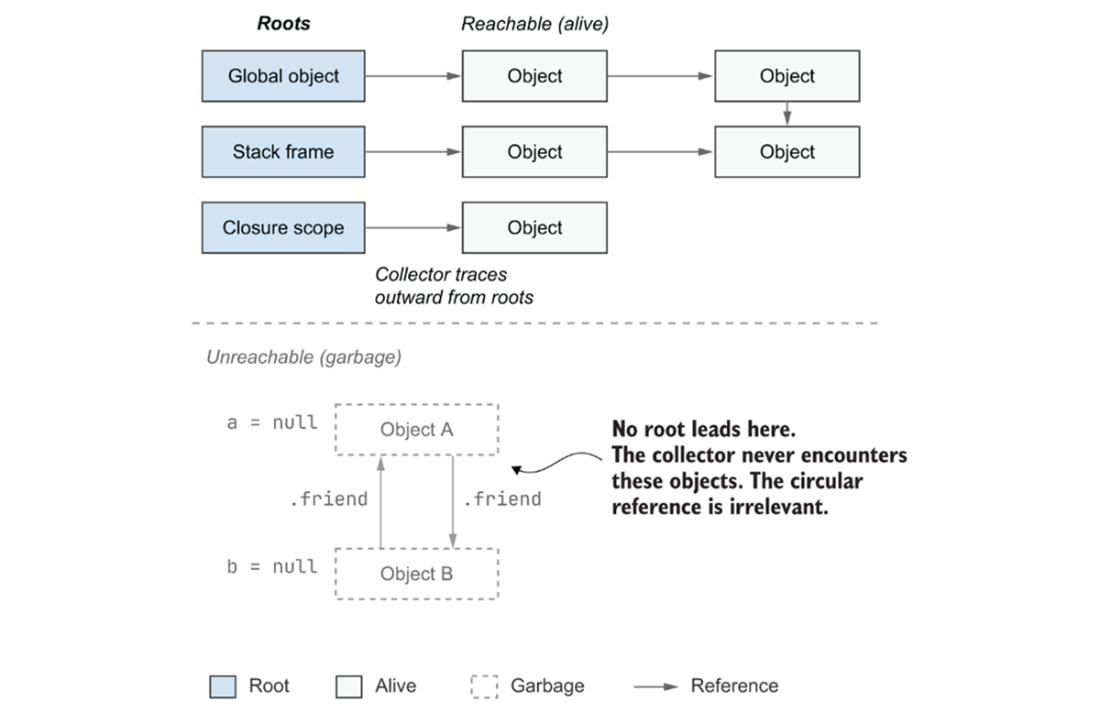
A tracing collector starts from root objects and follows references outward through the object graph. Objects the collector reaches are alive. The same Object A and Object B from the previous figure still reference each other through .friend, but no root leads to either one. The collector never encounters them and both are reclaimed.
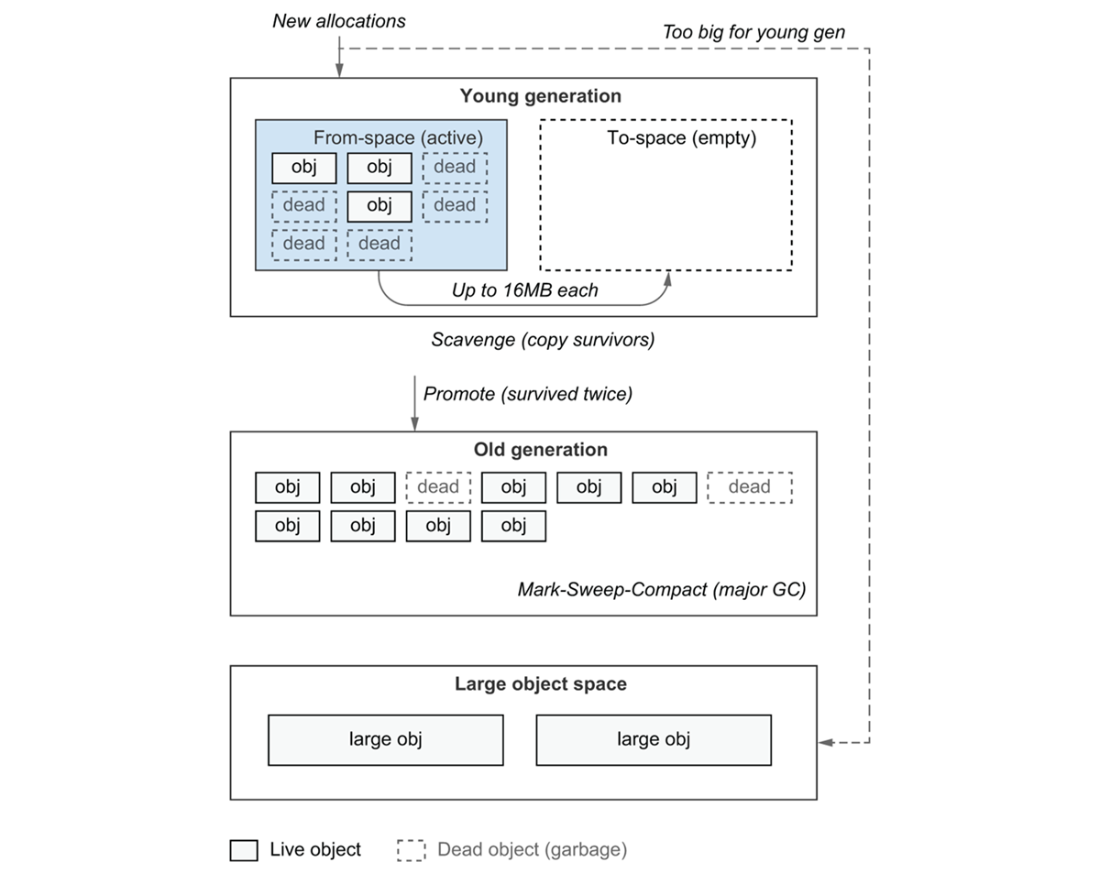
V8 divides its heap into distinct spaces. The young generation contains two semi-spaces (from-space and to-space), only one active at a time. Objects that survive two scavenges are promoted to the old generation. Allocations too large for the young generation go directly to the large object space.
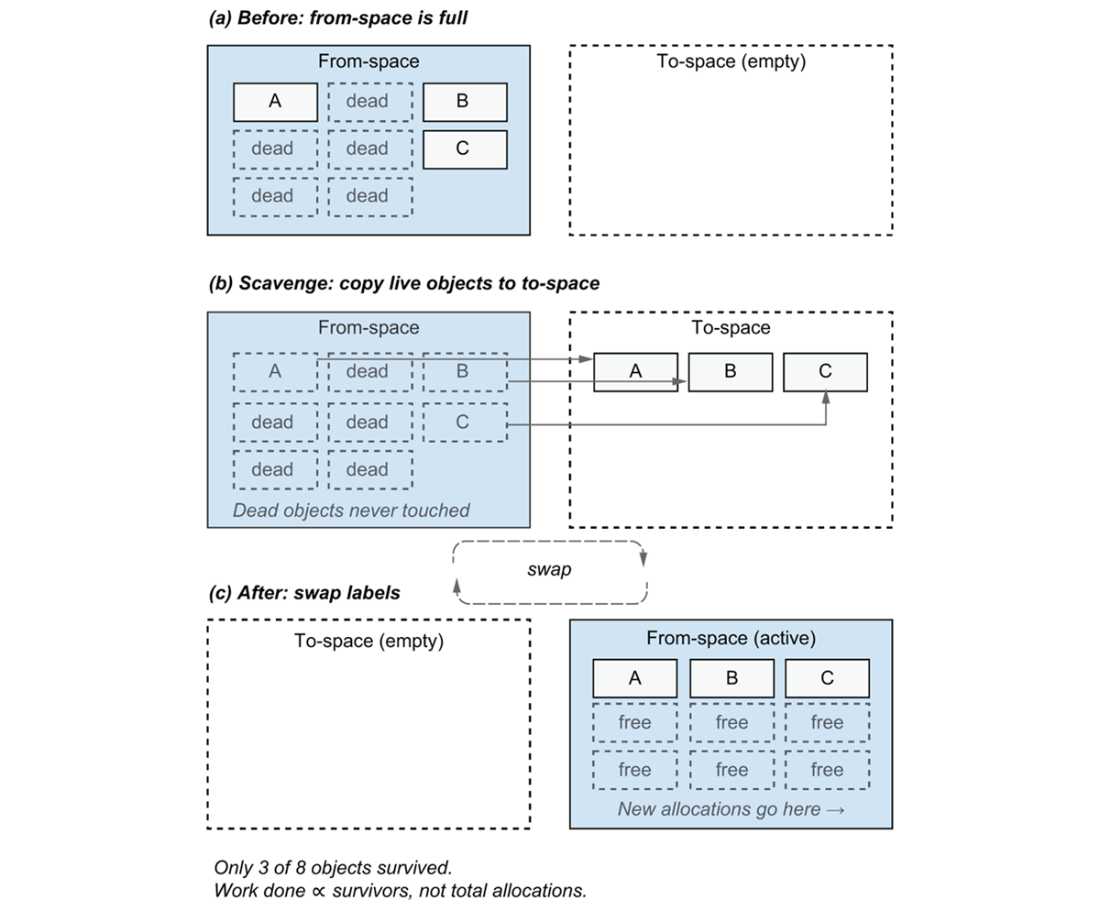
During a scavenge, V8 traces live objects in from-space and copies them into to-space. Dead objects are never visited. Once copying is complete, the semi-space labels swap: the old from-space is abandoned and the old to-space becomes the new from-space for future allocations.
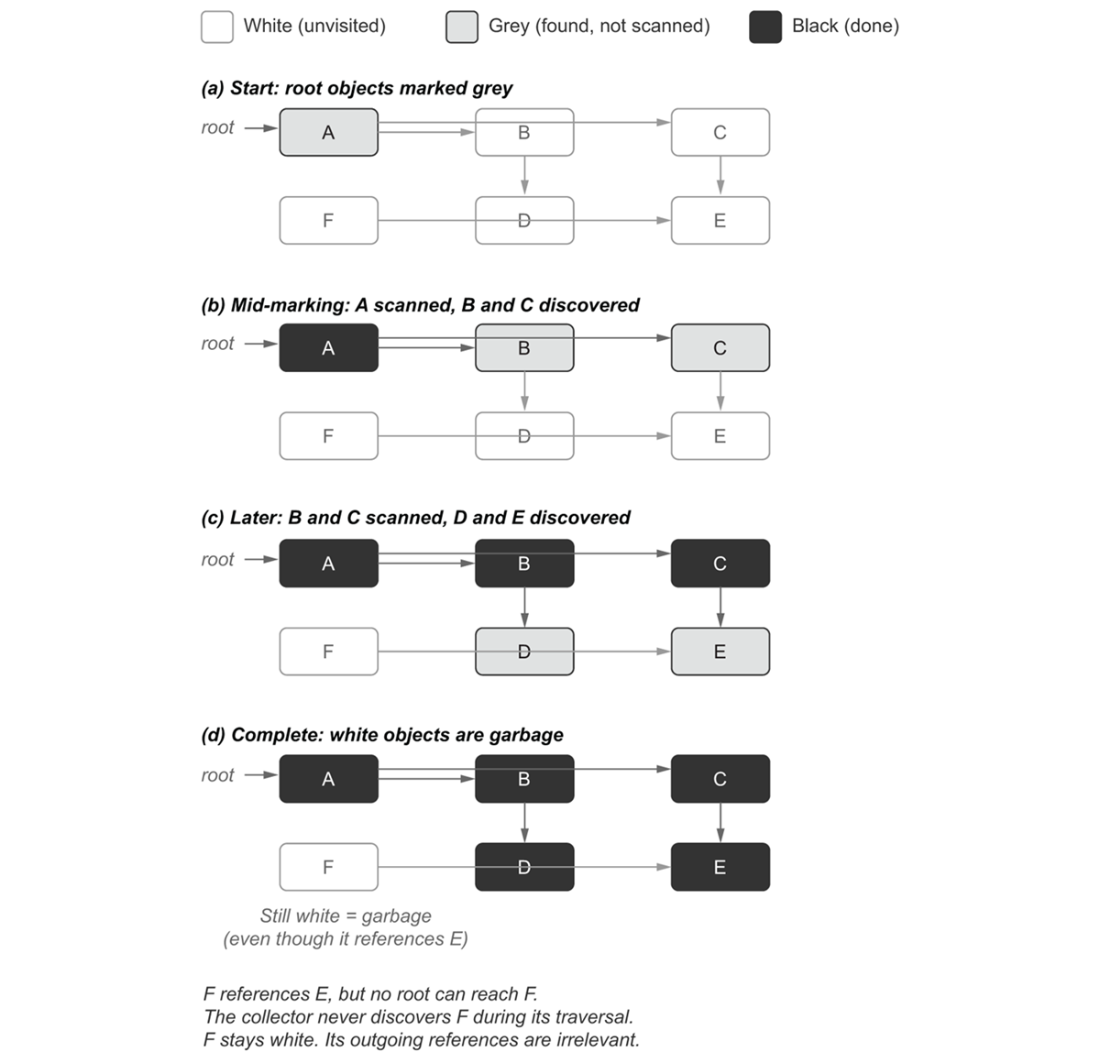
Tri-color marking in V8's old generation. Objects start white (unvisited). When the collector discovers an object, it marks it grey (found but not yet scanned). After following all outgoing references, it marks the object black (fully processed). Any object still white when marking completes is unreachable and can be reclaimed.
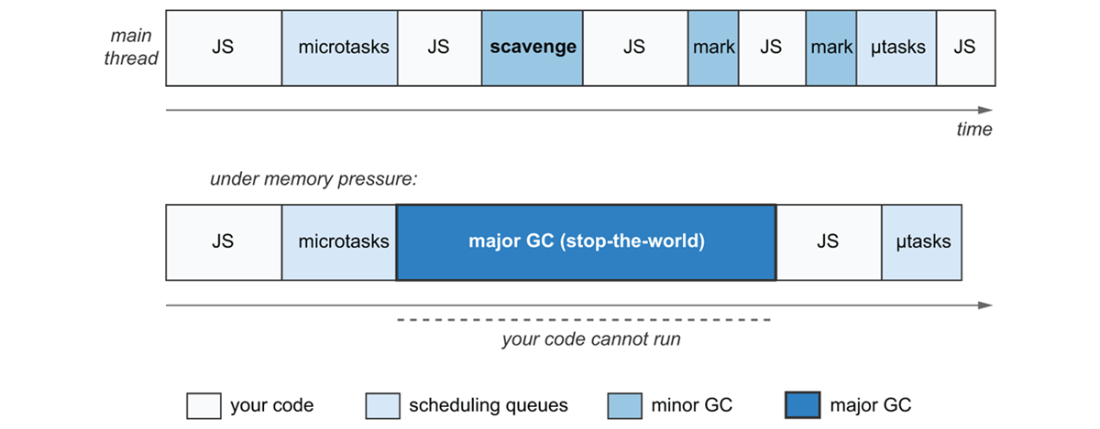
The garbage collector competes for the main thread alongside your code and the scheduling queues. A scavenge or incremental marking step can interrupt execution between any two operations, adding latency that doesn't appear in application-level logging.
Summary
- The ECMAScript specification does not require or define a garbage collector. V8 and JSC built fundamentally different collectors from the same silence: one moves objects, the other doesn't; one uses an advancing wavefront, the other retreats. The same code produces different performance profiles on each engine.
- JavaScript uses tracing, not reference counting. The collector starts from root objects and follows references outward. Anything it can reach is alive. Anything it can't is garbage. Circular references between unreachable objects are collected without difficulty.
- The generational hypothesis predicts that most objects die young. Engines exploit this by splitting memory into a young generation collected cheaply and an old generation collected expensively. Objects that survive long enough get promoted to the old generation where they cost far more to trace and reclaim.
- Object lifetime matters more than object count. Allocation in the young generation is a pointer bump that costs almost nothing. The expense comes from survival: tracing, copying, promoting, marking, and sweeping objects that stay alive. A million objects that die young cost less than a thousand that survive into the old generation. Controlling reachability, how long objects stay reachable and through how many paths, is the primary lever for managing garbage collection performance.
- Every mechanism that defers execution, whether promises, timers, or event listeners, extends the lifetime of everything its closures capture. Promises are particularly costly under concurrent server load because pending awaits keep entire function scopes alive long enough for promotion to old generation.
- WeakMap, WeakSet, WeakRef, and FinalizationRegistry let you reference or associate data with objects without extending their lifetime. The specification makes their cleanup timing deliberately unpredictable to prevent application logic from depending on collector behavior.
- The --trace-gc flag is the first diagnostic tool to reach for. A healthy profile shows only Scavenges with stable heap sizes and mu at 1.000. An unhealthy profile shows escalating Mark-Compact pauses, growing heap, and declining mu. Profile under realistic load before rewriting readable code for the sake of optimization.

 JavaScript in Depth ebook for free
