7 Risk management
This chapter reframes investing through a programmer’s lens: before you scale returns, learn to fall safely. It advocates “Ukemi” for capital—simple, rules-based protections such as universal stop-losses, explicit playbooks for crises, and risk-aware habits that reduce stress and large drawdowns. Risks are classified and prioritized (market, sector, and asset-specific), then mapped by likelihood and severity so action triggers are pre-decided rather than improvised under pressure. Beyond models, the human factor looms largest: negligence, FOMO, and loss aversion routinely overwhelm good intentions. The remedy is process—cool-off periods, risk profiles, peer review, and principle-driven checklists—so that discipline persists when emotions spike.
The chapter builds practical measurement skills to turn uncertainty into numbers. It connects volatility, variance, and beta to real portfolio behavior; uses covariance and correlation to reveal hidden dependencies; and shows how Value at Risk can bound expected losses using variance-covariance estimates or Monte Carlo simulation. Correlation-aware selection enables true diversification rather than cosmetically spreading bets across highly related names. It then extends the lens to non-financial risk—operational, regulatory, ESG, technological, political, reputational—where signals are messy, sources are fragmented, and judgment is required. The guidance: understand the business you own, track catalysts and events that move prices, and combine data, domain sense, and cautious use of automation or LLMs to keep blind spots small.
On mitigation and optimization, the chapter walks through hedging and portfolio construction. It treats derivatives as insurance or structured trades (protective puts, futures, swaps, income strategies, and defined-risk option spreads), pairs longs and shorts to target relative value, and “risk-pairs” speculative bets with stable cores. Diversification is reframed as reducing shared failure modes across sectors and asset classes. For construction, it uses the Markowitz efficient frontier, the risk-free rate, and the Sharpe ratio to search for higher return per unit of risk, then complements that macro view with the Shiller CAPE to tilt stock/bond/alternative weights by market valuation. Finally, it operationalizes resilience with rebalancing (time-, threshold-, or hybrid-based), favoring rules that trim concentration, add to strength, and keep the portfolio aligned with both risk appetite and capacity.
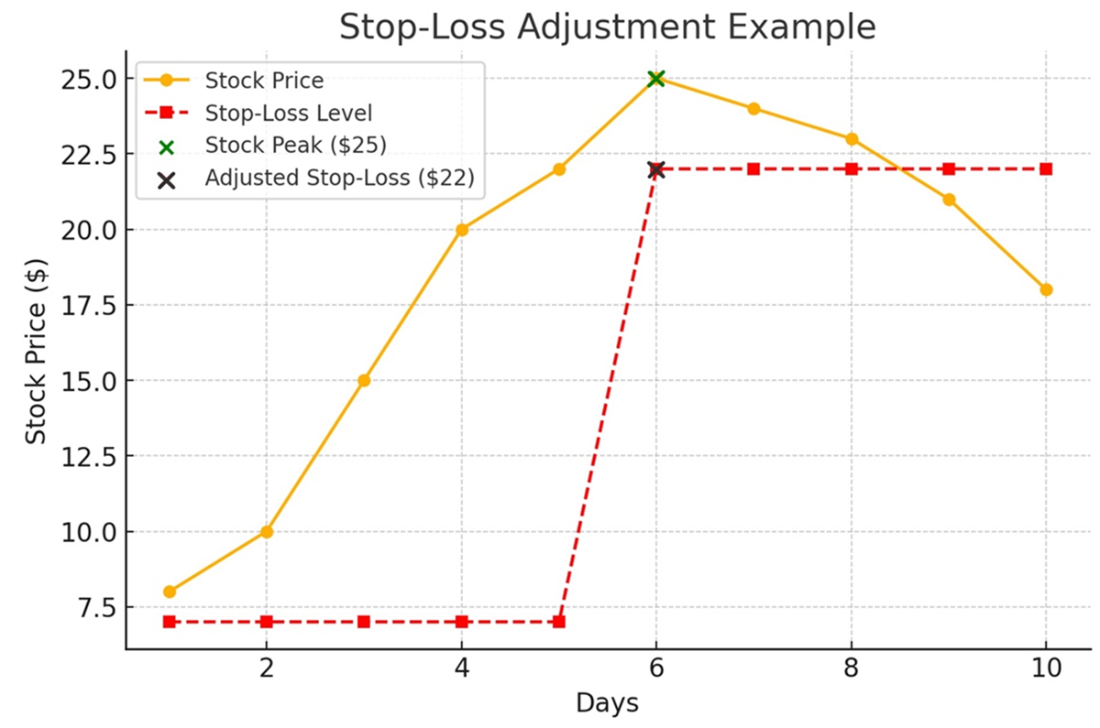
Shows a reference for a stop-loss order. In this reference, the stop loss is adjusted to 22 on day 6 after the share price rises. When the stock goes below 22 USD, the stop loss will be triggered, and the investor will sell at a market price on day 9.
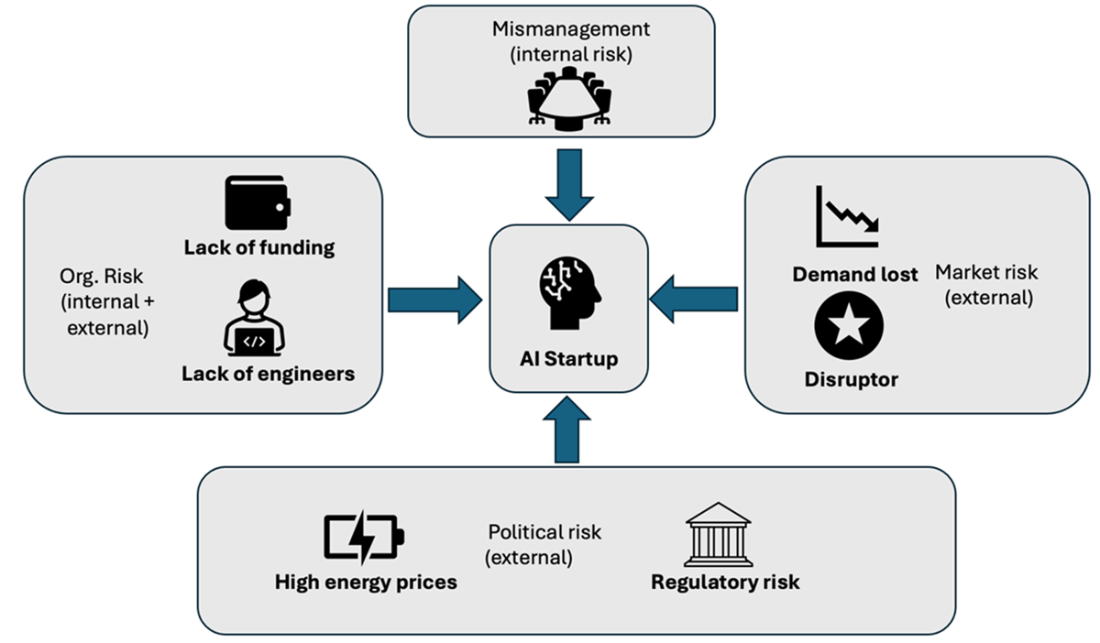
Shows a high-level risk model containing some of the challenges an AI startup faces.
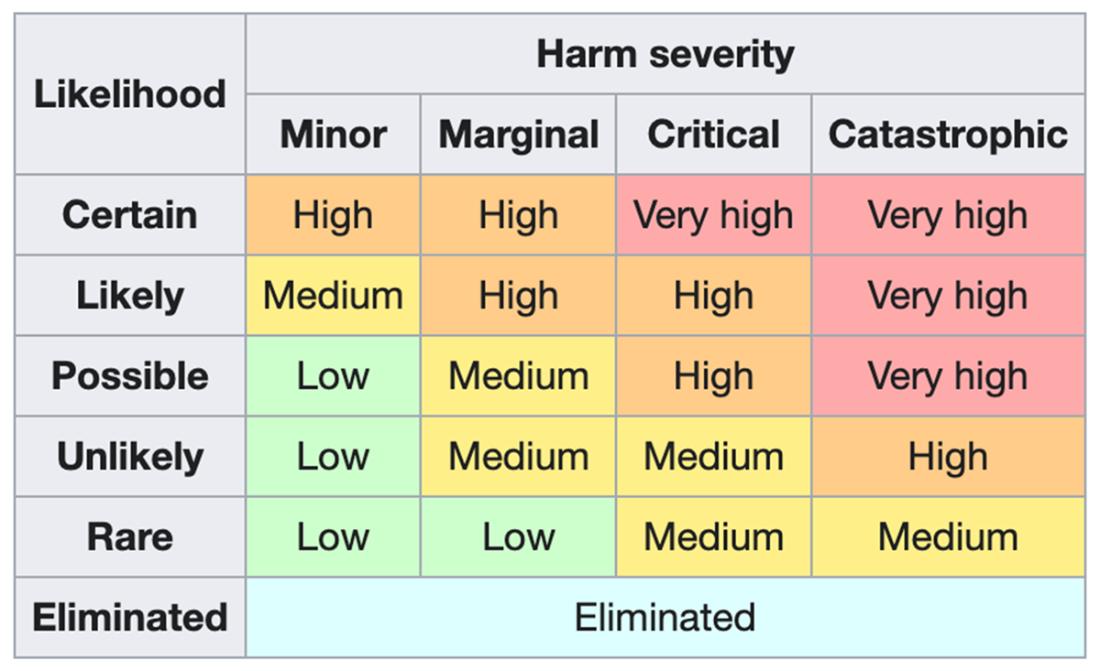
Shows how to map risk in a matrix based on severity and likelihood. We commonly create strategies to meet risks with higher harm severity first to mitigate the impact once the consequences become unavoidable.
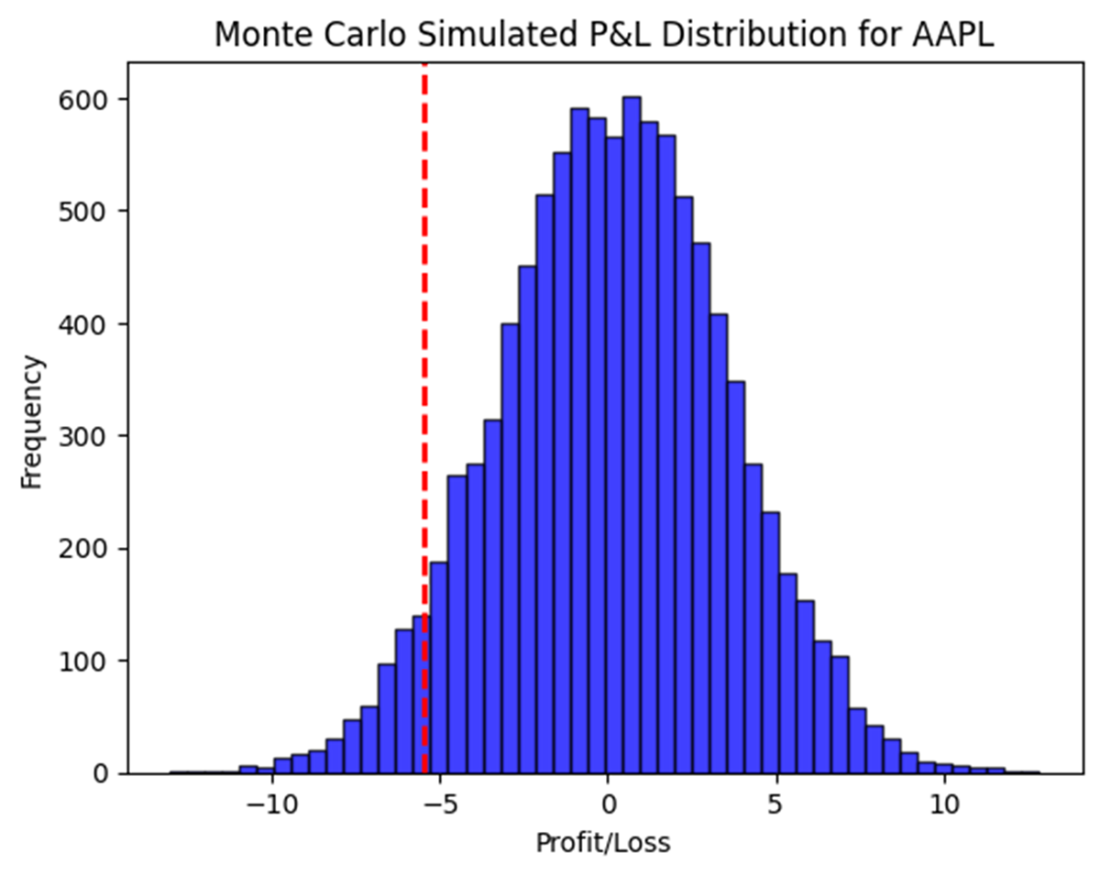
The result of a Monte Carlo simulation concludes that based on the historical data, only 5% of the time were the losses of Apple share prices higher than 5.5 USD a day.
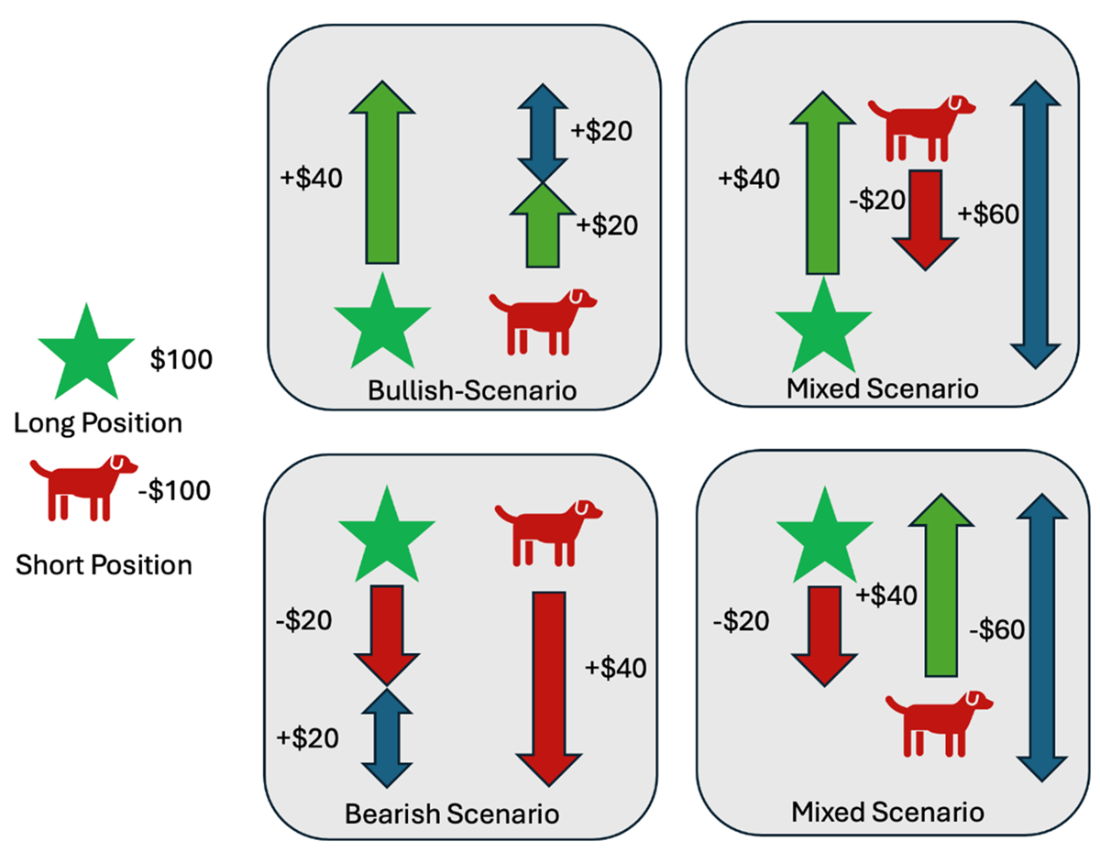
The investors are long on A and short on B. In the bull case, the long position increases more than the short position, and the long gain minus the short loss is the profit. In a bear case, the short position loses more than the long position. The profit is the gain from the short position minus the loss in the long position.
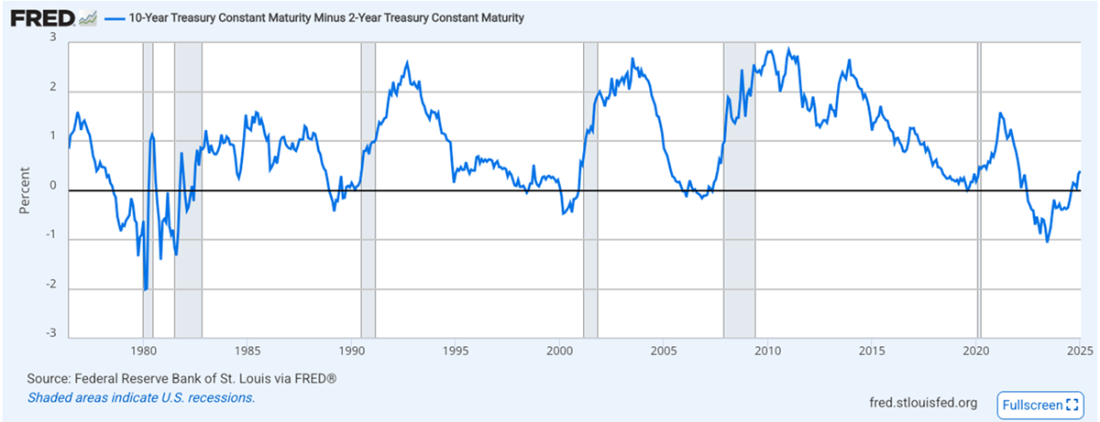
10-Year Treasury Constant Maturity Minus 2-Year Treasury Constant Maturity
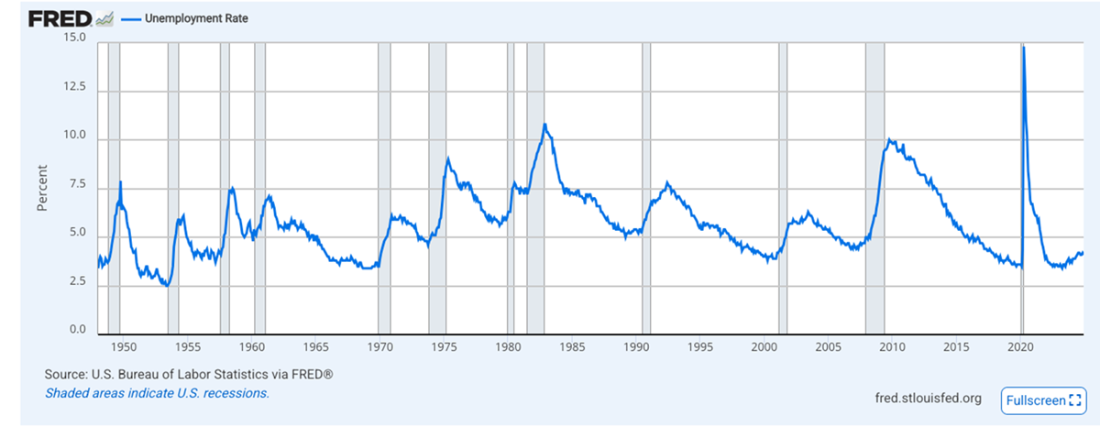
Unemployment rate over the years
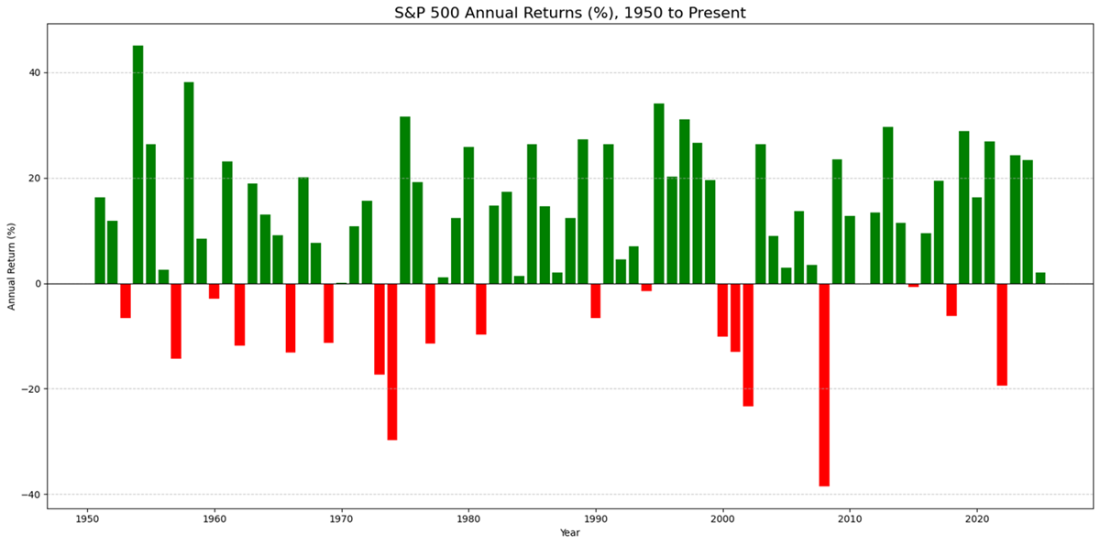
Market returns from 2050 until the present day.
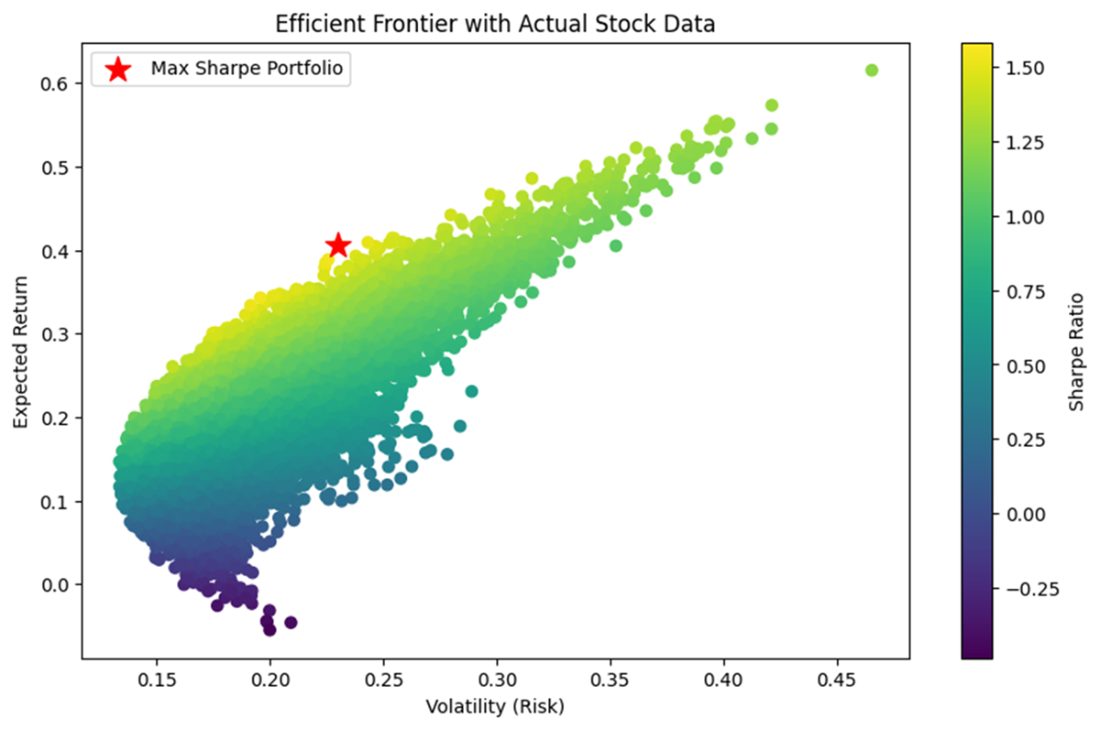
Showing the efficient frontier with the portfolio with the best Sharpe ratio.
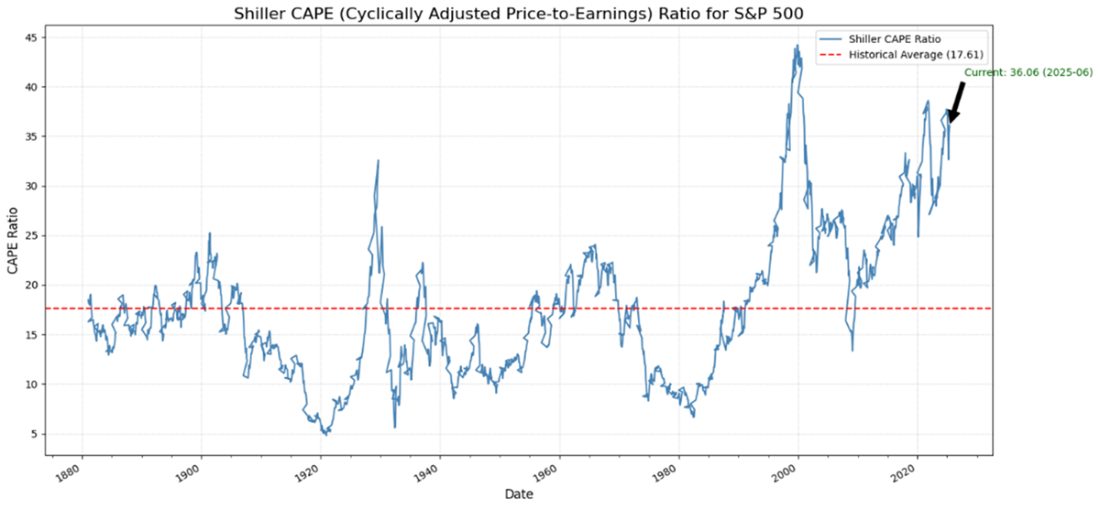
Shiller PE ratio per month.
Summary
- Ukemi is a term borrowed from martial arts. In this chapter, we use it to raise awareness of the importance of learning to deal with possible setbacks before taking risks.
- Stop-loss orders can be the most efficient loss protection tool. You instruct your broker to sell the position once it reaches a specific price.
- “Bikeshedding,” or Parkinson’s Law of Triviality, tells you about the risk of overlooking the most significant threats as you get distracted by trivial topics.
- Bull markets represent growth markets, and bear markets are markets of decline. Often, the challenge is less to create a well-performing portfolio during good times, but to minimize losses during bad times. Value at Risk (VaR) calculates how much you can likely lose in extreme cases in a period. We can use Monte Carlo simulations to measure the VaR of stocks.
- Correlation in the context of two share prices means their price movements are often interlinked. If stock A goes up, so does stock B, in most cases.
- We can use past returns and variances to determine risks. Then, we can select a portfolio of many stocks to produce the desired mix of expected risk-adjusted returns.
- We can use Monte Carlo simulations to calculate efficient portfolios.
- Human psychology is a significant risk factor when investing.
- Hedging describes practices to protect oneself against risk using techniques and assets such as derivatives, diversification, pair trading, or risk pairing.
- Derivatives are like insurance against changing prices. Some derivative traders also use them to create additional income.
- Diversification is essential but requires a deep understanding of the assets within one portfolio that might correlate.
- Pair trading is the idea of offsetting risk by going long in one position and short in another.
- Risk pairing means pairing risky investments with less risky assets.
- Non-financial risks comprise all risks without a direct link to finance. This broad category includes issues caused by geopolitical changes or overall market movements.
- You might be unable to protect yourself against all NFRs, as this category is vast, but you can identify the most concerning risks through a risk matrix.
- One way to protect a business against non-financial risks is by keeping a margin of safety and preparing for risks by anticipating worst-case scenarios.
- Some companies are more resilient against market movements than others. The beta ratio measures a stock’s volatility relative to the overall market. The lower a stock's beta, the more resilient it is against market movements.
- Some investors see macroeconomic data, such as unemployment rates and the 10-year treasury constant maturity minus the 2-year treasury constant maturity, as indicators of possible recessions.
- Past performance indicates a possible future performance, but does not guarantee it.
- Having multiple assets in a portfolio, with past returns for possible gains and past share price volatility as risk, allows us to create strategies.
- The Markowitz efficient portfolio recommends optimal weights in your portfolio based on historical data. These weights — in a closer sense, the distribution of shares within a portfolio — can be calculated through Monte Carlo simulation and reflect the optimal risk and return rate.
- The Shiller P/E ratio, also known as the CAPE ratio, is a valuation measure that uses real earnings per share over 10 years to smooth out fluctuations in corporate profits. It is often used to assess if a market, such as the S&P 500, is overvalued.
- Portfolios often become skewed with time. To overcome this, they need to be rebalanced. However, rebalancing too frequently can accumulate substantial transaction costs.

 Investing for Programmers ebook for free
