2 Investment essentials
This chapter gives programmers a practical, high-level vocabulary for investing so they can read markets with the same clarity they bring to unfamiliar software domains. It frames shares as ownership claims whose prices can diverge from intrinsic value and shows how fluency in the domain’s “ubiquitous language” turns opaque phrases like “high P/E” into actionable signals. The goal is to build a foundation that connects business models, accounting, sector context, and quantitative metrics into coherent investment hypotheses rather than code-centric intuition.
The essentials begin with standardized financial reporting: income statements (performance over a period), balance sheets (assets, liabilities, equity), and cash flow statements—emphasizing operating cash flow and free cash flow as indicators of solvency and optionality. The text situates companies within industry classifications and macro forces, distinguishing cyclical from defensive businesses and linking market capitalization tiers to risk–return trade-offs. It then assembles a toolkit of ratios and metrics—liquidity (current, quick), leverage and coverage (debt-to-equity, interest coverage), earnings quality and growth (EPS, FCF per share), valuation (P/E, PEG, price-to-sales, price-to-book), profitability (ROA, ROE, margins), and shareholder returns (dividends, payout policies, buybacks). Ownership dynamics (float, dilution, stock-based compensation), insider activity, and ESG considerations round out a multi-angle view of corporate “fitness.”
Applied well, these components encourage investors to compare peers within the same industry, anchor numbers to relevant baselines, and translate changes in statements into bull and bear hypotheses rather than conclusions. The chapter cautions that no single ratio suffices; strong decisions come from holistic scorecards, rigorous context, and cross-checks against independent and crowdsourced assessments—treating ratings and price targets as opinions, not oracles. Ultimately, it promotes a probabilistic mindset and diversification, and it previews programmatic data collection to help programmers turn this framework into repeatable, evidence-based, and model-driven investment workflows.
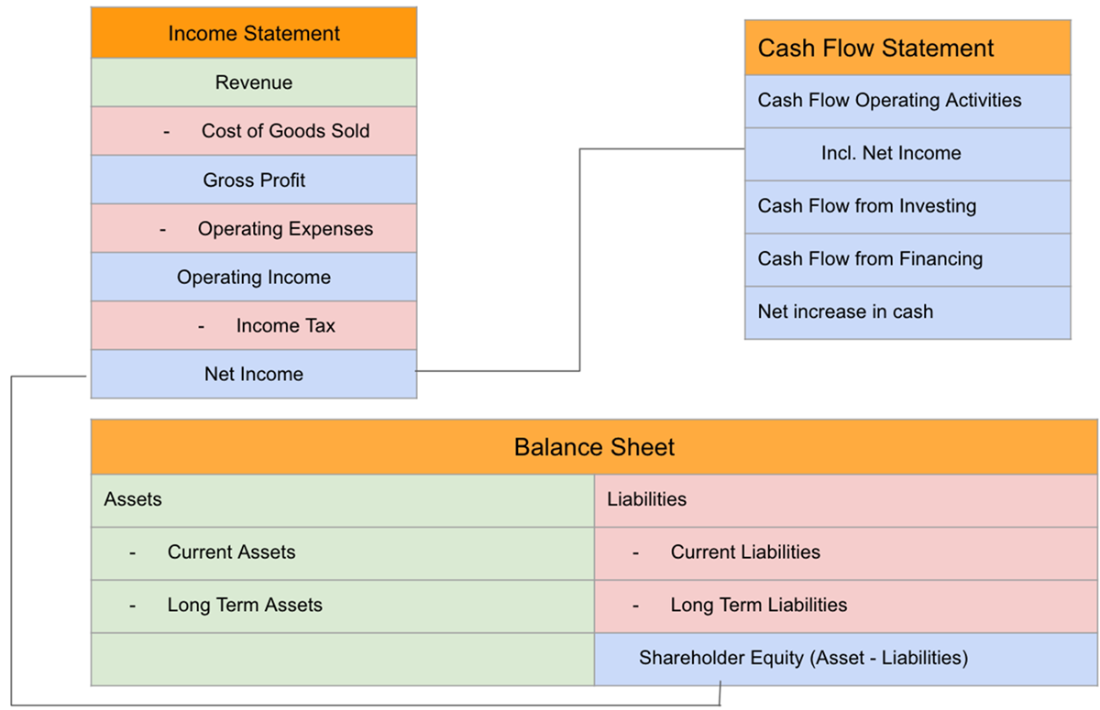
Illustrates a simplified relationship between the accounting statement and its interconnection.
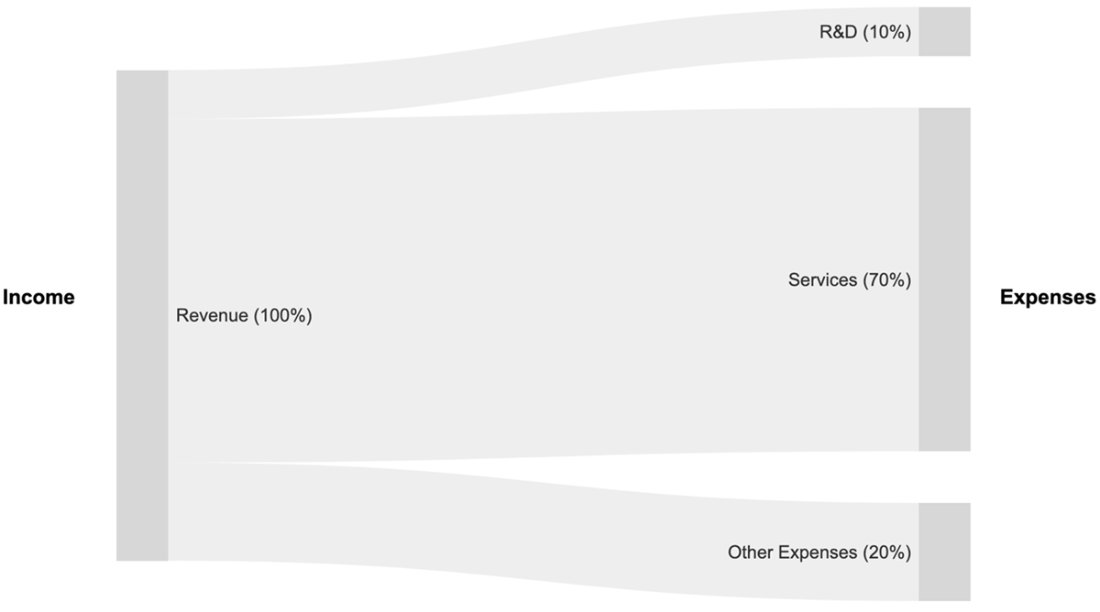
Shows a simplified model of a consulting company that makes its money on selling services and spends most of it on the salaries of their employees.
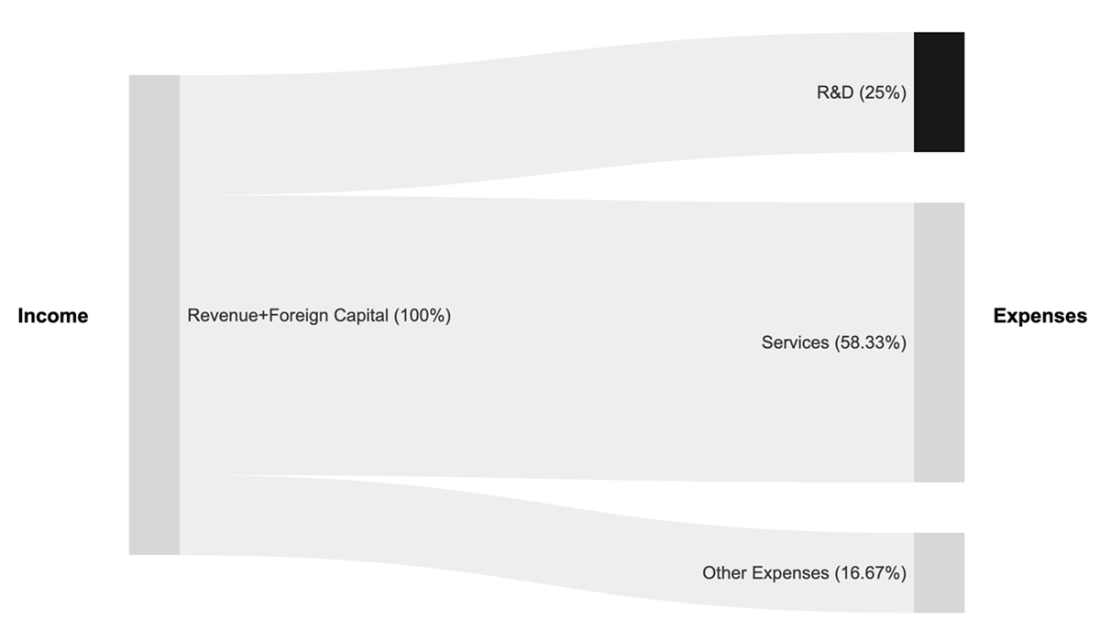
Indicates outlines that in this scenario the R&D expenses have increased, and the additional expenses are covered with foreign capital.
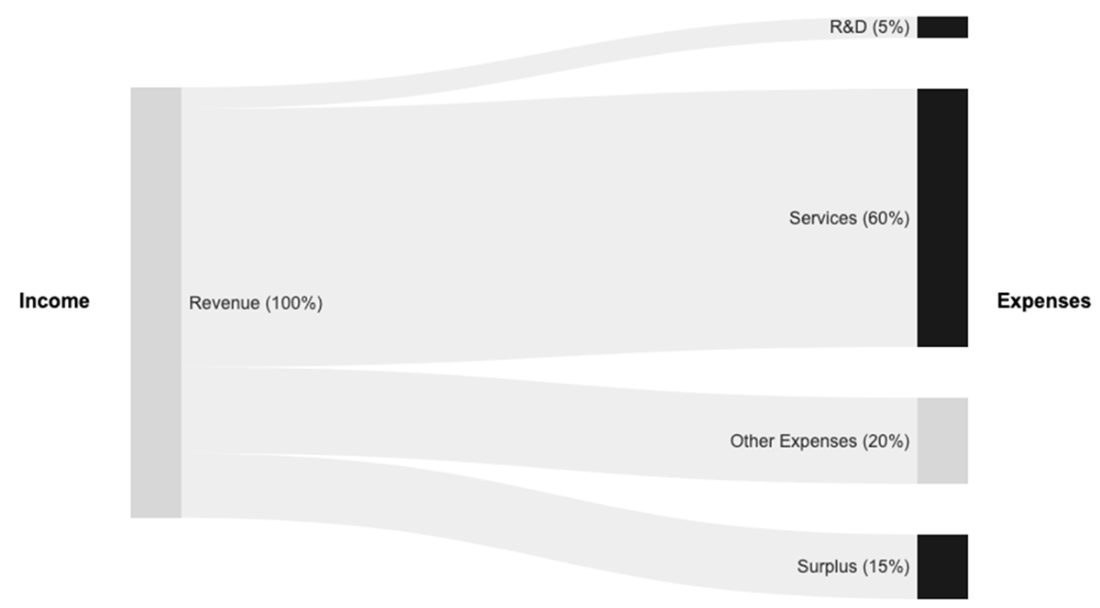
Indicates a situation in which companies reduce spending on research and services.
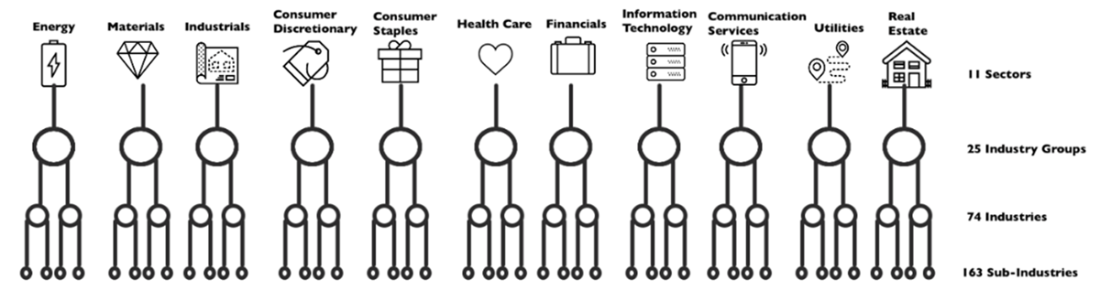
Shows all sectors with icons based on the GICS standard used in many financial platforms (taken from https://www.msci.com/our-solutions/indexes/gics)
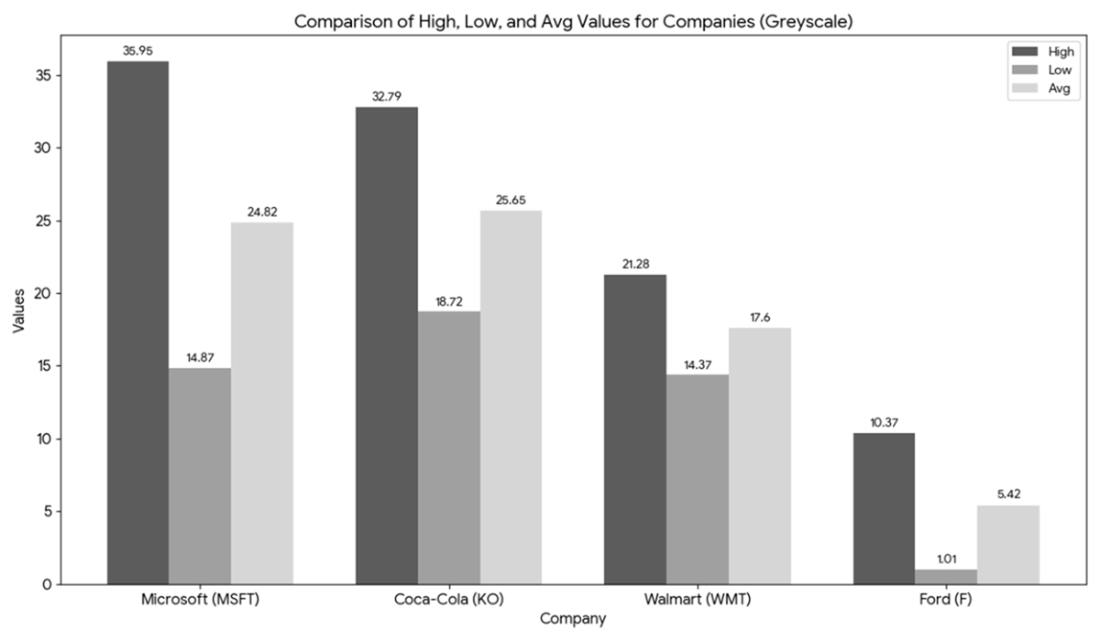
Data from the table in a bar chart, making the drop in value of some companies more obvious.
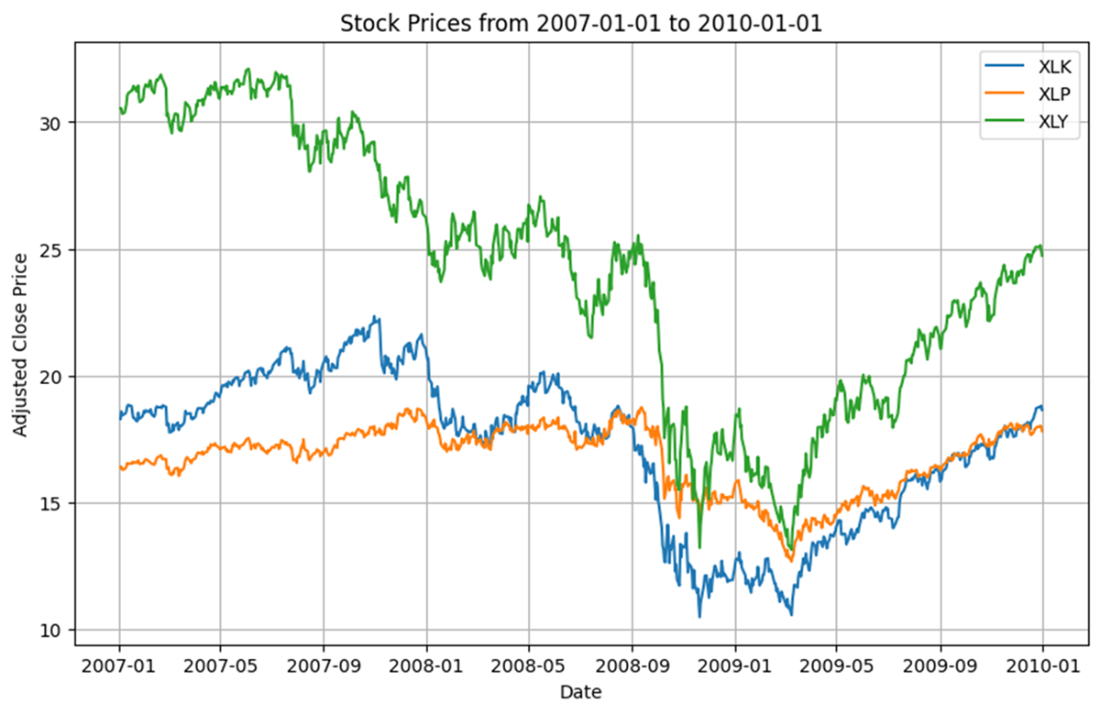
Shows the impact of the 2008 housing market crisis on selected indices (XLK (technology sector), XLP (consumer staples), and XLY (consumer discretionary)).
Summary
- The three accounting documents (income statement, balance sheet, and free cash flow) follow accounting standards that help us compare companies.
- Industry classification standards group companies into different sectors (higher granularity) and industries (lower granularity) to facilitate classification and identify peers among companies.
- Investors may interpret ratios differently depending on the company’s sector and industry. They often select ratios for their assessment based on their industry knowledge.
- While it is possible to compare companies across different industries, we obtain the most reliable results through comparisons of companies within the same industry.
- Some metrics help us determine a company’s status independently of its industry, especially those related to solvency, as the question of whether a company can pay its bills is a universal concern for all companies.
- Income statements provide insight into what companies earn during a period.
- The balance sheet provides insight into a company’s assets and liabilities. We can calculate shareholder equity by subtracting the total liabilities from the total assets.
- A free cash flow statement provides insight into a company’s liquidity and is often the basis for calculating liquidity ratios.
- Liquidity ratios are calculated mainly from the cash flow statement and reflect a company’s ability to pay bills with its assets. As some assets are not liquid, some companies may have a positive balance sheet but still be unable to pay their bills.
- Debt ratios provide insight into a company’s leverage by comparing its debt and assets. In some extreme cases, these ratios may indicate a pending bankruptcy.
- Earnings ratios measure the company’s profits per share, and we can use them in various ratio calculations, such as the price-to-earnings ratio.
- Profitability ratios assess a business’s ability to generate earnings relative to its revenue, operating costs, balance sheet assets, or shareholders’ equity over time.
- Dividend ratios indicate a company’s commitment to return money to its shareholders in small amounts over various periods.
- Ownership metrics examine changes in a company’s ownership, including insider trading, and can be informative for valuing the company.
- Sustainability metrics evaluate a company's commitment to causes beyond profit-making, encompassing environmental, social, and governance (ESG) considerations.
- We can collect analyst recommendations. However, following the recommendations of third parties without due diligence is a risky approach.
- Ratings are scorecards given by outside organizations to companies. They indicate the potential risks and gains of investing in those companies. Ratings might contradict each other and do not guarantee that the companies’ share prices will rise or fall.
- Target prices are forecasts provided by accredited financial analysts of potential stock prices. These estimates are highly speculative.
FAQ
What are the three core financial statements and what does each tell me?
Income statement: shows performance over a period (revenue, expenses, net income). Balance sheet: shows what the company owns and owes at a point in time (assets, liabilities, shareholders’ equity; Assets = Liabilities + Equity). Cash flow statement: shows cash actually generated and used, highlighting operating cash flow and capital expenditures to derive free cash flow. Together, they’re like a company’s source code—read them in context and over time.How do I interpret industry classifications (like GICS) when comparing companies?
Compare companies within the same sector/industry because business models drive very different “normal” ratios. For example, tech vs. supermarkets differ in R&D, margins, inventory, and cyclicality. GICS helps by grouping firms into sectors and sub-industries whose metrics, regulations, and sensitivities (interest rates, commodity prices, cycles) are more comparable.How do economic cycles affect sectors and stock behavior?
In expansions, discretionary spending rises; in contractions, defensive sectors (e.g., consumer staples) tend to hold up better. Cyclical firms (autos, some tech) are more sensitive to unemployment, disposable income, and rates. Use sector ETFs or peer groups to see how groups behaved in past crises and to add context to today’s numbers.What is market capitalization and how does size relate to risk and return?
Market cap = share price × shares outstanding. Mega/large caps typically carry lower bankruptcy risk but less “room to 10x.” Small/micro caps can deliver outsized gains but with higher failure risk. Size alone isn’t a guarantee—leadership changes over time—so always pair cap considerations with fundamentals.What are liquidity ratios (current and quick), and why do they vary by industry?
- Current ratio = current assets / current liabilities (can near-term obligations be met?).- Quick ratio = (cash + marketable securities + receivables) / current liabilities (stricter; excludes inventory).
Inventory-heavy retailers may show lower quick ratios than asset-light software firms. Look for outliers vs. peers, not a single “universal good” value.
How should I think about company debt and interest obligations?
- Debt-to-equity (D/E) shows leverage: total liabilities vs. equity. High isn’t automatically bad—context (rates, strategy) matters (e.g., cheap, long-term debt to fund growth).- Interest coverage = EBIT / interest expense. Below 1.0 is a red flag across industries. Always pair leverage with the firm’s ability to service debt.
Which earnings and valuation metrics matter most (EPS, P/E, PEG, P/S, P/B)?
- EPS: profit per share; the base for many ratios.- P/E: price paid per $1 of earnings; compare vs. sector and history, not in isolation.
- PEG: P/E divided by EPS growth; adds growth to the valuation lens.
- P/S: price per $1 of sales; useful when earnings are noisy or early-stage.
- P/B: price per $1 of equity; often more relevant for capital-intensive firms. Always compare within industry and over time.
Why does free cash flow (FCF) matter so much?
FCF = operating cash flow − capital expenditures. It’s the cash left to pay bills, invest, reduce debt, or return capital. Unlike accrual-based earnings, FCF reveals solvency and financial flexibility. FCF per share extends this to a per-share lens for comparability and valuation.How do dividends and buybacks reward shareholders, and what are the pitfalls?
- Dividends: recurring cash payouts; attractive for income, common in mature, slower-growth firms. Yield = dividend per share / price. Beware tax drag and that the payout reduces the share price on ex-div day.- Buybacks: reduce shares outstanding, boosting each remaining share’s claim on earnings; more flexible than dividends. Check payout ratio, dividend growth history, and whether buybacks offset dilution.
What should I watch in ownership structure, dilution, and insider activity?
- Shares outstanding vs. float: float excludes insider/institutional holdings; matters for liquidity and volatility.- Issuances vs. buybacks: issuance dilutes; buybacks concentrate ownership.
- Stock-based compensation (SBC): can steadily dilute, especially at smaller firms.
- Insider transactions: sustained net selling can be a caution flag, but context (e.g., profit-taking) matters.

 Investing for Programmers ebook for free
