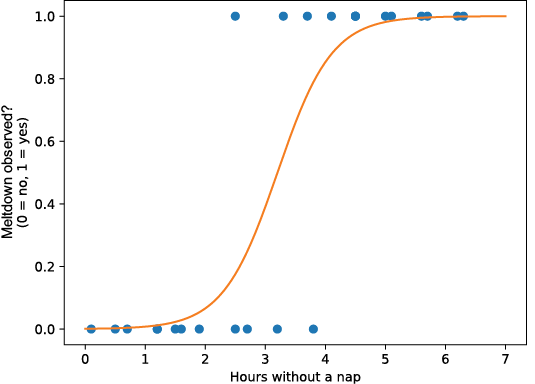
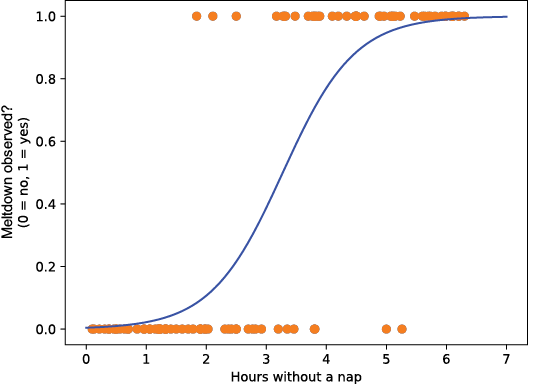
This chapter explains classification as the task of assigning labels rather than predicting a continuous number, such as deciding whether something is spam or not spam, or whether an event happened or did not happen. Because binary outcomes do not fit linear regression well, logistic regression is introduced as a better tool for classification problems. Using a toddler meltdown example, the chapter shows how logistic regression models the probability of a yes-or-no outcome as the time without a nap increases, producing an S-shaped curve that stays between 0 and 1. A probability threshold, often 0.5, then converts that estimated probability into a final class prediction.
The chapter then shows how logistic regression is fit in Python with scikit-learn, including how to reshape input data, fit the model, extract coefficients, and predict probabilities for new cases. It also explains the meaning of the log-odds: the linear part inside the logistic function is equivalent to the natural log of the odds, which makes it easier to interpret changes in risk and compare one situation to another. In the toddler example, moving from four to six hours without a nap dramatically increases the odds of a meltdown, illustrating how the slope of the model translates into changing likelihoods. The chapter emphasizes that logistic regression is useful not because it predicts exact outcomes with certainty, but because it gives a principled estimate of class probabilities.
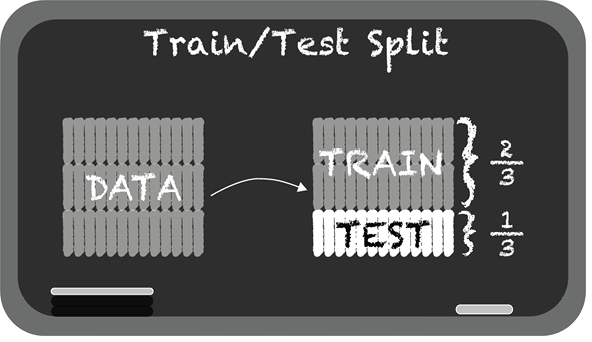
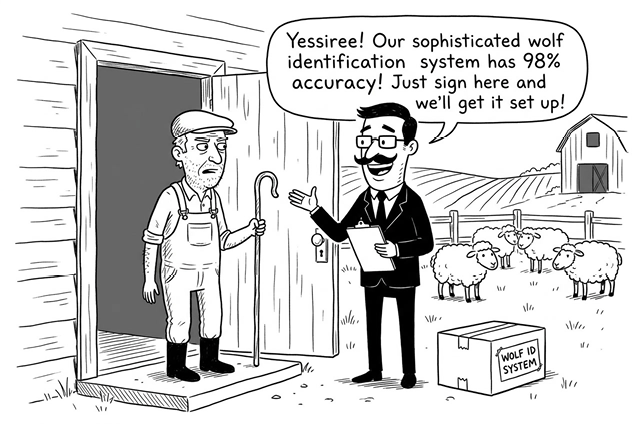
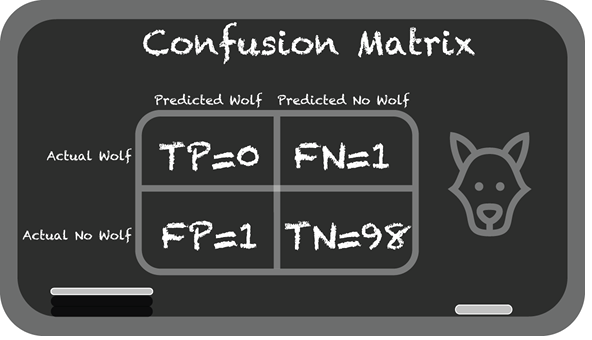
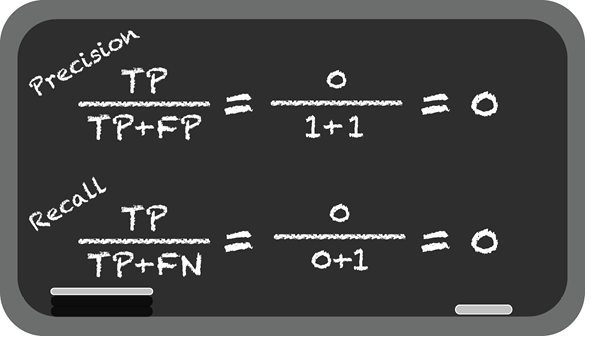
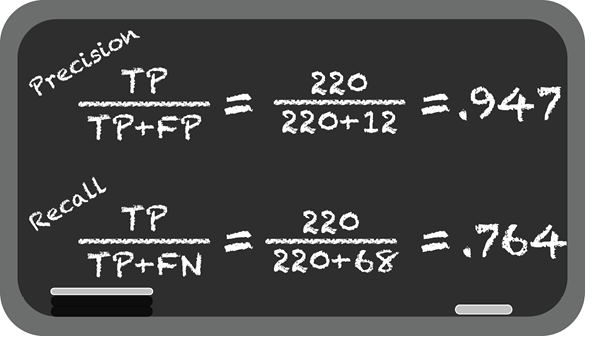
To judge whether a classification model is any good, the chapter shifts from fitting to validation. It recommends train/test splits and cross-validation to estimate how well a model generalizes to unseen data, rather than relying on how well it fits the training set. It then argues that accuracy can be misleading, especially when classes are imbalanced, and uses a wolf-alarm example to show why false positives and false negatives matter more than a single percent-correct number. Precision and recall are introduced as better measures for classification, along with the tradeoff between them. Finally, the chapter explains how ROC curves, AUC, and precision-recall curves summarize performance across thresholds, helping you choose an operating point that fits the real costs of missed events versus false alarms.

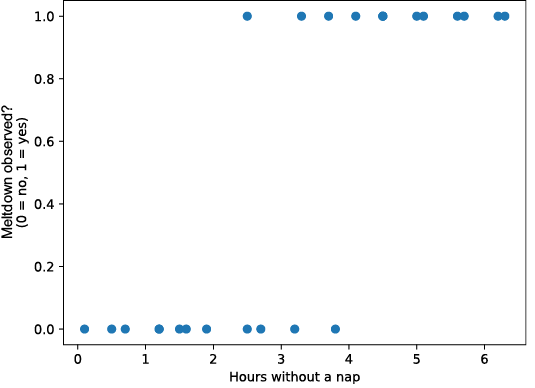
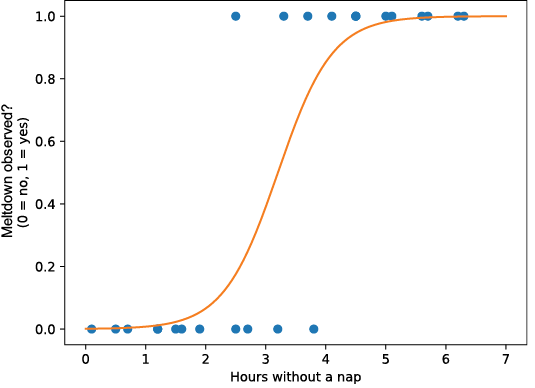
Data showing time without a nap and whether a toddler had a meltdown
A logistic regression model of time without a nap and whether a toddler had a meltdown
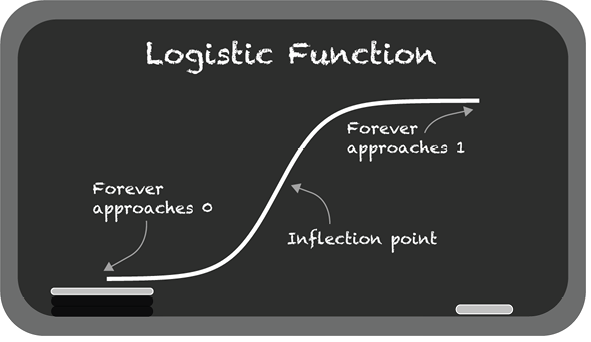
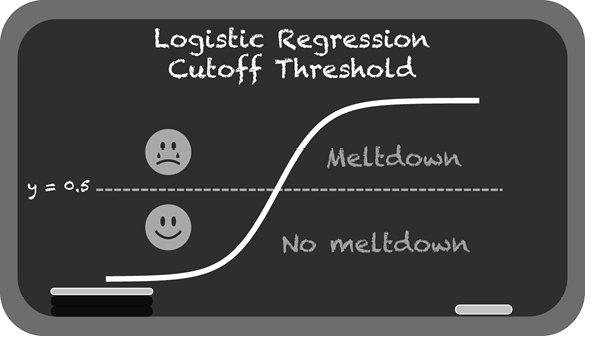
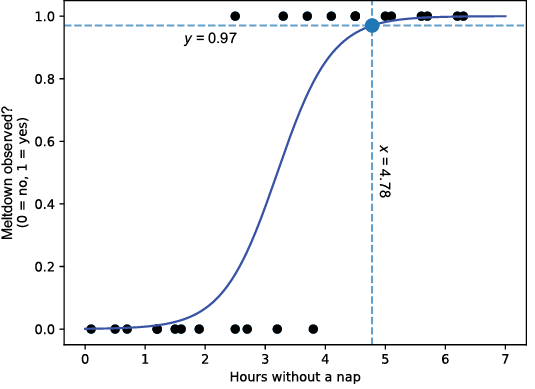
Finding the predicted probability of a toddler meltdown, given that it’s been 4.78 hours without a nap
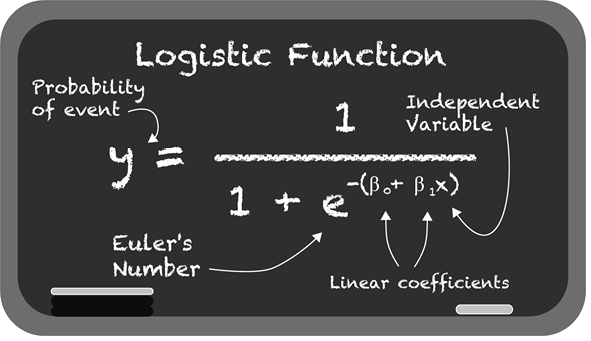
Plotting the logistic function in Python using matplotlib
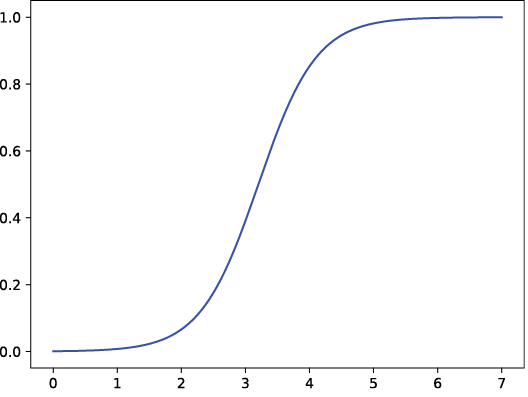
A logistic regression model predicting the probability of a toddler meltdown based on hours without a nap
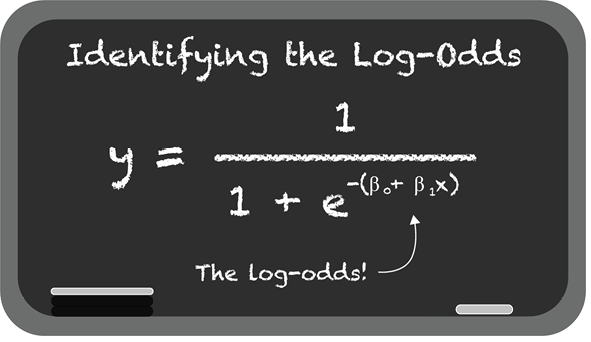
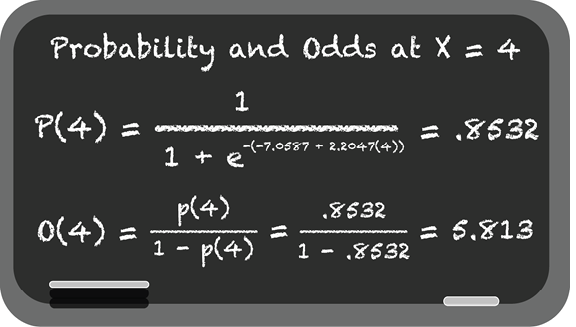
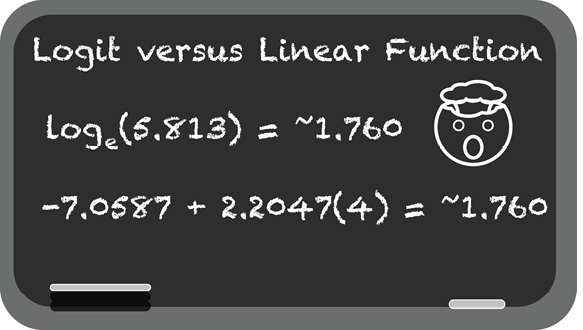
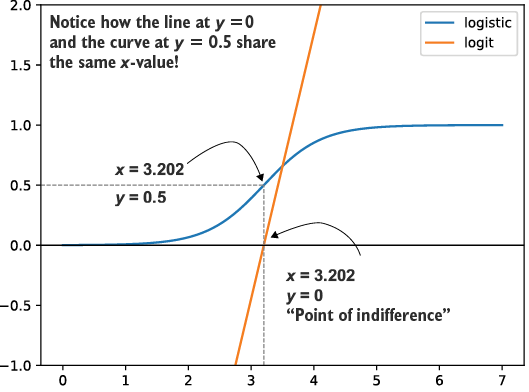
Comparing the logistic function (the S-curve) with the log-odds function (the straight line). Note that when the log-odds line crosses y = 0, the sigmoid function has a value of y = 0.5.
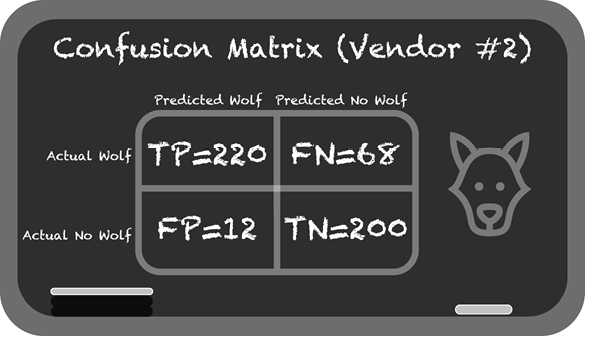
A logistic regression of 100 samples for hours without a nap and the probability of a meltdown
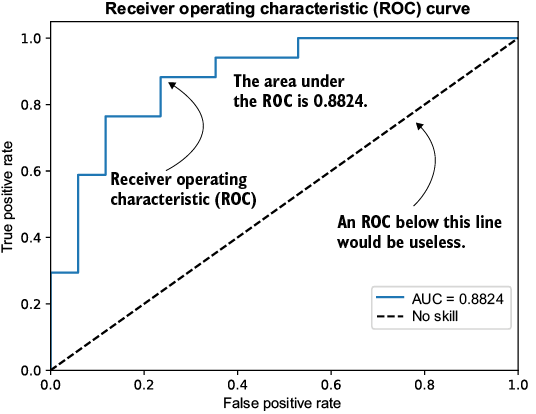
The receiver operating characteristic (ROC) curve for my logistic regression toddler meltdown prediction, across different thresholds
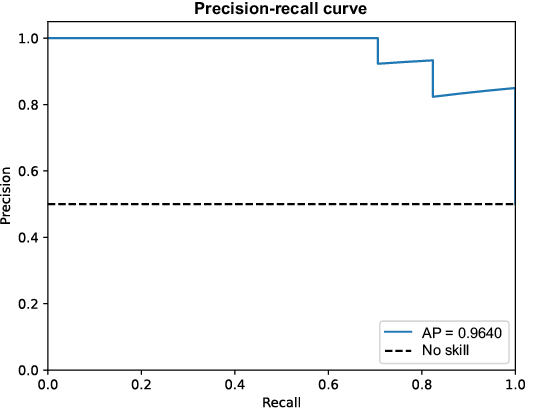
The precision-recall curve (PRC) for our toddler meltdown dataset
Summary
- Classification models produce outputs that differ from regression models, because they output classes (true/false or dog/cat/bird) rather than continuous values.
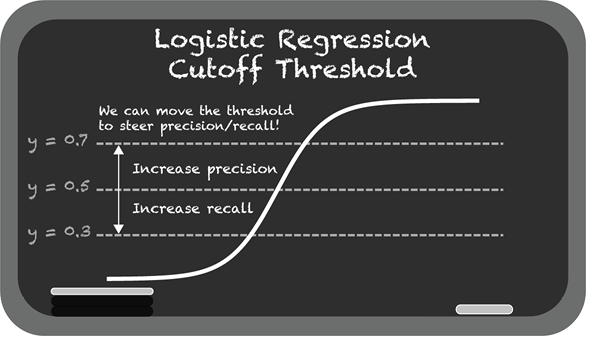
- While logistic regression produces a probability, it can be turned into a classification model using a threshold like 0.50.
- Accuracy is a misleading metric in classification, especially for imbalanced datasets, where one class is overrepresented relative to another (e.g., far more non-spam than spam emails).
- Precision and recall are effective measures that help nudge a preference for false positives (false alarms) versus false negatives (missed alarms).
- In the machine learning workflow, we use train/test splits or cross-validation to hold back a dataset that the model was not trained on and then evaluate how well it performs on data it has not seen before. Unless fitting your model is computationally expensive, choose cross-validation.
- Use the receiver operating characteristic (ROC) curve to measure model performance across different thresholds, but if the data is imbalanced, use the precision-recall curve (PRC) instead.
- For the ROC or PRC, use the area under the curve (AUC) to summarize performance as a single number, rather than relying solely on accuracy, which can be misleading.

 Grokking Statistics ebook for free
