Overview

6 Coincidence? I think not!

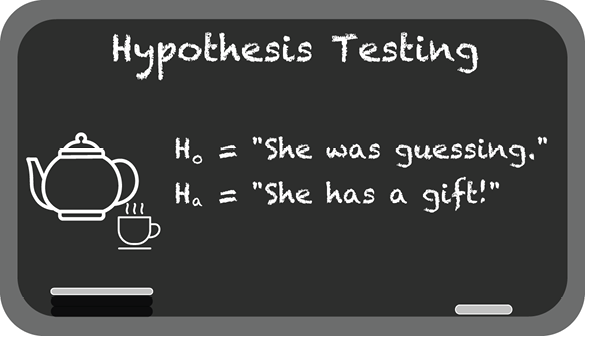
Hypothesis testing is presented as a way to challenge a claim using data, with a null hypothesis representing the status quo and an alternative hypothesis representing a competing explanation. The chapter introduces this idea through a memorable tea experiment, where the question is not whether something is absolutely true, but whether the observed result would be so unlikely under random chance that the null hypothesis becomes hard to defend. The central takeaway is that statistics works by weighing evidence, not proving certainty, and that strong skepticism, humility, and careful experimental design matter.

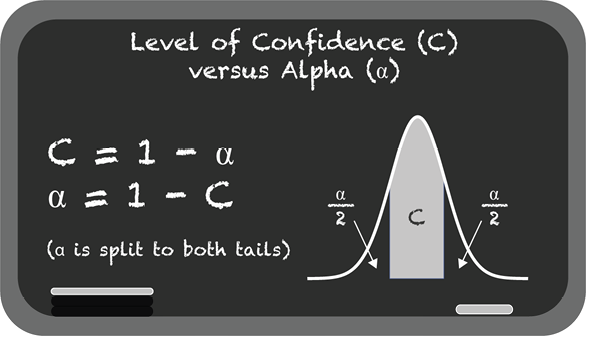
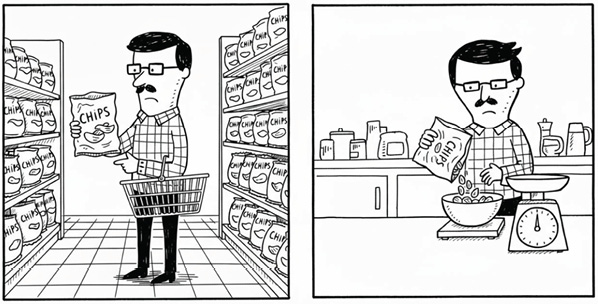
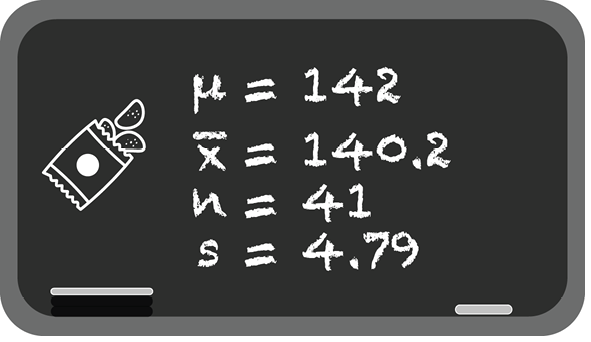
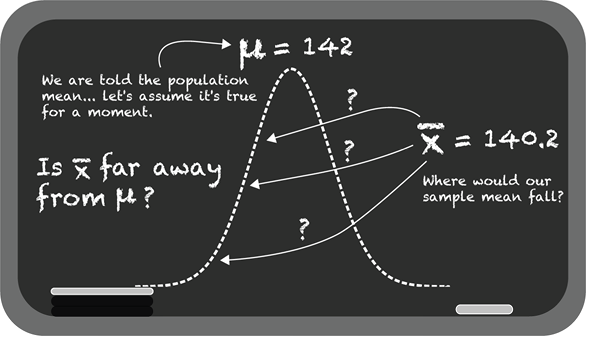
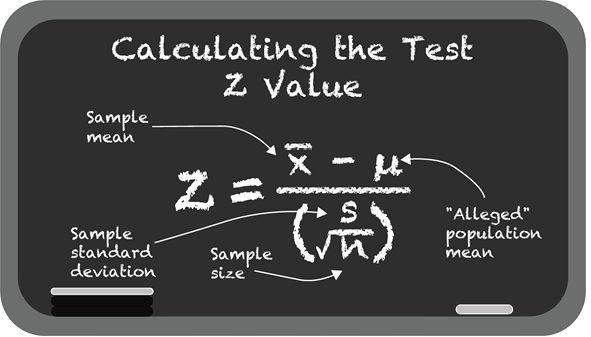
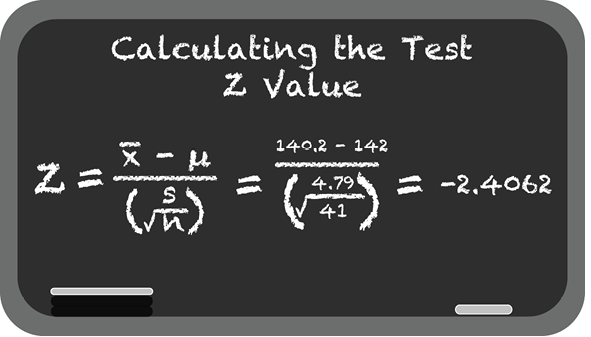
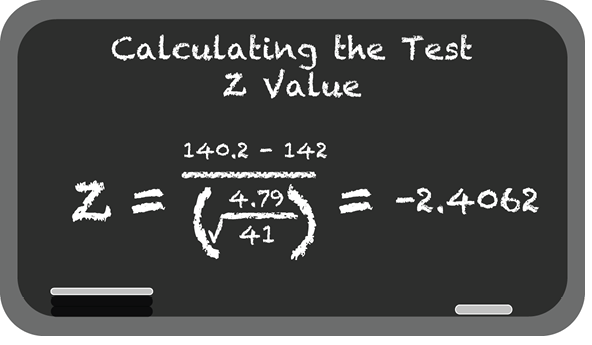
The chapter then builds the mechanics of two-tailed testing for sample means, showing how to compare a sample to an assumed population value using a test statistic, a confidence level, and a significance level. It explains that the significance level is the leftover tail area outside the confidence interval, and that a result is rejected when the test statistic lands in that extreme region. A potato chip example demonstrates the process end to end: a sample mean that is far enough from the advertised mean produces a test statistic outside the critical range, leading to rejection of the null hypothesis.

Finally, the chapter explains how p-values summarize the same decision rule more conveniently by measuring how extreme the observed sample would be if the null were true. It contrasts two-tailed and one-tailed tests, showing that one-tailed tests place all the significance area in one direction and are therefore less conservative, but only appropriate when the direction of the claim is known in advance. The chapter closes by extending the same logic to smaller samples using the t-distribution and to proportions and independent-sample comparisons, reinforcing that hypothesis testing is a flexible framework for deciding whether observed differences are likely meaningful or just due to chance.


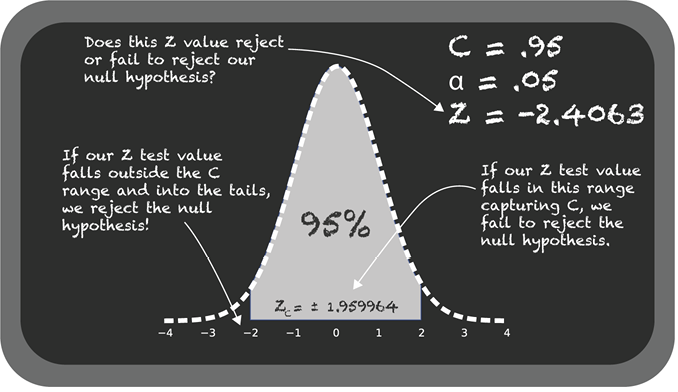
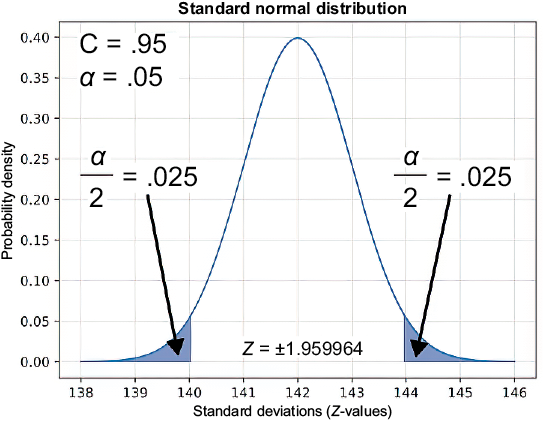
A critical Z-value of ±1.959964 for a 95% level of confidence
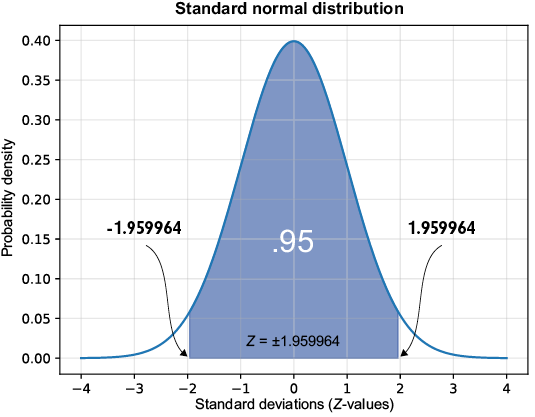
A critical Z-value of ±1.959964 for a .05 level of significance (alpha)
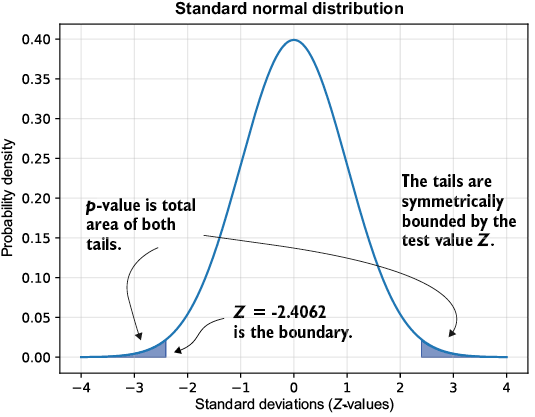
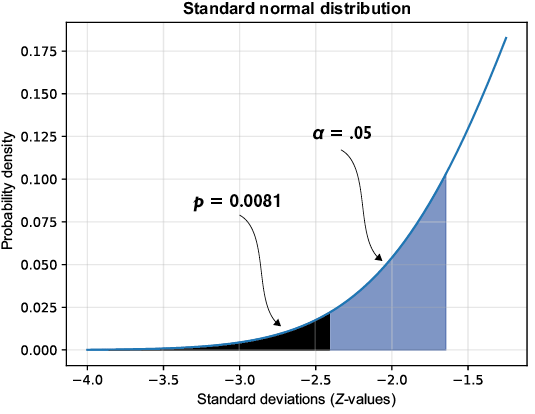
The p-value is the probability of values more extreme than your sample.
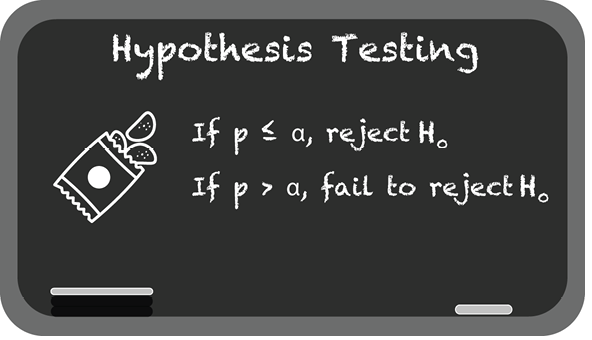
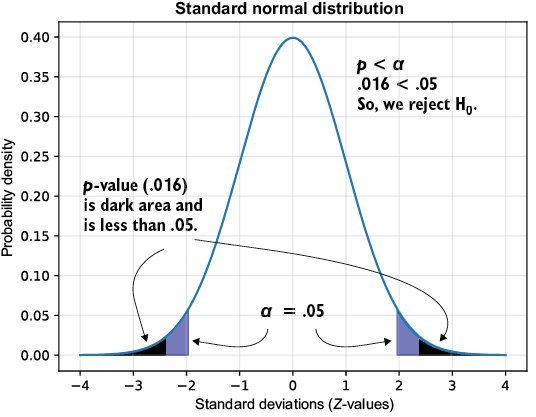
Comparing the p-value to α. Since the p-value is less than α, we reject the null hypothesis.
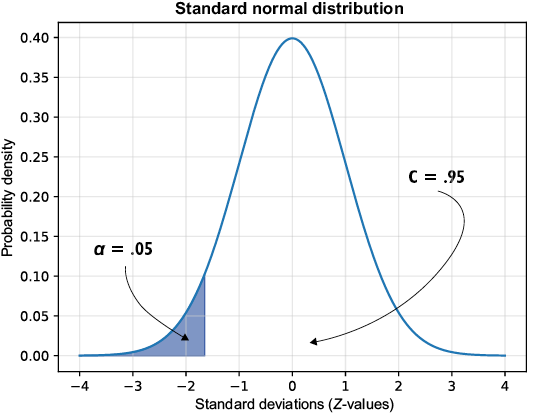
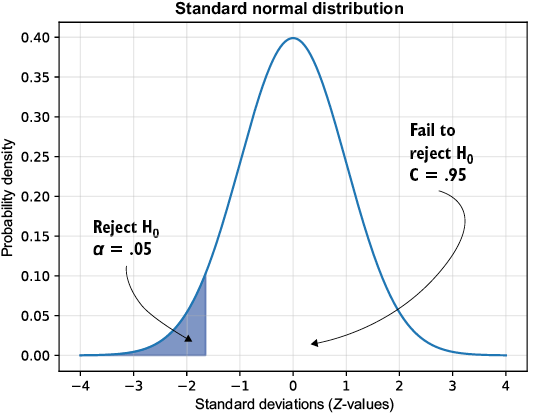
Showing the one-tailed test confidence and significance levels in the left direction
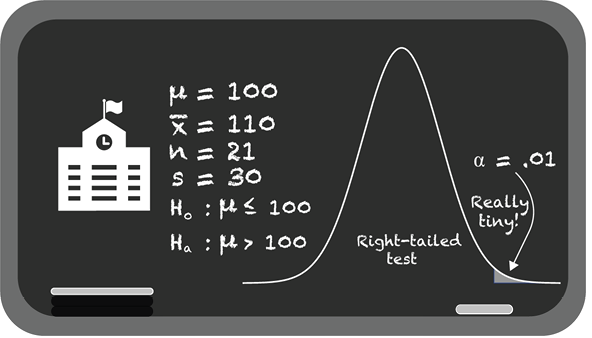
Showing the one-tailed test confidence and significance levels in the right direction
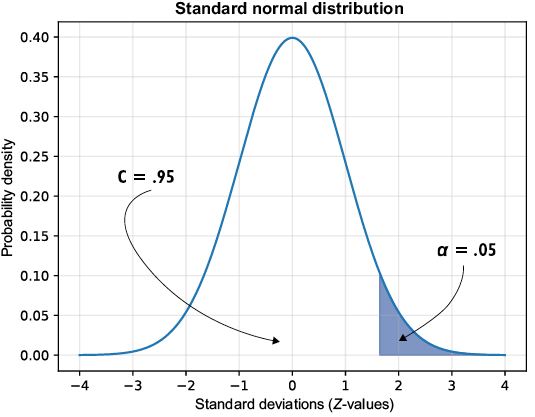
If our test Z-value falls into the significant region, we reject H0. Otherwise, we fail to reject H0.
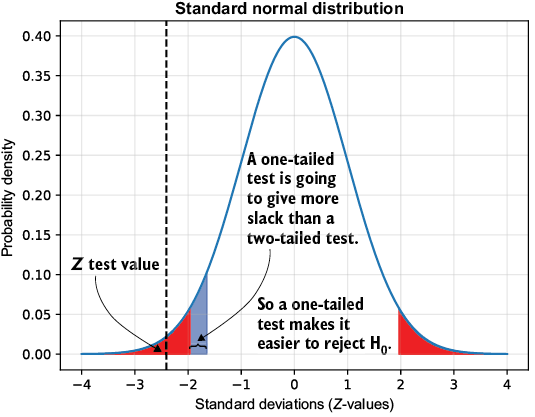
A one-tailed test makes it easier to reject H0 because the tail makes a bigger target to hit.
Zooming in on the left tail, the p-value for our left-tailed test is compared with α = .05. Because the area of p is less than α, we reject the null hypothesis.
Summary

  • Hypothesis testing uses sample data to make inferences about a population parameter, often to test a claim or theory.
  • The null hypothesis (H0) represents the status quo or no-effect assumption (e.g., “the population mean is 100”), which we assume to be true unless strong evidence suggests otherwise.
  • The alternative hypothesis (Ha) states what we suspect might be true instead (for example, “the population mean differs from 100”), and we use sample data to decide whether there’s enough evidence to reject H0 in favor of Ha.
  • Two-tailed tests check for any difference from the hypothesized value (Ha: parameter ≠ value), splitting the significance level (α) across both tails of the distribution.
  • One-tailed tests are directional: left-tailed for “less than” (Ha: parameter < value) or right-tailed for “greater than” (Ha: parameter > value), with α concentrated in one tail.
  • To reject H0, the test statistic (calculated from the sample) must fall in the critical region (defined by α, such as 0.05 for 5% significance), or the p-value must be less than α, indicating that the sample result is unlikely under H0.
  • For tests on means, use the standard normal distribution if the sample size n > 30; prefer the t-distribution (with df = n – 1) for n ≤ 30. Many practitioners use the t-distribution in all cases to be safe.

FAQ

What is a hypothesis test?A hypothesis test is a statistical experiment used to check a claim about a population, such as whether a product’s average amount matches what is advertised.
What do the null hypothesis and alternative hypothesis mean?The null hypothesis is the status quo claim, usually that nothing special is happening. The alternative hypothesis is the competing claim that the sample or population differs in some meaningful way.
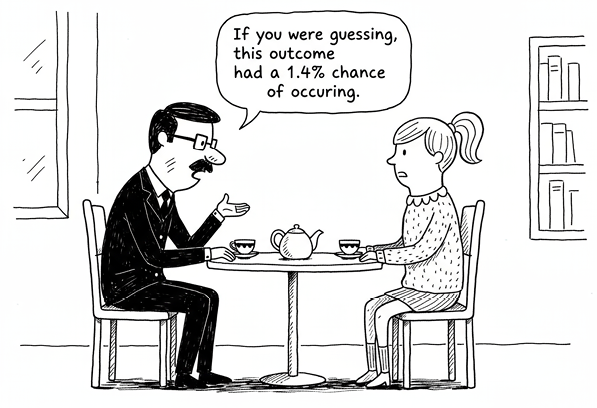
How is the tea-party example used to explain p-values?Muriel Bristol claimed she could tell whether milk or tea was poured first. Fisher tested this with eight cups. The chance of getting all eight correct by guessing was about 1.4%, which illustrates a p-value as the probability of an outcome at least that extreme if the null hypothesis were true.
What does a p-value actually tell us?A p-value is the probability of observing a result as extreme as, or more extreme than, the sample data, assuming the null hypothesis is true. It is not the probability that the null hypothesis itself is true or false.
What is the difference between a two-tailed test and a one-tailed test?A two-tailed test checks whether a value is different in either direction from the hypothesized mean. A one-tailed test checks only one direction, such as whether the value is less than or greater than the claim.
How do alpha and confidence level relate to each other?The significance level alpha is the tail area outside the confidence region. For example, a 95% confidence level corresponds to an alpha of 0.05, split as 0.025 in each tail for a two-tailed test.
How do you decide whether to reject the null hypothesis?For a critical-value approach, reject the null hypothesis if the test statistic falls in the rejection region. For a p-value approach, reject the null hypothesis if the p-value is less than or equal to alpha.
When should you use a t-test instead of a z-test?Use a t-test when the sample is small, typically 30 or fewer observations, or when population variance is unknown and uncertainty is higher. T-tests are also commonly preferred in practice even for larger samples.
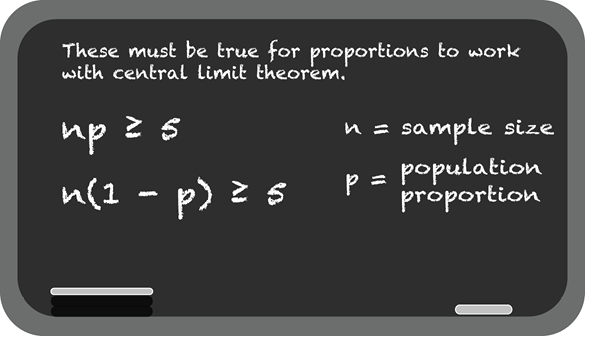
How do hypothesis tests work for proportions?For proportions, you compare a sample proportion p-hat to a hypothesized population proportion p using a z-style test, as long as the sample size is large enough to satisfy the required conditions.
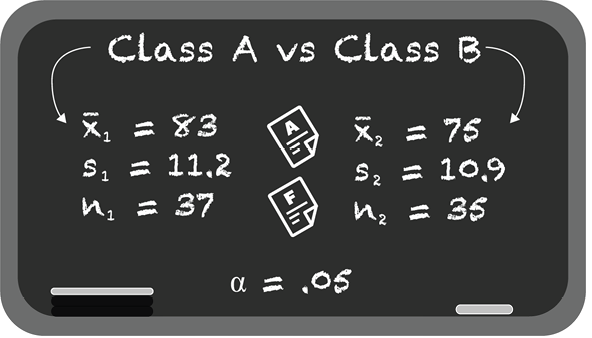
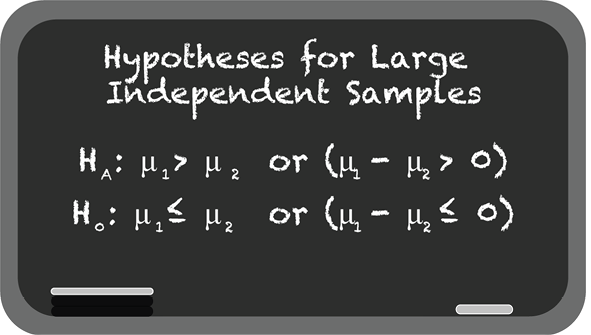
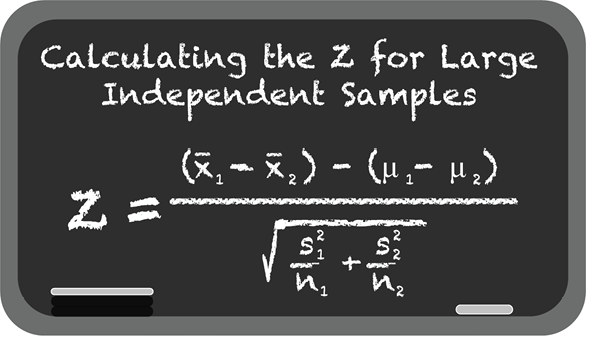
What is the main idea behind testing independent samples?Independent-sample tests compare two unrelated groups, such as Classroom A and Classroom B, to see whether their population means differ enough to reject the null hypothesis.

pro $24.99 per month

  • access to all Manning books, MEAPs, liveVideos, liveProjects, and audiobooks!
  • choose one free eBook per month to keep
  • exclusive 50% discount on all purchases
  • renews monthly, pause or cancel renewal anytime

lite $19.99 per month

  • access to all Manning books, including MEAPs!

team

5, 10 or 20 seats+ for your team - learn more


choose your plan

team

monthly
annual
$49.99
$499.99
only $41.67 per month
  • five seats for your team
  • access to all Manning books, MEAPs, liveVideos, liveProjects, and audiobooks!
  • choose another free product every time you renew
  • choose twelve free products per year
  • exclusive 50% discount on all purchases
  • renews monthly, pause or cancel renewal anytime
  • renews annually, pause or cancel renewal anytime
  • Grokking Statistics ebook for free