Probability is presented as a way to reason about uncertainty rather than force a single deterministic answer. The text explains that probabilities can come from data, from expert belief, or from a combination of both, and that they are expressed as values between 0 and 1 whose complements add up to 1. Through examples like a water-damaged laptop and an election forecast, it emphasizes that uncertainty is unavoidable in real life, so good judgment often means quantifying how strongly we believe different outcomes instead of pretending only one outcome is possible.
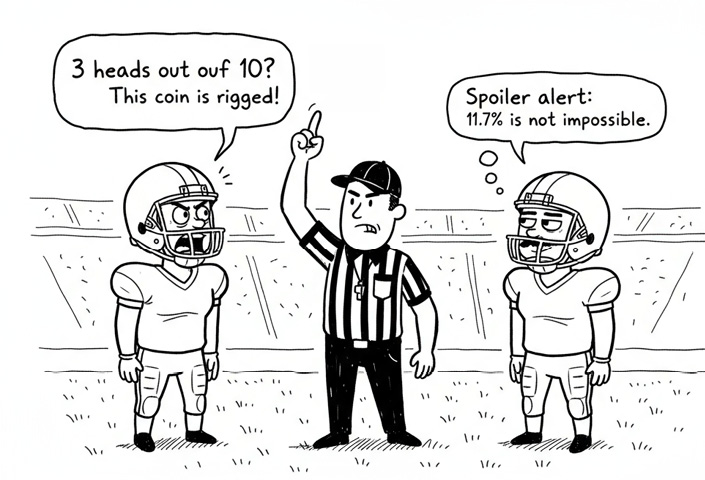
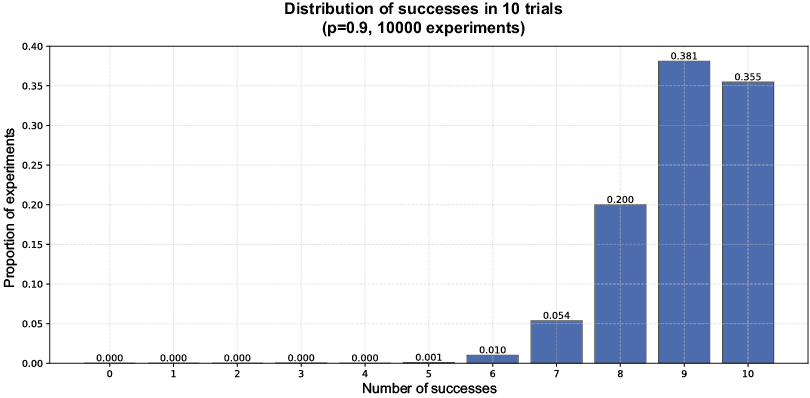
From there, the chapter builds up the idea of probability distributions as tools for describing random variables and the likelihood of their outcomes. It introduces the Bernoulli distribution for a single two-outcome event, the discrete distribution for multiple categorical outcomes, and the binomial distribution for repeated trials with a fixed success rate. These ideas are used to show how simulations and formulas can answer practical questions, such as whether a manufacturing process that claims a 90% success rate is likely to produce only 7 successes out of 10 trials.
The chapter then extends the same reasoning to continuous distributions, especially the beta distribution for estimating unknown success rates and the Poisson and exponential distributions for event counts and waiting times. It shows how the beta distribution can express uncertainty about a true success rate using areas under a curve, while Poisson models how often events occur in a fixed interval and exponential models the time between them. The chapter closes by tying these distributions together in simple Monte Carlo simulations, reinforcing the main lesson: choose the distribution that matches the structure of the problem, and use probability to model messy reality with more nuance and flexibility.


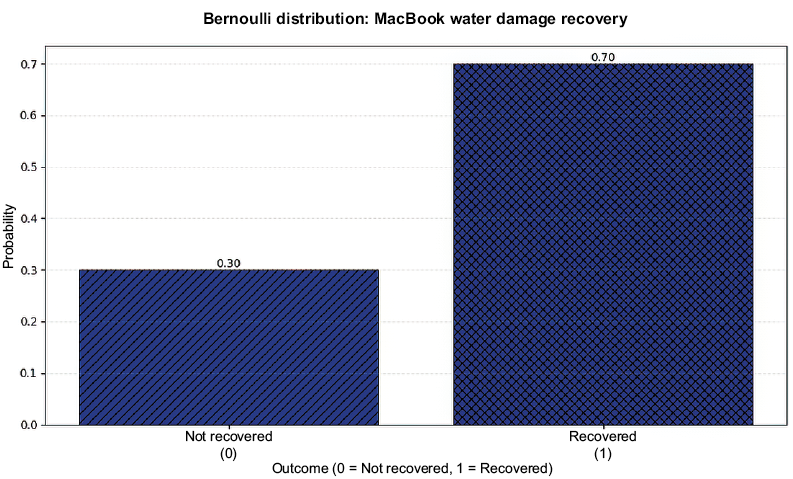
Visualizing the Bernoulli distribution
Visualizing the discrete distribution
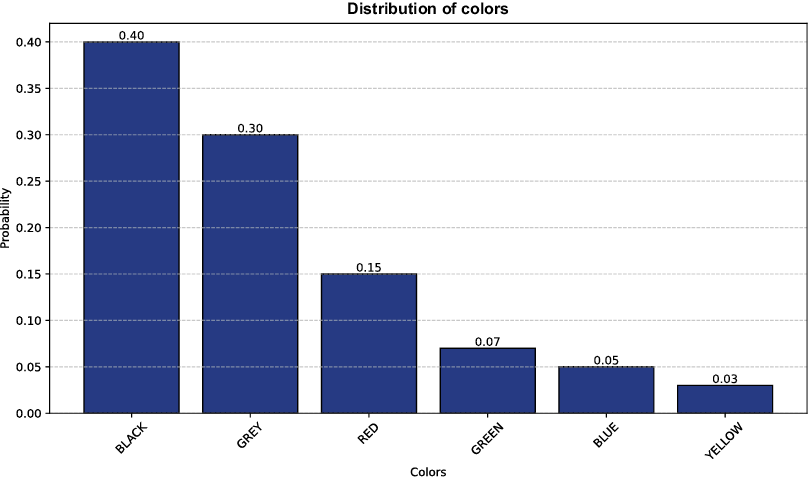

Proportions of outcomes for our simulation of 10,000 experiments, each with 10 trials
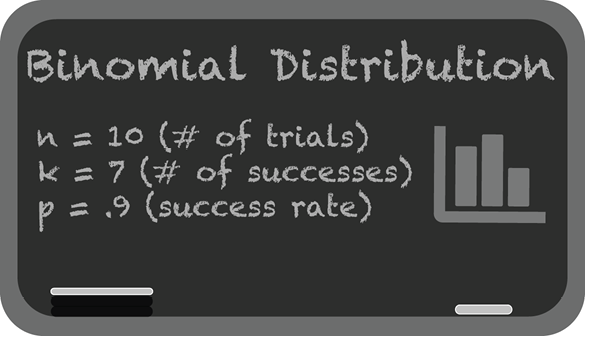
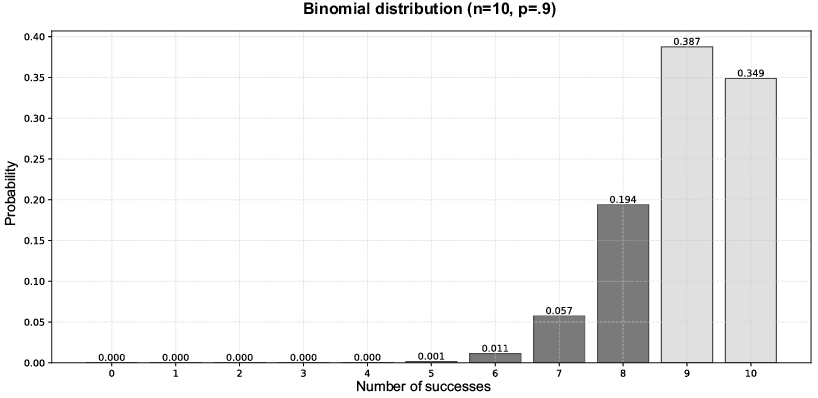
A plot of a binomial distribution
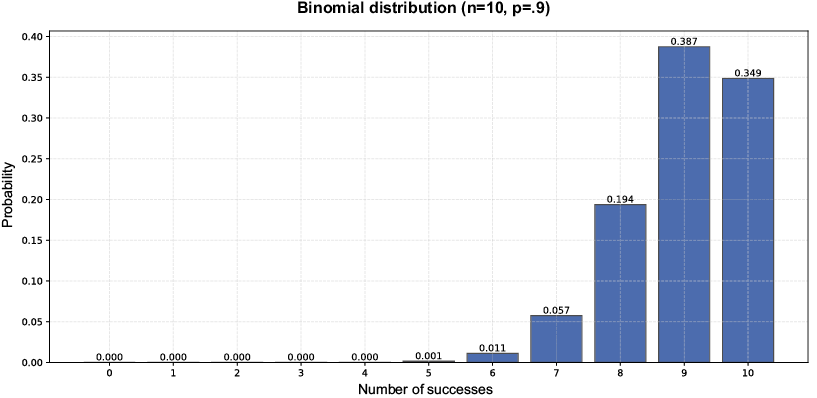
We are interested in finding the probability of 8 or fewer successes (shaded in black).
The beta distribution showing probabilities of success rates for a single trial
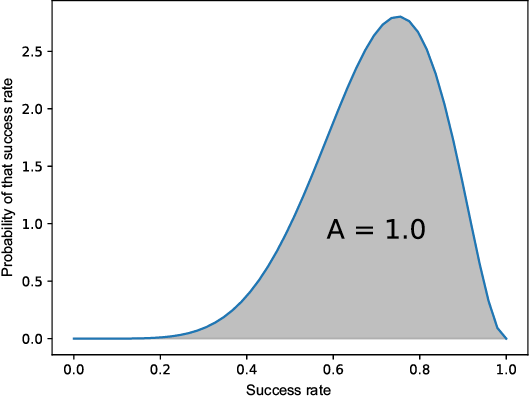
The beta distribution, like all continuous probability distributions, must have an area of 1.0 under the curve.
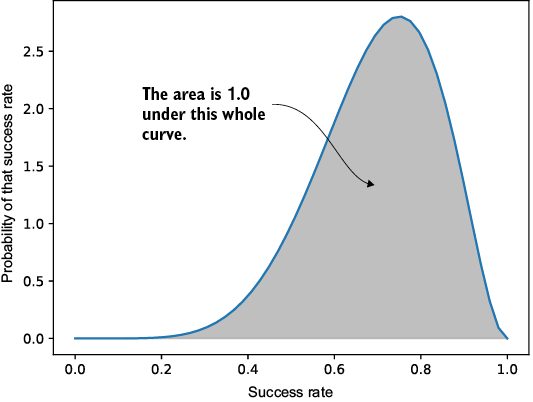
We want to find this area for the range between .4 and .7.
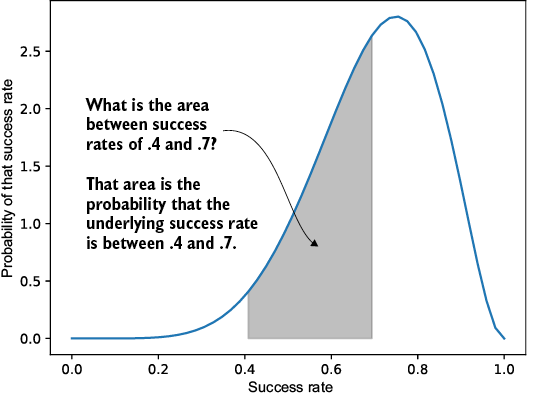
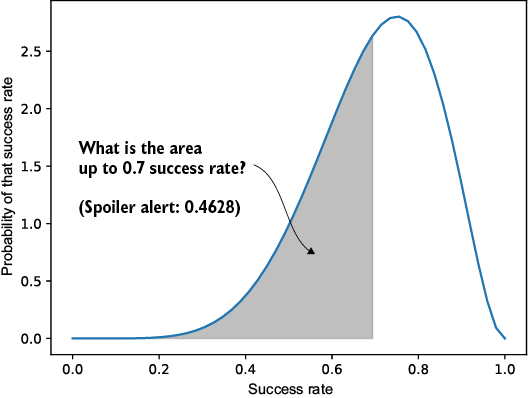
The area up to x = .7 in our beta distribution
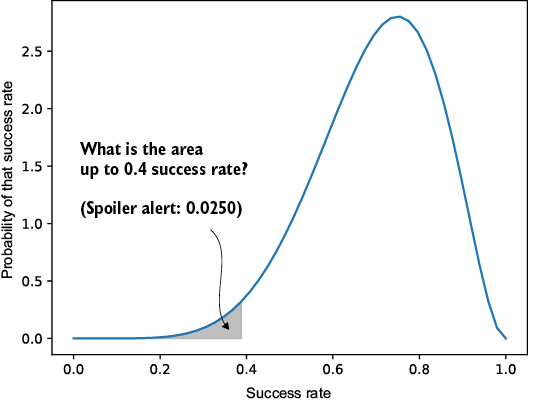
The area up to x = .4 in our beta distribution
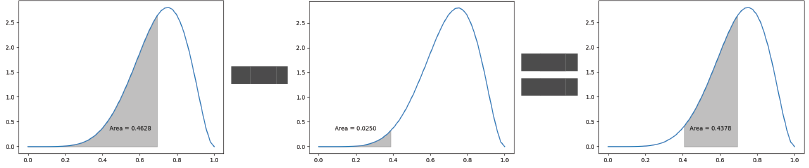
The area between .4 and .7 can be visualized as subtracting their two respective areas as defined.

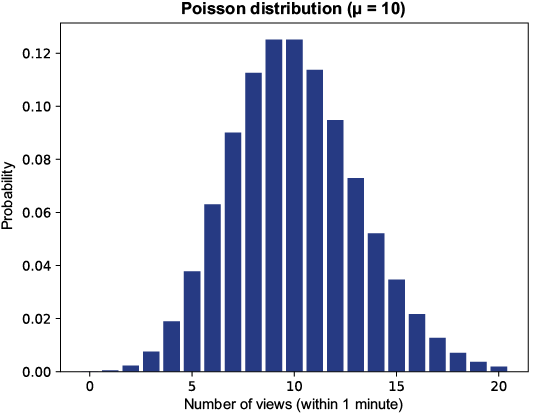
The Poisson distribution for our YouTube video views, showing the probability of getting x views in 1 minute
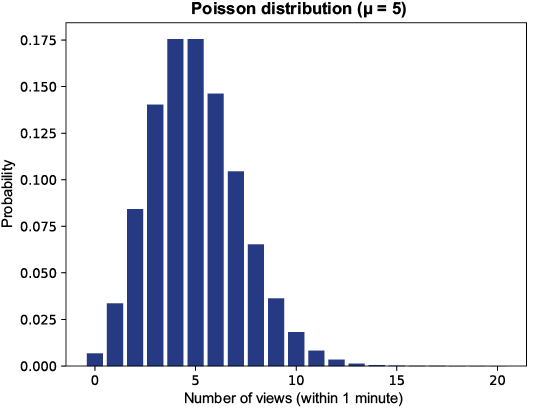
The Poisson distribution when the average views per minute is 5
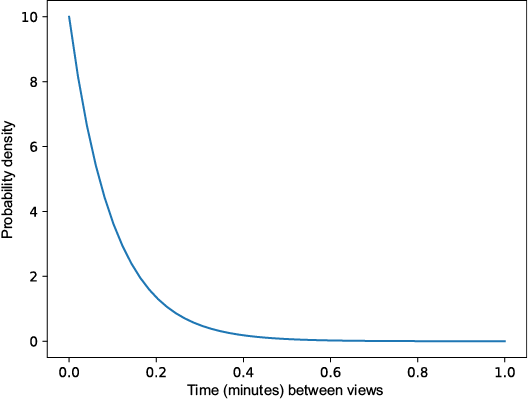
The exponential distribution for a YouTube video
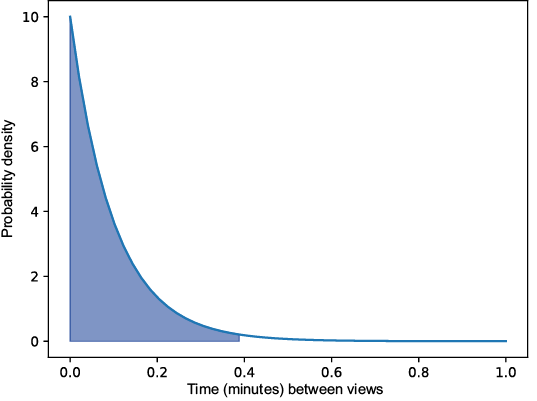
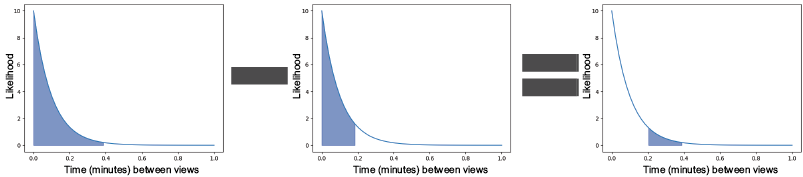
The area reflecting the probability of .4 minutes (24 seconds) or less of time elapsing between two consecutive views
Using subtraction with the CDF to find an area/probability in a middle range
Summary
- Probability describes how likely we believe an event is to happen, and it can be based on data or beliefs.
- Beliefs can be quantified through odds, and the quality of data and beliefs affects the quality of a probability.
- Discrete distributions model probabilities with a finite number of outcomes, like true or false, five color options of a product line, or the number of successes in a fixed number of trials.
- Continuous distributions model probabilities over floating-point values, effectively having an infinite number of outcomes, such as the height of adults or the time between YouTube views.
- The binomial distribution models the probabilities of k successes out of a fixed number of trials n, given the probability of success p.
- The beta distribution models the probabilities of success rates with so many successes and failures.
- The Poisson distribution models the probability of how many times an event may occur over an interval, such as a period of time.
- The exponential distribution models how much time may pass between events, given the average time between two events.
- Monte Carlo simulations can randomly generate values from probability distributions to model real-life problems.

 Grokking Statistics ebook for free
