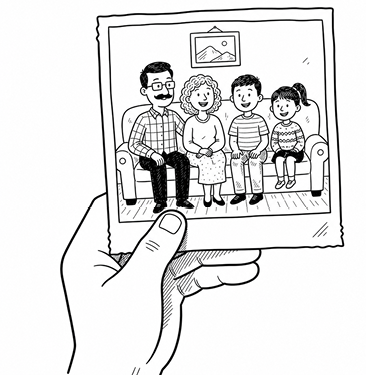
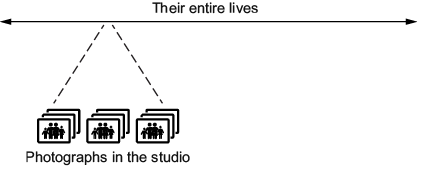
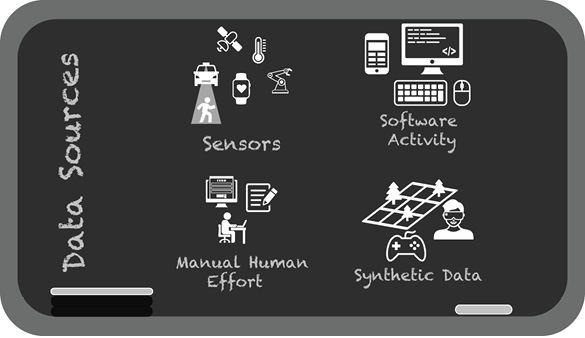
Statistics begins with a practical view of data: it is not raw truth, but recorded observations that capture only snapshots of a larger reality. The chapter emphasizes that data is created in specific ways, from sensors, software activity, human effort, or synthetic generation, and that every source has limits, missing context, and potential bias. Using the family-photo thought experiment, it shows why broad conclusions cannot be drawn from a small or curated set of observations, and why it is better to start with a clear question and collect data for that purpose rather than trying to mine meaning from whatever happens to be available.
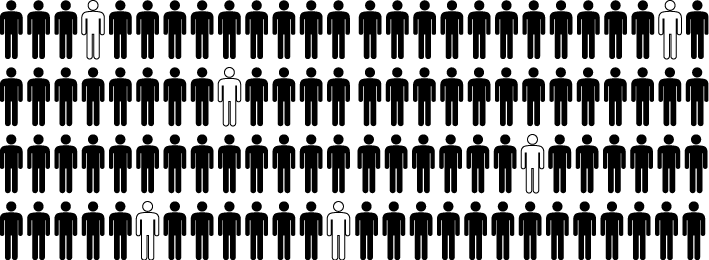
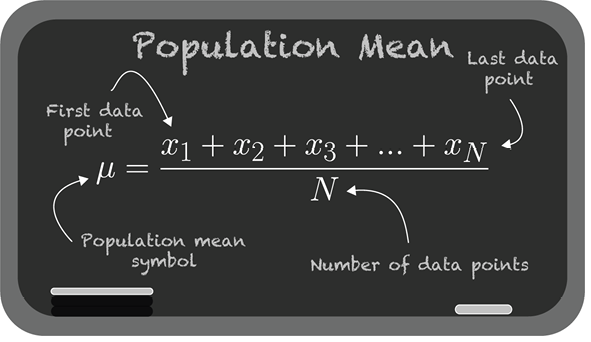
The text also explains the relationship between samples and populations. A population is the full group of interest, while a sample is the smaller subset used to make inferences about that group. Because complete measurement is often impossible, especially for large or abstract populations, statistical work usually depends on sampling. But sampling can go wrong through bias, such as self-selection or unrepresentative recruitment, so the chapter encourages readers to treat all data as a sample by default and to think carefully about what it can and cannot represent.
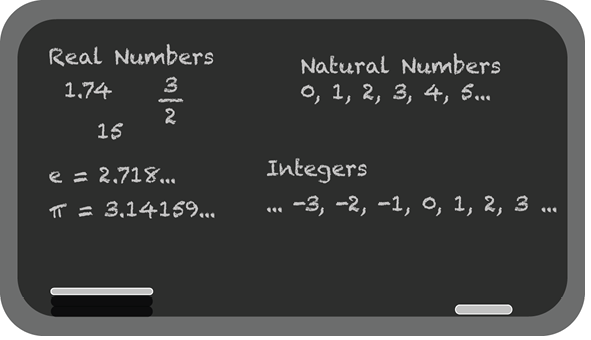
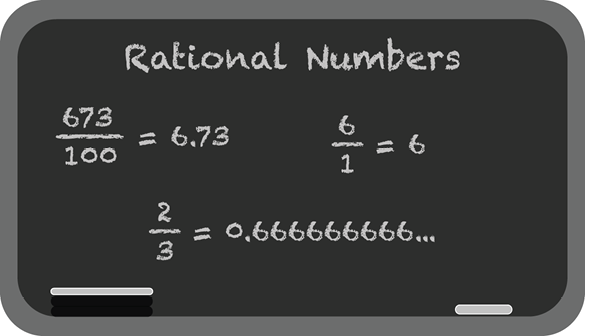
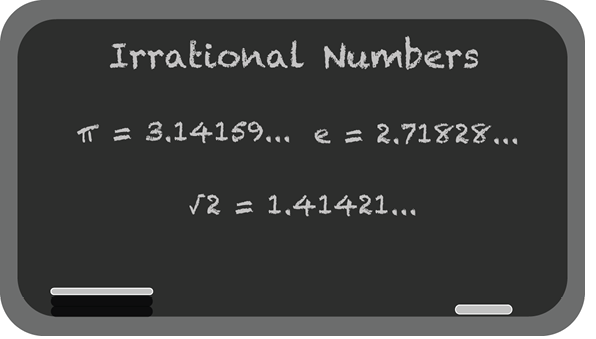
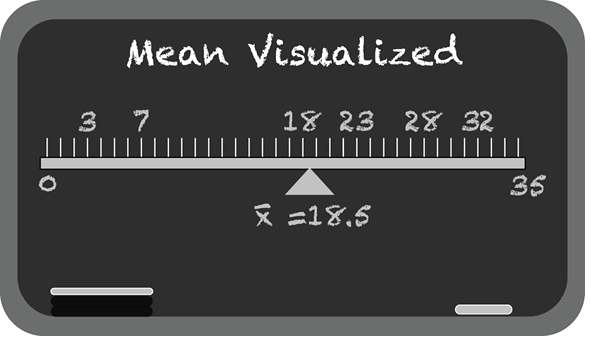
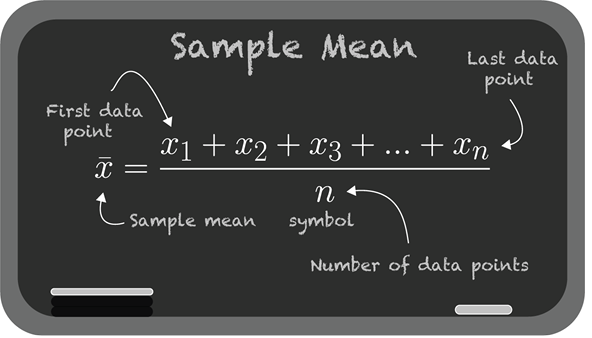
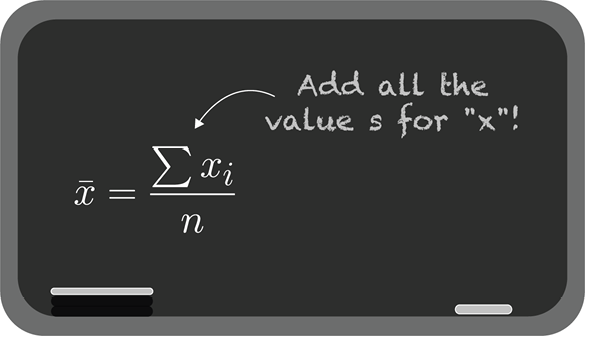
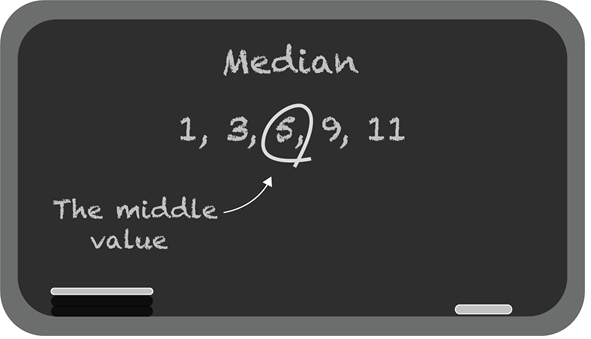
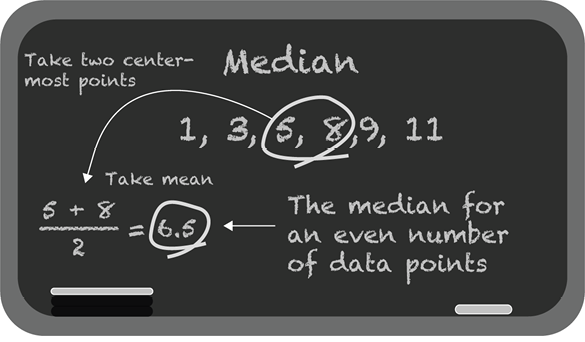
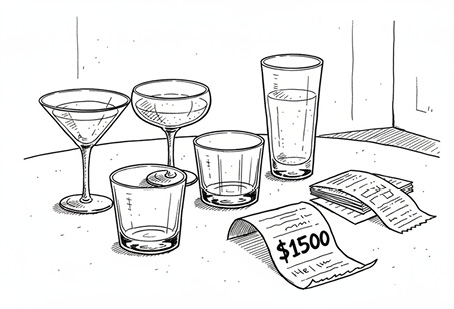
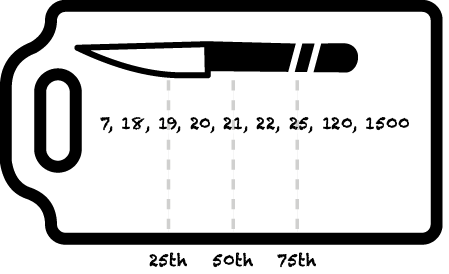
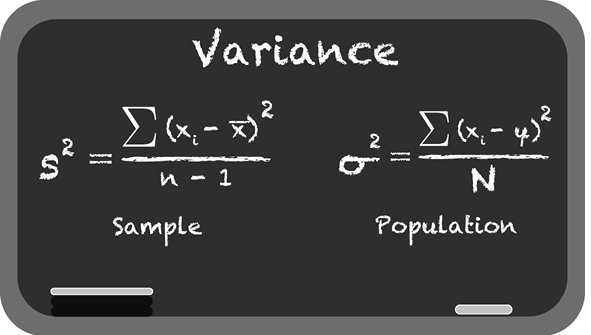
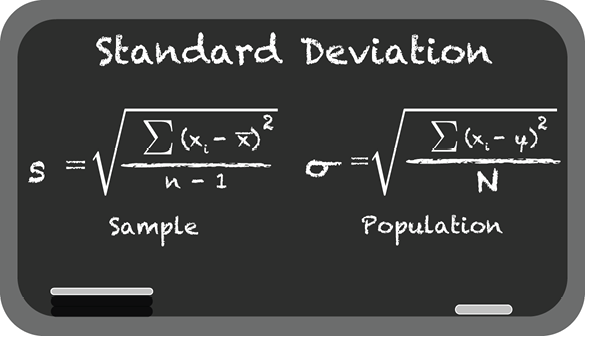
After establishing that foundation, the chapter turns to numeric data types and common descriptive measures. It distinguishes natural numbers, integers, real numbers, and floating-point approximations, then introduces the mean, median, percentile, mode, variance, and standard deviation as tools for summarizing center and spread. The examples show why the mean can be distorted by outliers, why the median and interquartile range are often more robust, and how variance and standard deviation quantify dispersion. A tornado dataset brings the ideas together by showing that wide, right-skewed data can hide useful patterns unless summary measures are chosen with care and interpreted in context.
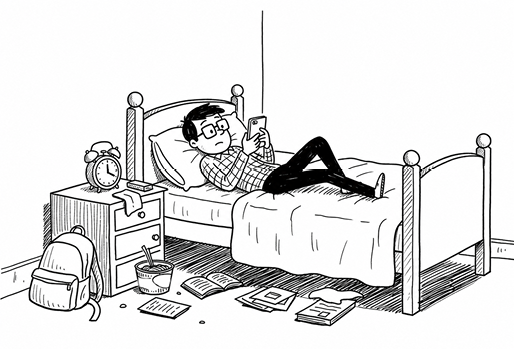
Randomly selecting six people in a dormitory to participate in a sleep study
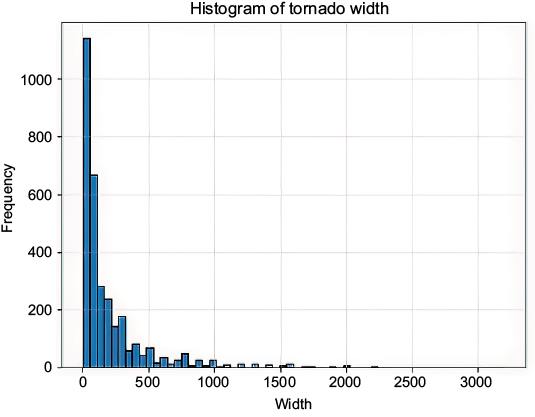
A histogram of tornado width
Summary
Data, like photographs, can capture only so much. There will inevitably be missing context, gaps, and biases.
A sample is a random subset of a population that we use to infer attributes of the population, and it is good practice to treat any data we encounter as a sample.
Number theory provides a way to reason about numbers and which measures make sense, and the mean, median, percentile, and mode give a sense of which numbers we can expect most often from a dataset.
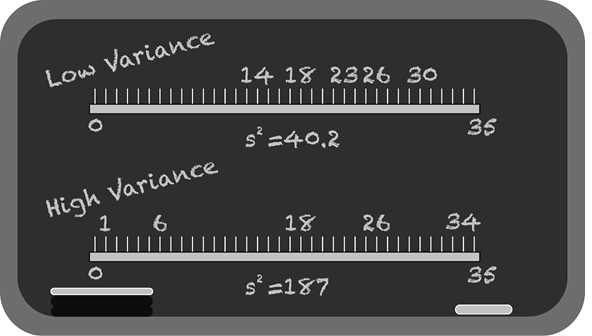
Understanding how spread out numeric data is helps measure its predictability, and tools such as percentiles, interquartile ranges, variance, and standard deviation all help measure spread.
The NOAA tornado data provided a real-world use case: working with a real-world dataset in pandas and evaluating whether tornado width might relate to severity.
FAQ
What is data in statistics?Data is recorded measurements or observations collected in a systematic way. In practice, it is best thought of as evidence or clues about something larger, not as perfect truth.Why is it important to ask where data comes from?Because data quality depends on how it was created, what instrument collected it, and what context or limitations affected it. Knowing the source helps you judge whether the data is trustworthy and representative.Why does the book compare data to a photograph?A photograph is a snapshot taken at one moment, just like data captures only part of a larger story. Both can miss important context, hidden conditions, and everything that happened outside the frame.What are the main sources of data mentioned in the chapter?The chapter identifies four common sources: sensors, software activity, manual human effort, and synthetic data. Each source creates data in a different way and comes with different strengths and limitations.What is the difference between a population and a sample?A population is the entire group you want to study, while a sample is a subset of that population used to make inferences. Since populations are often too large or inaccessible, we usually rely on samples.Why should we usually treat data as a sample rather than a population?Because real-world data is rarely complete, and there are always missing cases, hidden variables, and uncertainty. Treating data as a sample reminds us that it represents something larger and possibly unseen.What is sampling bias?Sampling bias happens when a sample is not representative of the population because some groups are overrepresented and others are underrepresented. This can lead to misleading conclusions.What kinds of numeric data types are discussed in the chapter?The chapter covers natural numbers, integers, real numbers, rational numbers, irrational numbers, and also mentions booleans, dates, strings, and categories as common data types in practice.When should you use the mean, median, percentile, or mode?The mean is useful for central tendency when data is fairly balanced, the median is better when outliers skew the data, percentiles help describe position and spread, and the mode identifies the most frequent value, especially in categorical or discrete data.Why are variance and standard deviation important?They measure how spread out the data is around the mean. Variance gives spread in squared units, while standard deviation is easier to interpret because it is in the same units as the original data.
pro $24.99 per month
access to all Manning books, MEAPs, liveVideos, liveProjects, and audiobooks!

 Grokking Statistics ebook for free
