7 How do you measure classification models? Accuracy and its friends
This chapter emphasizes that evaluating classification models is as critical as training them. While accuracy is the simplest starting point, it can be misleading—especially with imbalanced data or when different mistakes carry different costs. To address this, the chapter introduces false positives and false negatives and uses the confusion matrix to organize outcomes. It then explores metrics tailored to different priorities: precision and recall, the combined F-score (with the tunable Fβ to favor recall or precision), the medically oriented sensitivity and specificity, and the ROC curve with its AUC summary.
Through contrasting scenarios—diagnosing coronavirus versus filtering spam—the chapter shows why the “best” metric depends on the consequence of errors. When missing positives is costly (e.g., disease detection), recall/sensitivity matters most; when flagging negatives as positives is costly (e.g., deleting good emails), precision or specificity becomes the focus. Precision measures the correctness among predicted positives (penalizing false positives), recall measures coverage of actual positives (penalizing false negatives), and the F1-score uses the harmonic mean to reward balance. Fβ generalizes this trade-off so practitioners can weight recall or precision based on domain needs, acknowledging that any single metric can be gamed if used in isolation.
The ROC framework ties these ideas together by tracking sensitivity versus specificity as a model’s decision threshold varies. Lower thresholds raise sensitivity but reduce specificity; higher thresholds do the opposite. Plotting these trade-offs yields the ROC curve, and the AUC provides a single measure of discriminative power (1 is perfect, 0.5 is random). Crucially, ROC analysis helps choose thresholds that align with application goals, making it a practical tool for improving models and making informed decisions about error trade-offs. The chapter closes by clarifying that recall equals sensitivity, while precision and specificity differ, and by stressing the importance of selecting metrics and thresholds that reflect real-world costs.
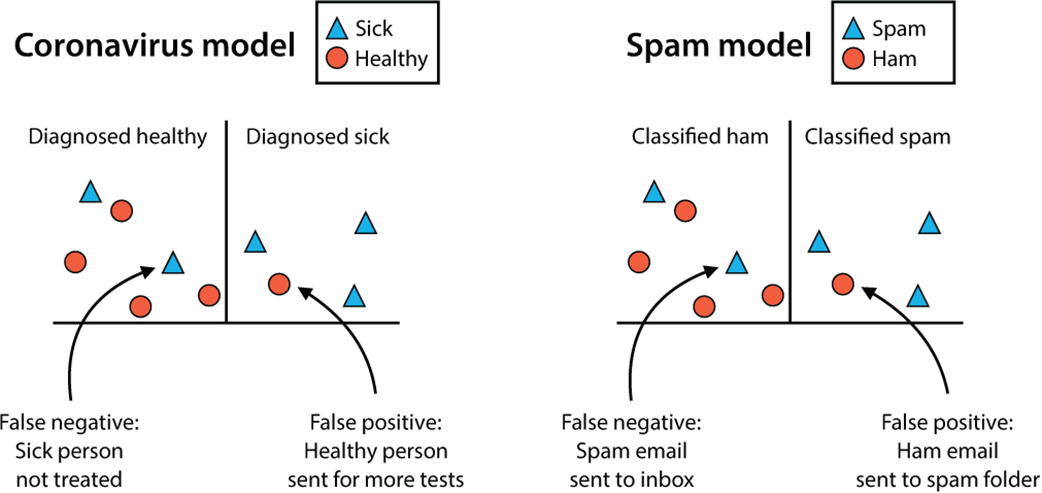
Examples of two models that are widely used in real life and that we’ll use throughout this chapter. On the left, a coronavirus model where the people are diagnosed as healthy or sick. On the right, a spam-detection model where the emails are classified as spam or ham. For each model, we have highlighted some of their errors and separated them as false positives and false negatives.
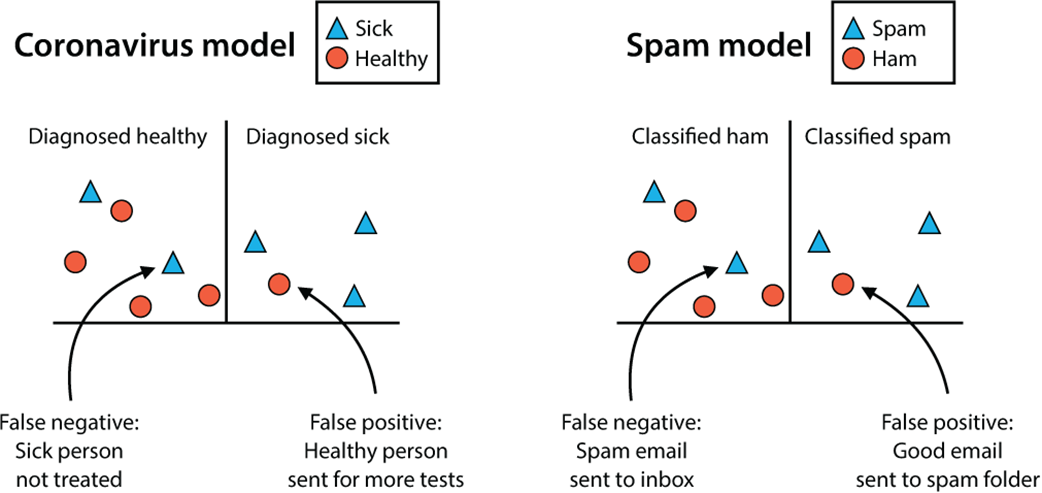
On the left, a coronavirus model where the people are diagnosed as healthy or sick; on the right, a spam detection model where the emails are classified as spam or ham
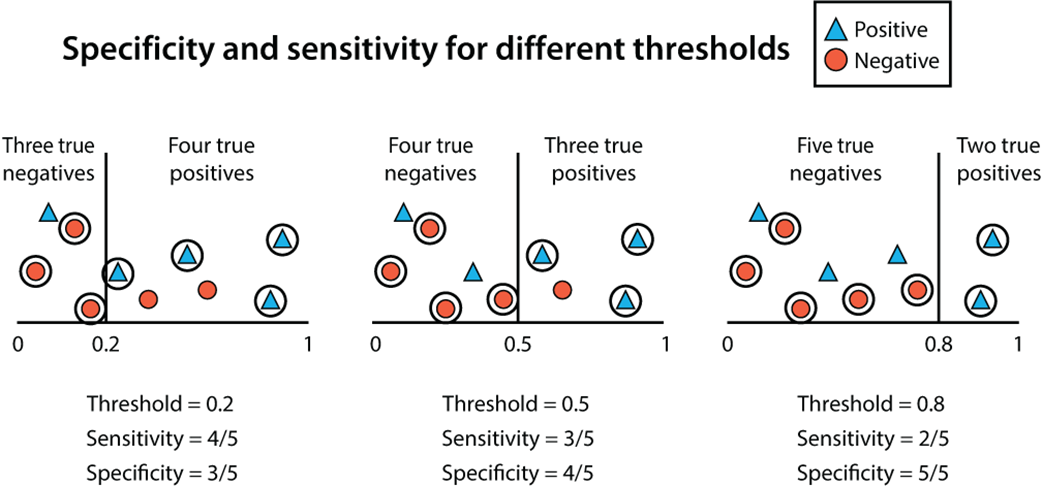
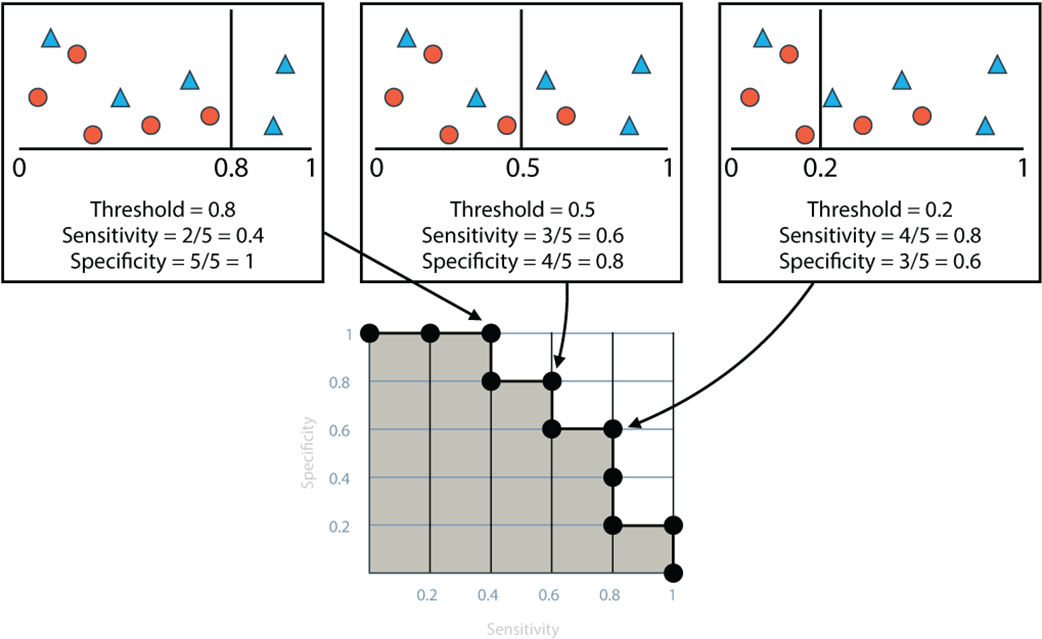
The effects of moving the threshold on the sensitivity and the specificity. On the left, we have a model with a low threshold; in the middle, we have one with a medium threshold; and on the right, we have one with a high threshold. For each of the models, there are five positive and five negative points. Each model is represented by the vertical line. The model predicts that the points to the right of the line are positive and those to the left are negative. For each of the models, we’ve counted the number of true positives and true negatives, that is, the number of positive and negative points that have been correctly predicted. We have used those to calculate the sensitivity and the specificity. Note that as we increase the threshold (i.e., as we move the vertical line from left to right), the sensitivity goes down and the specificity goes up.
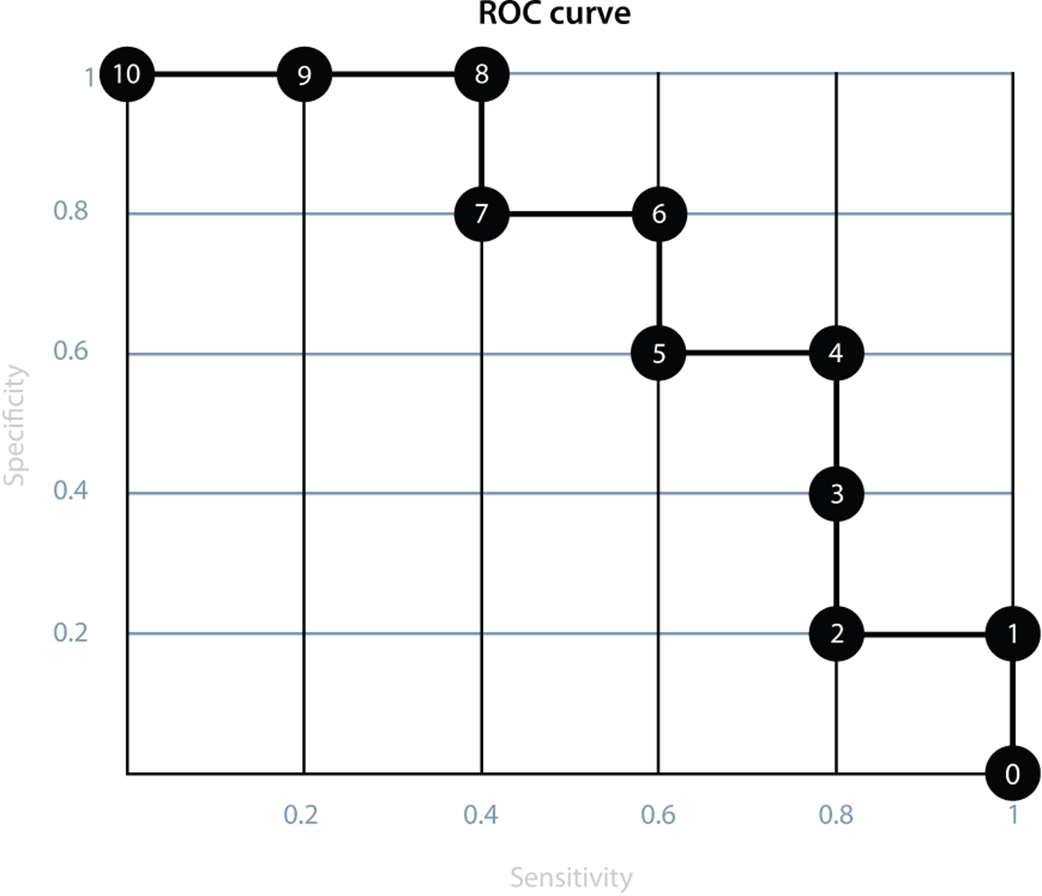
Here we can see the ROC curve corresponding to our ongoing example, which gives us a great deal of information on our model. The highlighted dots correspond to the timesteps obtained by moving our threshold from 0 to 1, and each dot is labeled by the timestep. On the horizontal axis we record the sensitivity of the model at each timestep, and on the vertical axis we record the specificity.
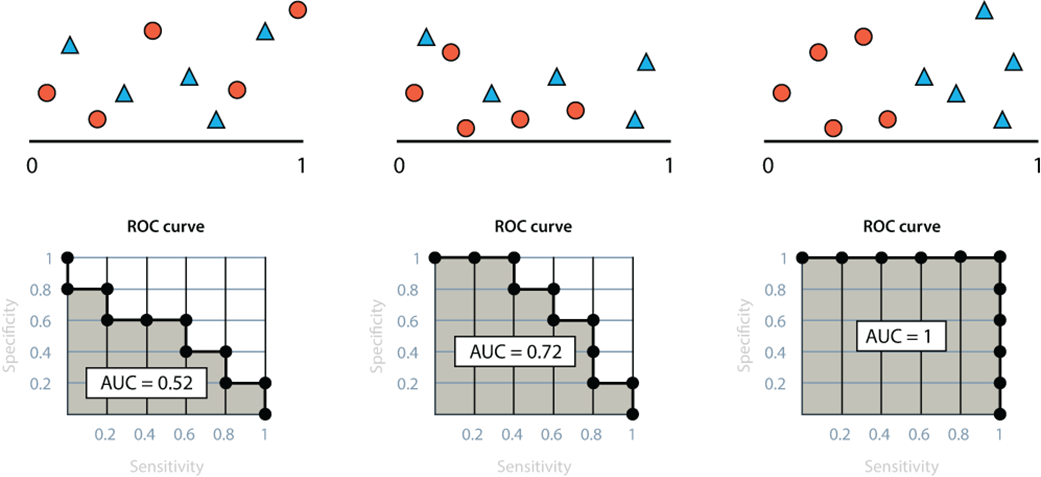
In this figure, we can see that AUC, or area under the curve, is a good metric to determine how good a model is. The higher the AUC, the better the model. On the left, we have a bad model with an AUC of 0.52. In the middle, we have a good model with an AUC of 0.72. On the right, we have a great model with an AUC of 1.
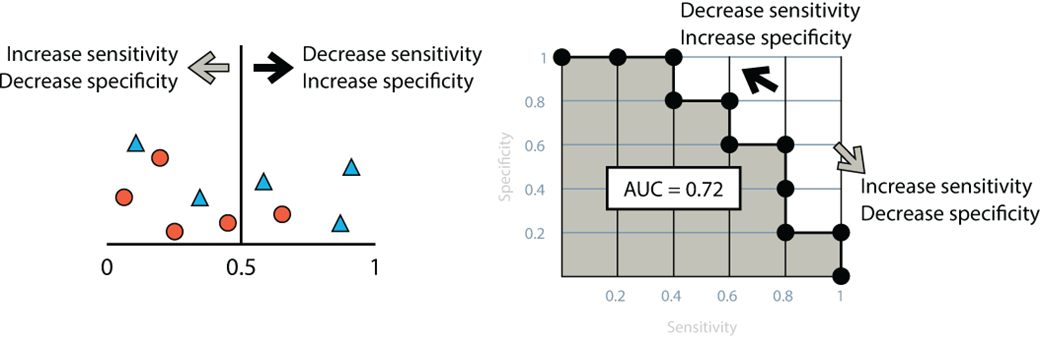
The threshold of the model has a lot to do with the sensitivity and the specificity, and this relationship will help us pick the perfect threshold for our model. On the left, we have our model and, on the right, the corresponding ROC curve. As we increase or decrease the threshold, we change the sensitivity and specificity of the model, and this change is illustrated by moving in the ROC curve.
The parallel between the threshold of the model and its ROC. The model on the left has a high threshold, low sensitivity, and high specificity. The model in the middle has medium values for threshold, sensitivity, and specificity. The model on the right has a low threshold, high sensitivity, and low specificity.
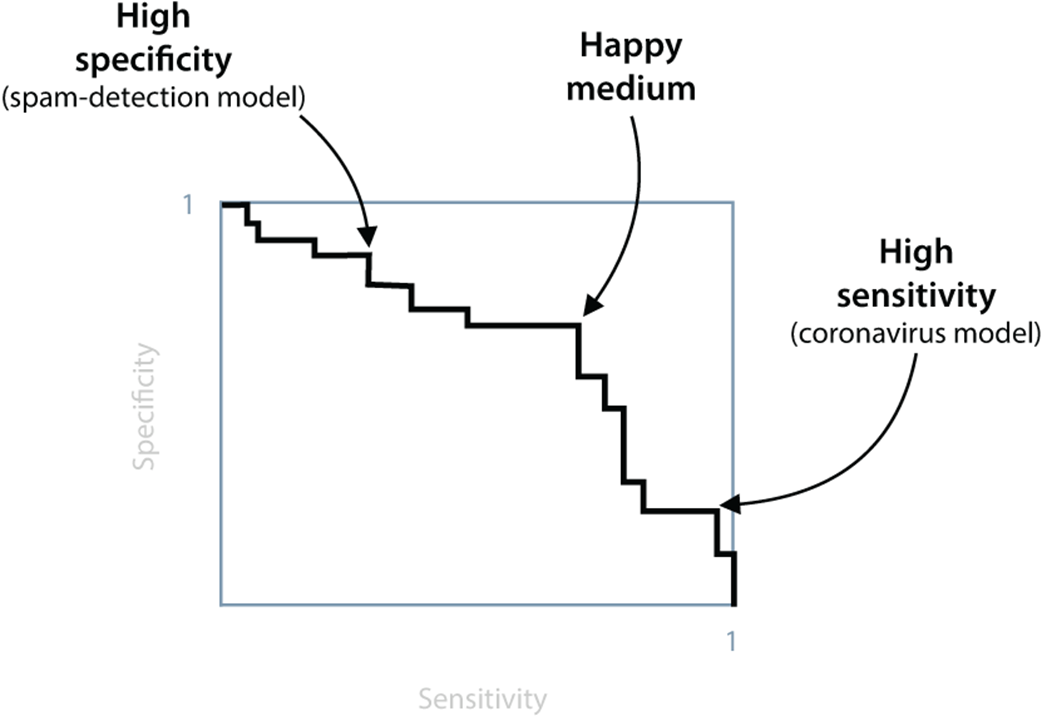
In this more general scenario, we can see an ROC curve and three points on it corresponding to three different thresholds. If we want to pick a threshold that gives us high specificity, we pick the one on the left. For a model with high sensitivity, we pick the one on the right. If we want a model that has a good amount of both sensitivity and specificity, we pick the one in the middle.
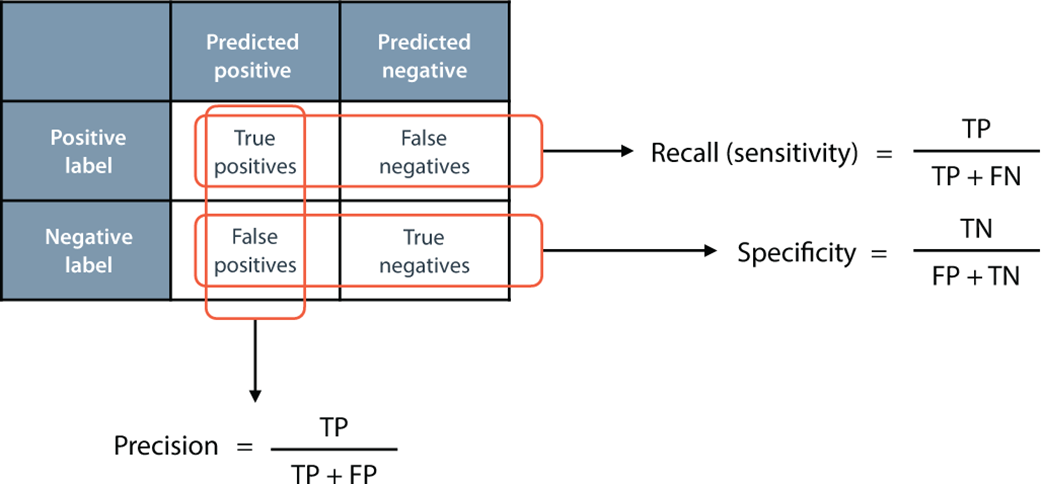
The top row of the confusion matrix gives us recall and sensitivity: the ratio between the number of true positives and the sum of true positives and false negatives. The leftmost column gives us precision: the ratio between the number of true positives and the sum of true positives and false positives. The bottom row gives us specificity: the ratio between the number of false positives and the sum of false positives and true negatives.
FAQ
Why isn’t accuracy enough to evaluate a classifier?
Accuracy is the share of correct predictions out of all predictions, but it can be misleading when classes are imbalanced or when different errors have different costs. For example, in a medical dataset with 1% positives, a model that predicts “negative” for everyone achieves ~99% accuracy but misses all sick patients. You need metrics that distinguish error types (false positives vs false negatives) to see the full picture.What are true/false positives and true/false negatives?
- True positive (TP): positive example predicted positive.- False negative (FN): positive example predicted negative.
- False positive (FP): negative example predicted positive.
- True negative (TN): negative example predicted negative.
Which error matters more depends on the task (for disease screening, FN is worse; for spam filters that delete mail, FP is worse).
What is a confusion matrix and how do I read it?
A confusion matrix is a 2x2 table for binary classification with true labels on rows and predicted labels on columns. The diagonal (TP and TN) shows correct predictions; the off-diagonal (FP and FN) shows mistakes. It lets you count each outcome and compute metrics like accuracy, precision, recall, sensitivity, and specificity.What is recall and when should I prioritize it?
Recall measures how many actual positives the model correctly found: Recall = TP / (TP + FN). Prioritize recall when missing a positive is costly (for example, medical diagnosis, fraud detection). High recall means few false negatives; you may tolerate more false positives to capture nearly all positives.What is precision and when should I prioritize it?
Precision measures how many predicted positives are actually positive: Precision = TP / (TP + FP). Prioritize precision when a false alarm is costly (for example, auto-deleting spam, triggering expensive interventions). High precision means few false positives; you may accept missing some positives.What are the F1 and Fβ scores and why use the harmonic mean?
The F1-score balances precision (P) and recall (R) using the harmonic mean: F1 = 2PR / (P + R). The harmonic mean penalizes low values more than the arithmetic mean, so a model must have both P and R reasonably high. Fβ lets you weight one side more: Fβ = (1+β²)·PR / (β²·P + R). Use β>1 to emphasize recall; β<1 to emphasize precision.How do sensitivity and specificity relate to recall and precision?
- Sensitivity (true positive rate) = TP / (TP + FN). This is exactly the same as recall.- Specificity (true negative rate) = TN / (TN + FP). This is not the same as precision. Specificity focuses on correctly identifying negatives, while precision focuses on the correctness of positive predictions.
What is the ROC curve and how do I build it?
The ROC curve tracks performance as you vary the decision threshold of a probabilistic classifier. For each threshold from 0 to 1, compute sensitivity (TPR) and specificity (TNR). In this chapter’s convention, plot sensitivity on the x-axis and specificity on the y-axis. Lowering the threshold increases sensitivity (fewer FN) but reduces specificity (more FP); raising it does the opposite.What is AUC and how should I interpret it?
AUC (area under the ROC curve) summarizes overall ranking quality. Higher is better: 1.0 is perfect, ~0.5 is no better than random. If AUC < 0.5, flipping the model’s positive/negative predictions would yield AUC > 0.5, so the practical worst case is ~0.5.How do I choose a decision threshold using the ROC curve?
Pick a point on the ROC that matches your cost trade-offs:- Need high sensitivity (few FN)? Move toward higher sensitivity (lower threshold), accepting lower specificity.
- Need high specificity (few FP)? Move toward higher specificity (higher threshold), accepting lower sensitivity.
- Need balance? Choose a middle point or optimize Fβ with a β that reflects your priorities.

 Grokking Machine Learning, Second Edition ebook for free
