6 A continuous approach to splitting points: Logistic classifiers
This chapter replaces hard, yes/no decisions with soft, probabilistic ones by introducing logistic classifiers—a continuous version of perceptrons that output scores between 0 and 1. A linear score from the input features is passed through the sigmoid function to produce a probability that can be interpreted as confidence in a class (for instance, the likelihood a sentence is “happy”). A 0.5 threshold can still yield a binary decision, but the probability itself carries richer information. The chapter motivates this continuous view with intuitive examples, shows how it supports evaluation and decision-making, and previews practical uses such as sentiment analysis and the extension to multiple classes via the softmax function.
To measure how well a logistic classifier fits data, the chapter evaluates several error functions and lands on log loss (cross-entropy) as the preferred choice. Absolute and square errors behave sensibly but are bounded and less aligned with probability theory. Log loss, derived from the negative log-likelihood of the observed labels, adds across examples, penalizes overconfident mistakes more severely, and makes it easy to compare models: lower total log loss indicates a better classifier. Conceptually, it asks the model to assign high probability to the true label of each point, converting products of probabilities into sums of logarithms for numerical stability and analytical convenience.
Training proceeds via the logistic regression algorithm, a gradient-descent procedure that repeatedly applies the “logistic trick.” Concretely, weights and bias are nudged by the term (y − ŷ) scaled by the feature values and a learning rate, which has an intuitive geometric effect: move the decision boundary closer to misclassified points and farther from correctly classified ones. The approach generalizes to many features and is typically implemented with stochastic or mini-batch updates; coding it by hand shows the log loss steadily decreasing, while a scikit-learn pipeline demonstrates a real application on IMDB movie reviews using bag-of-words features. Finally, the chapter introduces softmax to handle more than two classes by exponentiating class scores and normalizing them into a coherent probability distribution (which reduces to the sigmoid in the binary case).

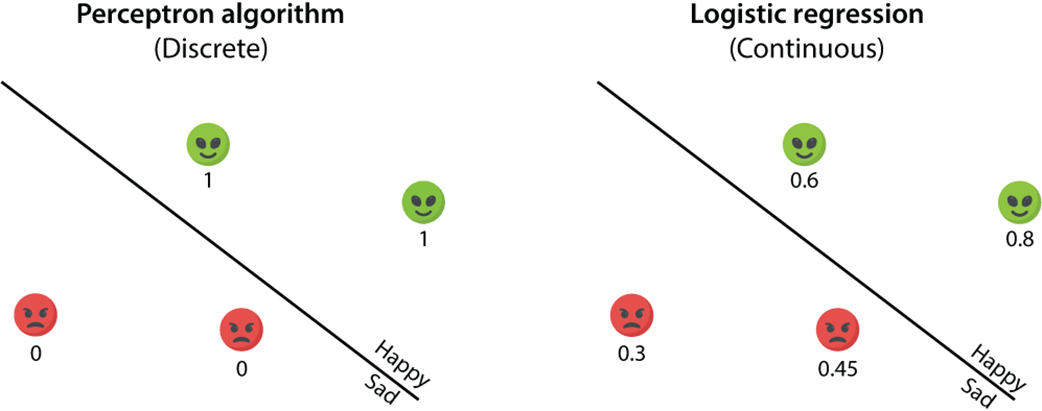
Left: The perceptron algorithm trains a discrete perceptron, where the predictions are 0 (happy) and 1 (sad). Right: The logistic regression algorithm trains a continuous perceptron, where the predictions are numbers between 0 and 1 which indicate the predicted level of happiness.
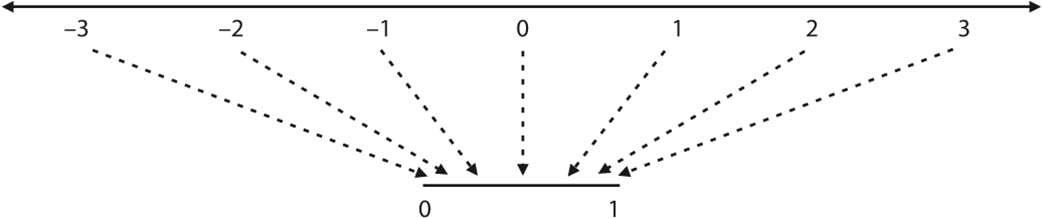
The sigmoid function sends the entire number line to the interval (0,1).
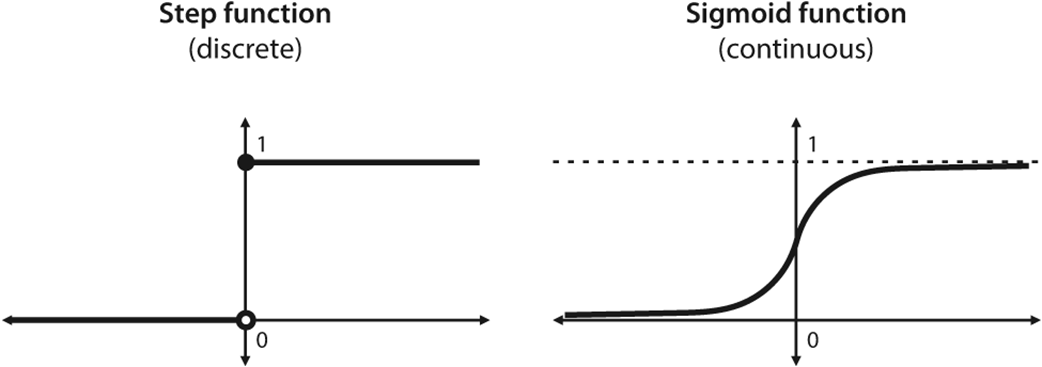
Left: The step function used to build discrete perceptrons. It outputs a value of 0 for any negative input and a value of 1 for any input that is positive or zero. It has a discontinuity at zero. Right: The sigmoid function used to build continuous perceptrons. It outputs values less than 0.5 for negative inputs and values greater than 0.5 for positive inputs. At zero, it outputs 0.5. It is continuous and differentiable everywhere.
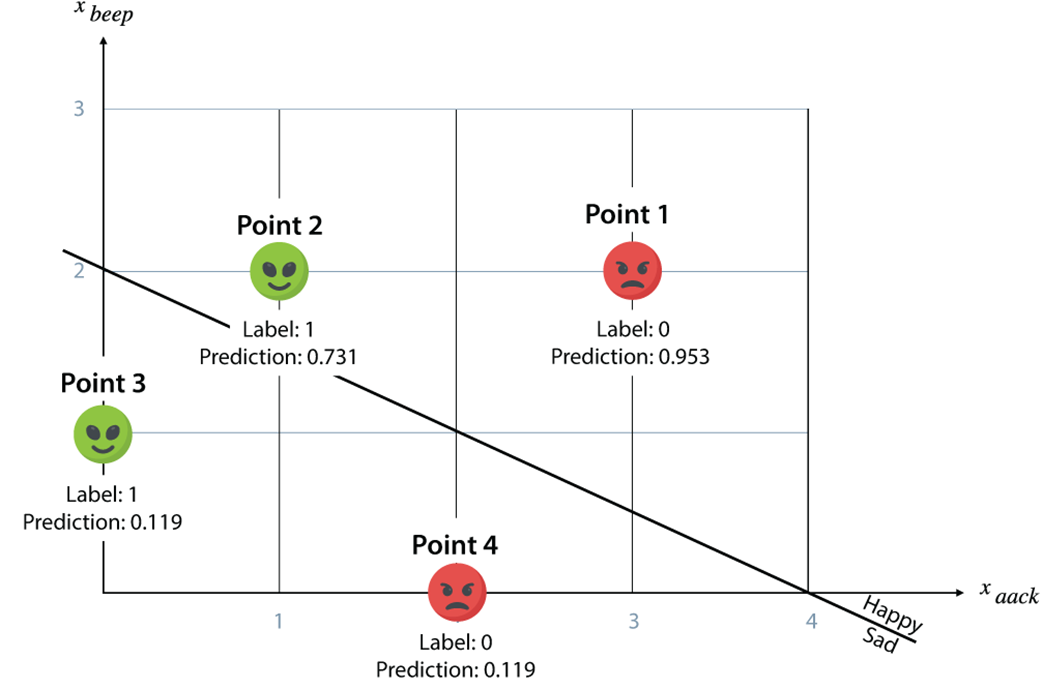
The plot of the dataset in table 6.2 with predictions. Notice that points 2 and 4 are correctly classified, but points 1 and 3 are misclassified.
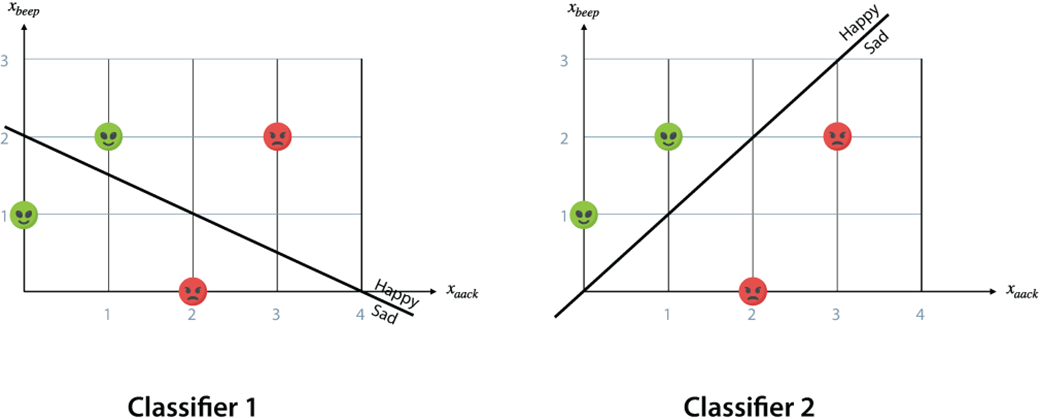
Left: A bad classifier that makes two mistakes. Right: A good classifier that classifies all four points correctly.
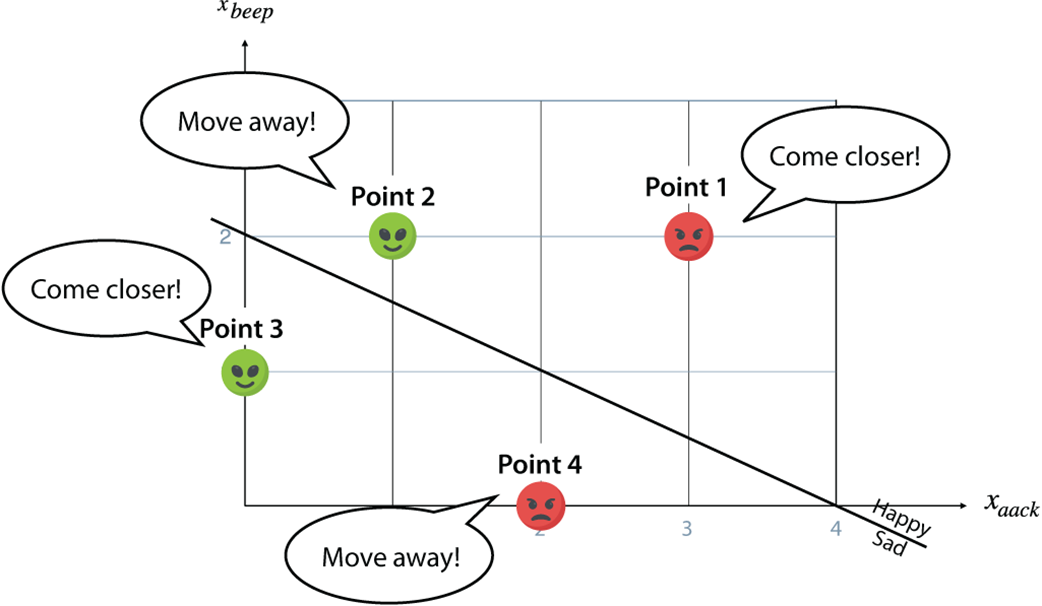
In the logistic regression algorithm, every point has a say. Points that are correctly classified tell the line to move farther away, to be deeper in the correct zone. Points that are incorrectly classified tell the line to come closer, in hopes of one day being on the correct side of the line.
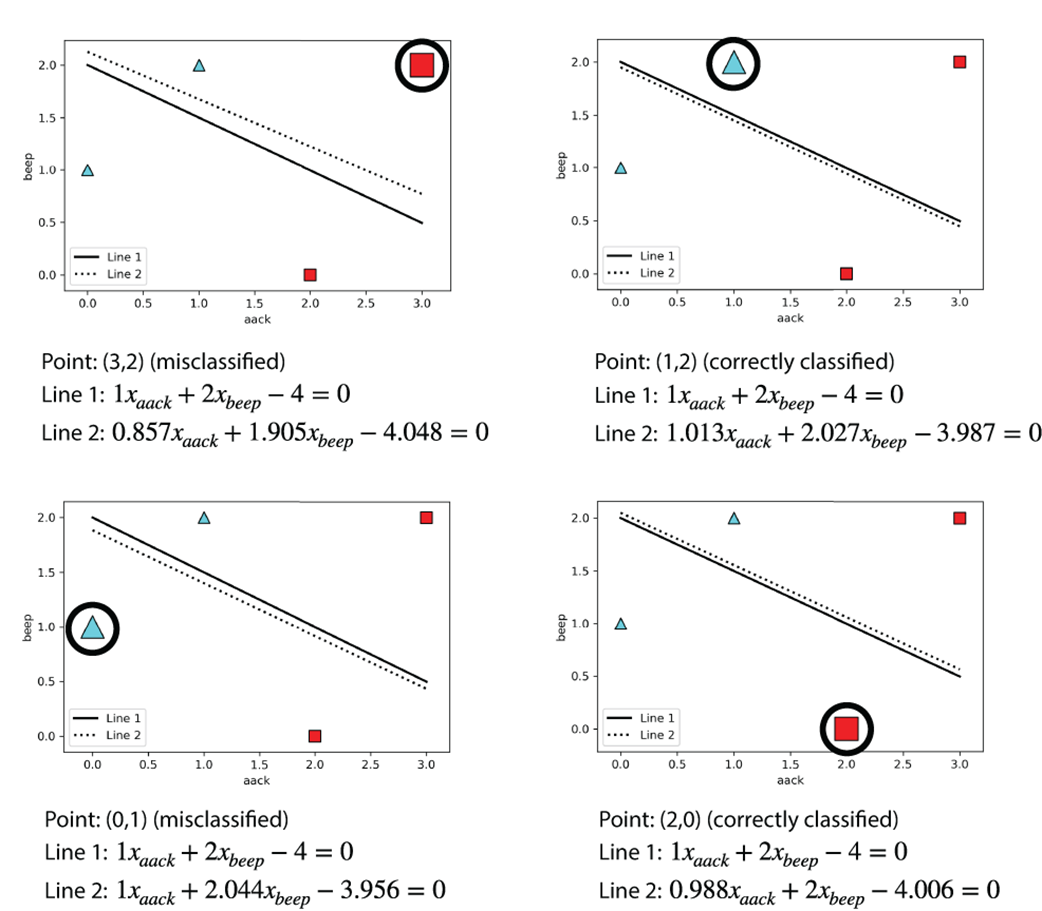
The logistic trick applied to each of the four data points. Notice that for correctly classified points, the line moves away from the point, whereas for misclassified points, the line moves closer to the point.
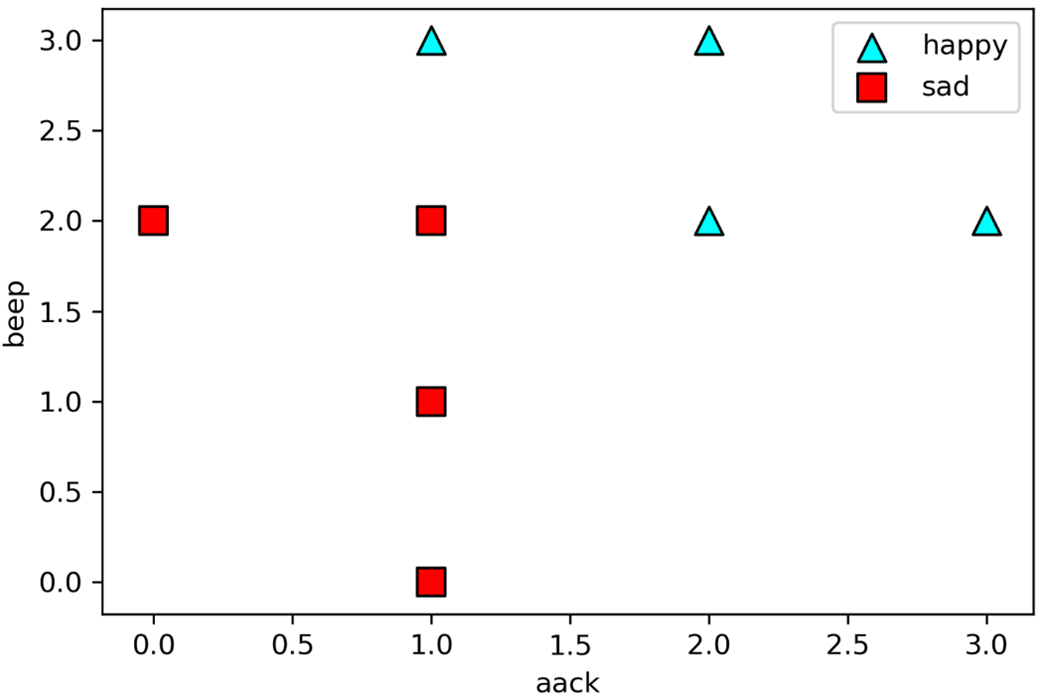
The plot of our dataset, where the happy sentences are represented by triangles and the sad sentences by squares.
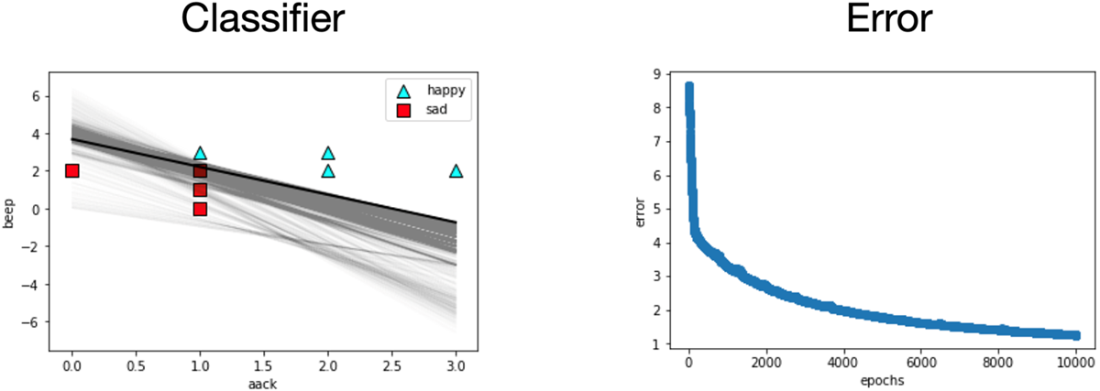
Left: The plot of the resulting classifier, and the intermediate steps. Right: The error plot. Notice that the more epochs we run the logistic regression algorithm, the lower the error gets.

 Grokking Machine Learning, Second Edition ebook for free
