8 Mixture models: Modeling implicit group memberships
Mixture models are introduced as a way to handle data that appears to come from hidden subgroups, even when those groups are not directly observed. Instead of forcing one distribution to explain a multimodal dataset, the model assumes several component distributions are blended together, each representing a latent population. In the customer-spending example and the Old Faithful waiting-time data, this lets the model capture distinct patterns such as low, medium, and high spenders or short and long eruption waits that a single Gaussian would miss.
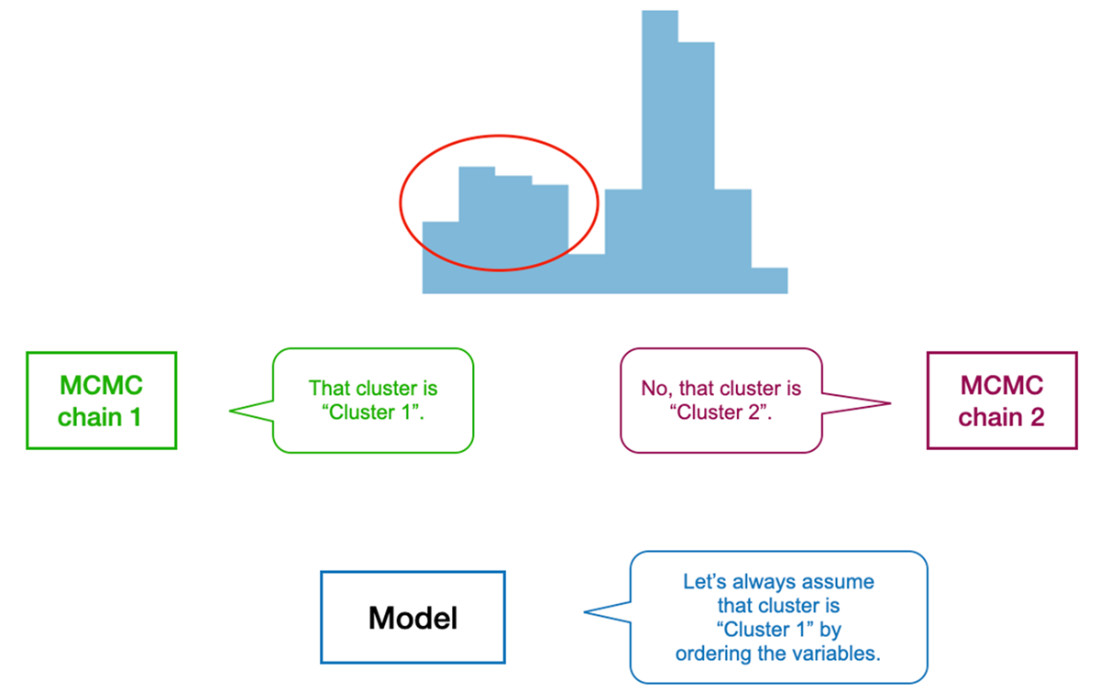
The chapter then shows how to build a Bayesian Gaussian mixture model by treating the mixture weights, means, and standard deviations as random variables. A Dirichlet prior is used for the weights because they must be nonnegative and sum to one, while normal and half-normal priors are used for component centers and spreads. Bayesian inference provides posterior distributions rather than just point estimates, which gives uncertainty over cluster locations, overlap regions, and membership probabilities for each datapoint. The chapter also highlights the label switching problem, where symmetric components can swap identities during sampling, and shows that ordering the component means is a practical fix that stabilizes inference without changing the model itself.
Finally, the chapter extends the idea to cases where the number of clusters is unknown by using the stick-breaking process, a Bayesian nonparametric approach inspired by Dirichlet processes. This procedure generates a potentially unbounded set of mixture weights from beta-distributed ratios, with a concentration parameter controlling whether the model prefers a few large groups or many small ones. In practice, the process is truncated to a manageable number of components, and the data determine which ones matter, as seen in the Old Faithful example where a larger model still identifies only two meaningful clusters. The chapter closes by pointing to real-world uses of mixture models in areas such as gene expression analysis, customer segmentation, and economics.
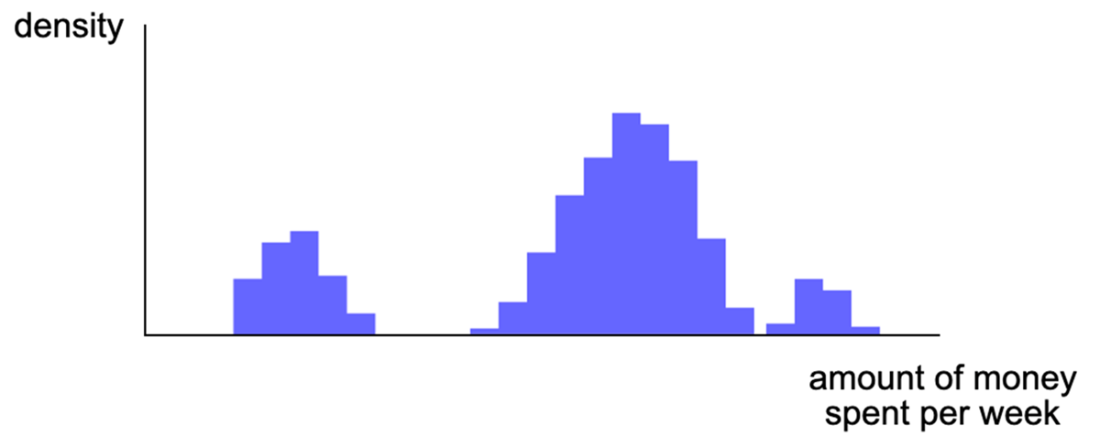
Example data showing multiple spending patterns that can’t be modeled using a single probability distribution.
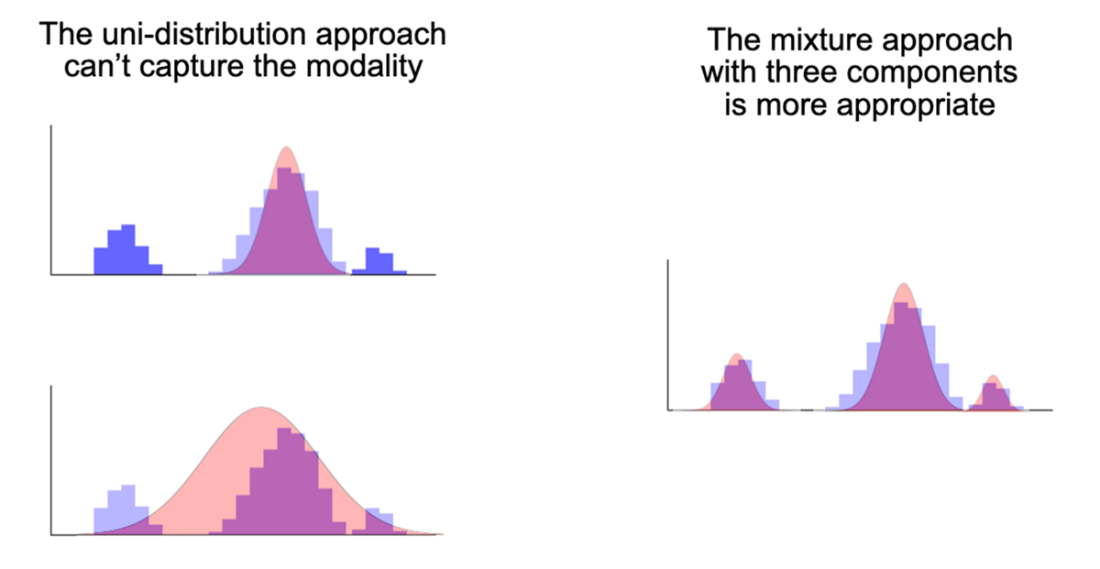
A single Gaussian distribution cannot adequately model multiple modes within the data. The situation calls for a mixture model, where each component is responsible for capturing a mode.
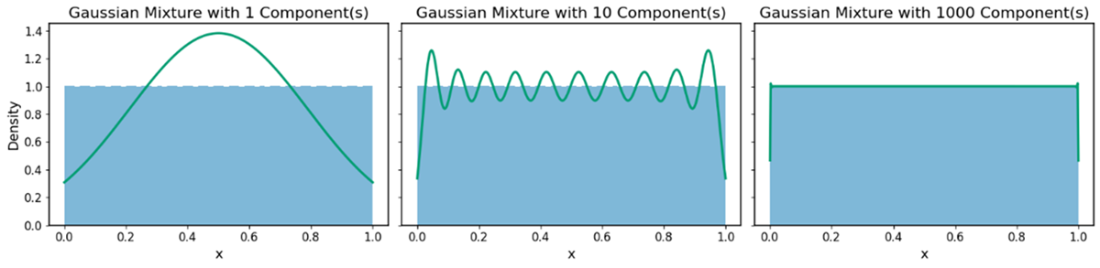
Mixtures of varying numbers of Gaussians approximating a uniform distribution. As the number of components at our disposal increases, the quality of the approximation becomes higher.
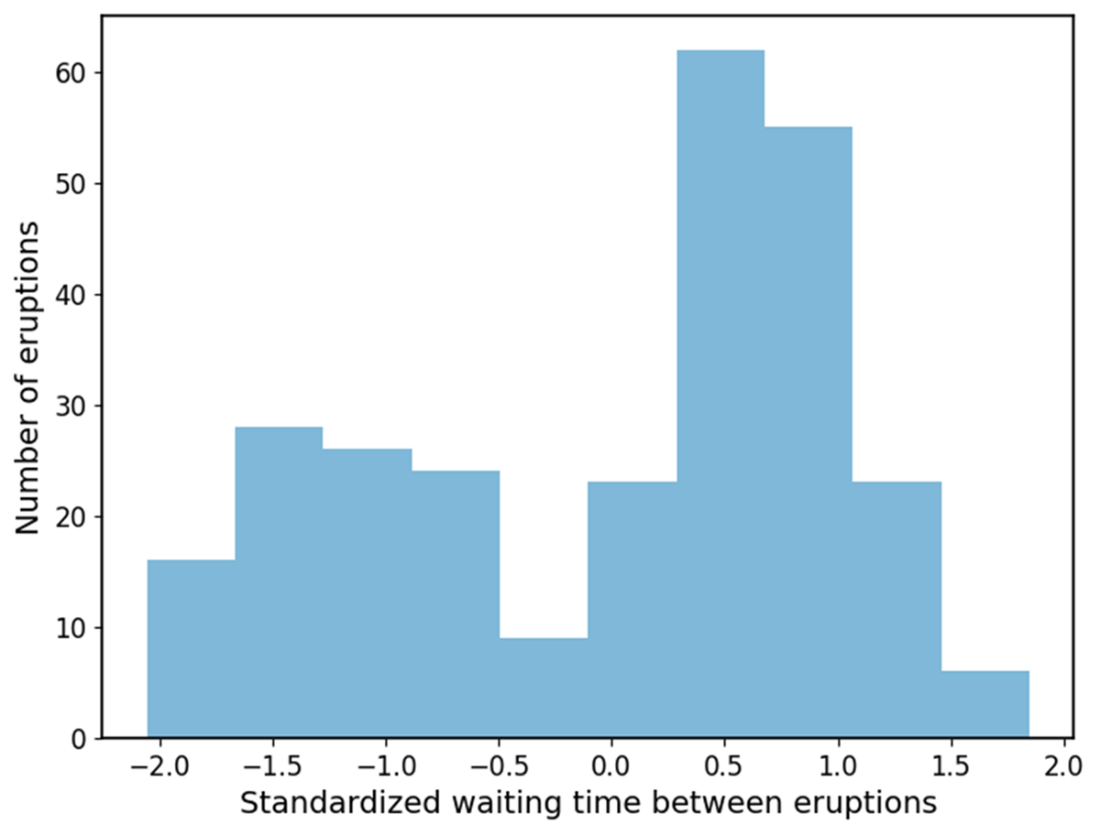
The distribution of standardized waiting times between eruptions from the Old Faithful data.
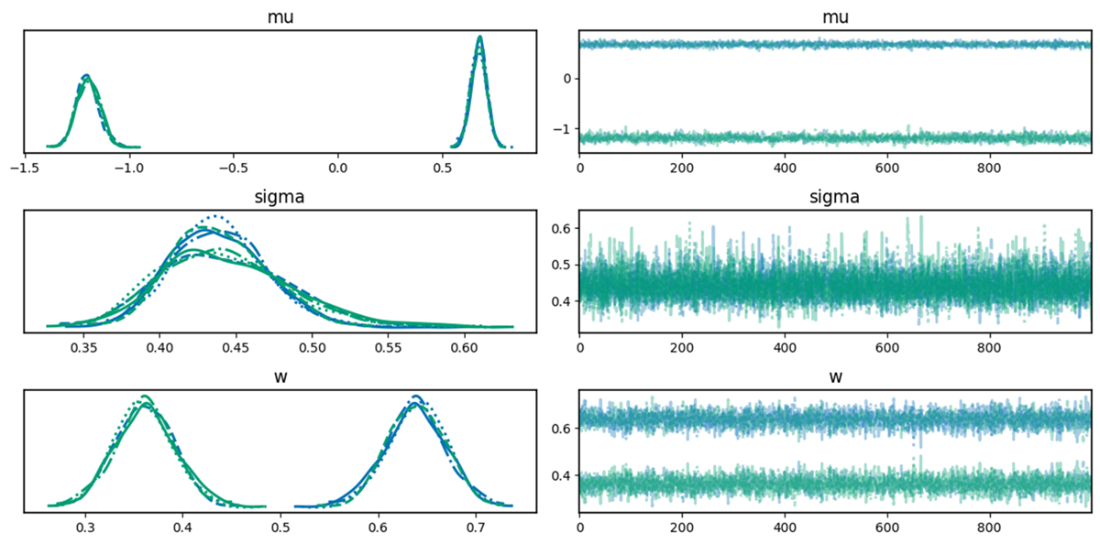
Variables swap between two trends corresponding to the two clusters, illustrating the label switching problem.
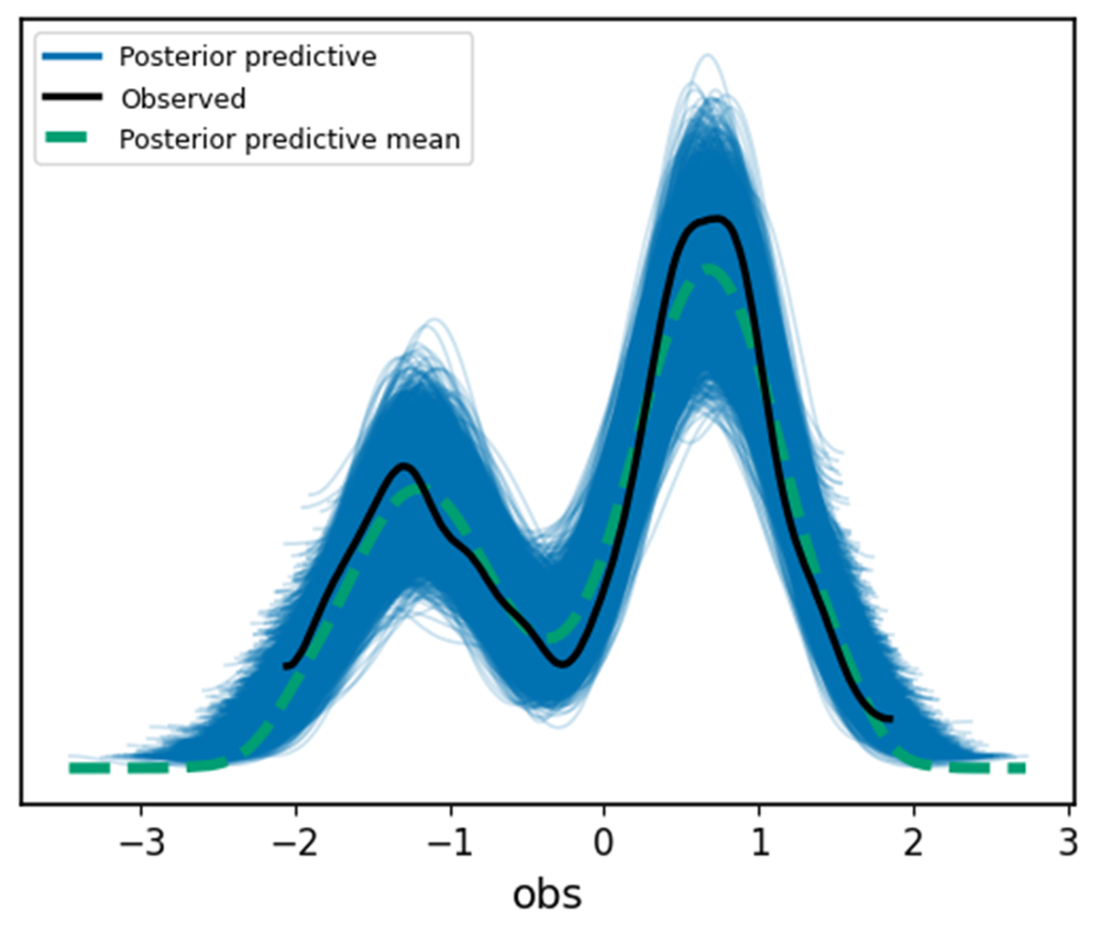
Posterior predictive mean and samples of the mixture model against the observed data. The data lies in the middle of the posterior predictive range, showing that the posterior predictive distribution can model the data well.
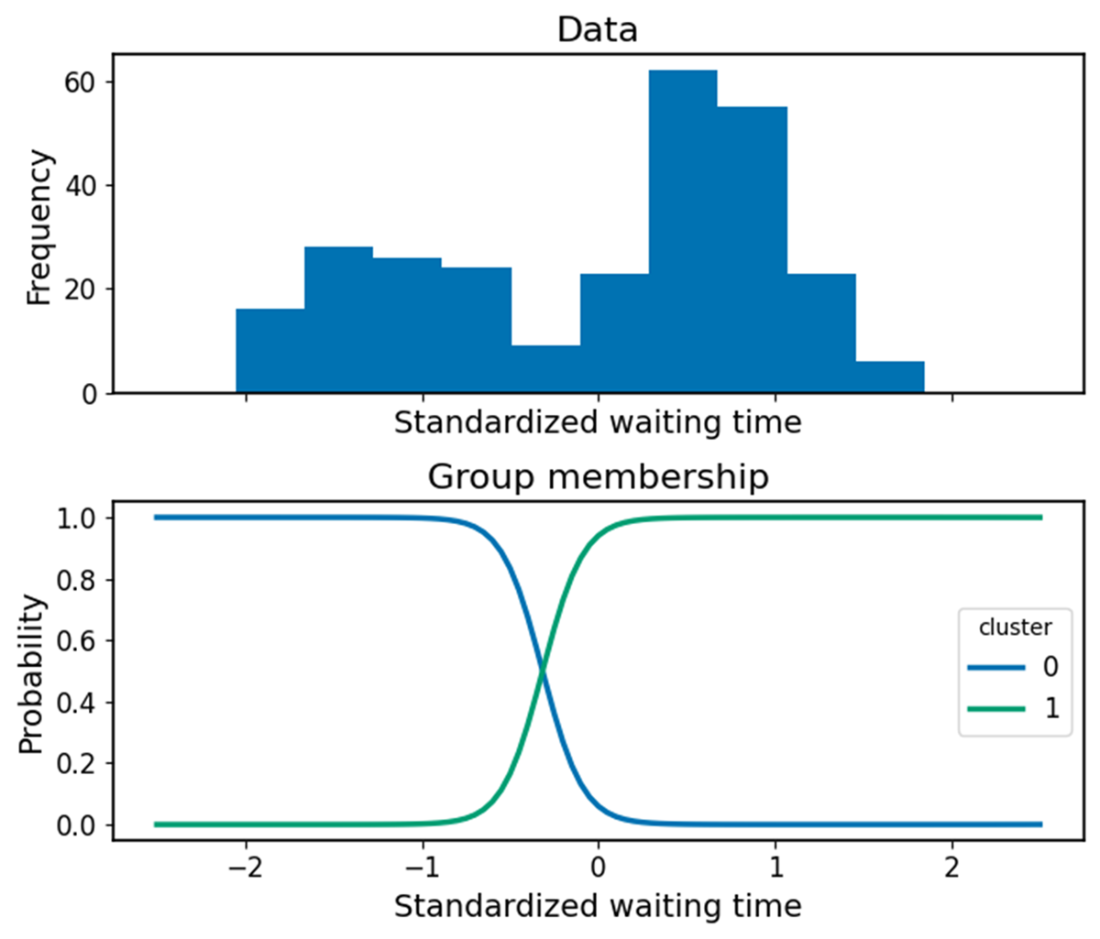
Top: the observed data. Bottom: the probability that a given datapoint belongs to either cluster. The cluster membership probabilities reflect the trend in the observe data.
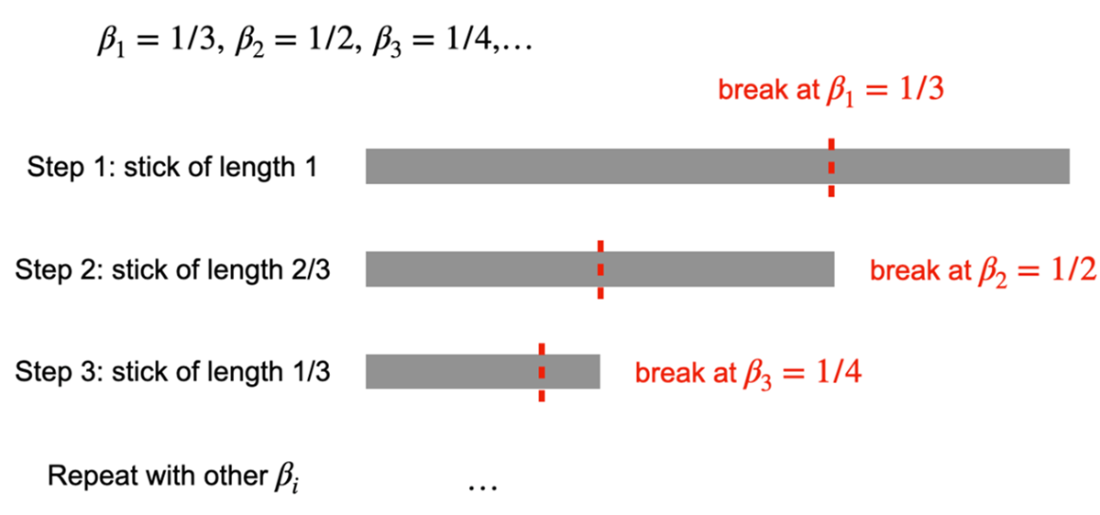
Demonstration of the stick-breaking process for a given list of ratios 𝛽. At each step, we break off the current stick based on the current ratio, and the remaining portion serves as the stick for the next iteration.
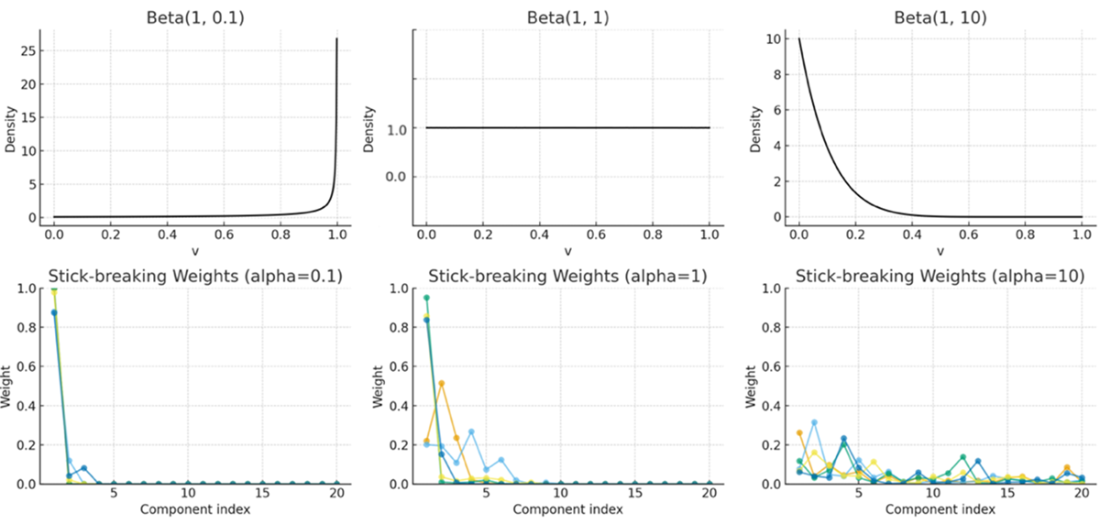
The effect of the concentration parameter 𝛼 of the beta distribution for the ratios 𝛽ᵢ on the stick-breaking weights 𝑤ᵢ
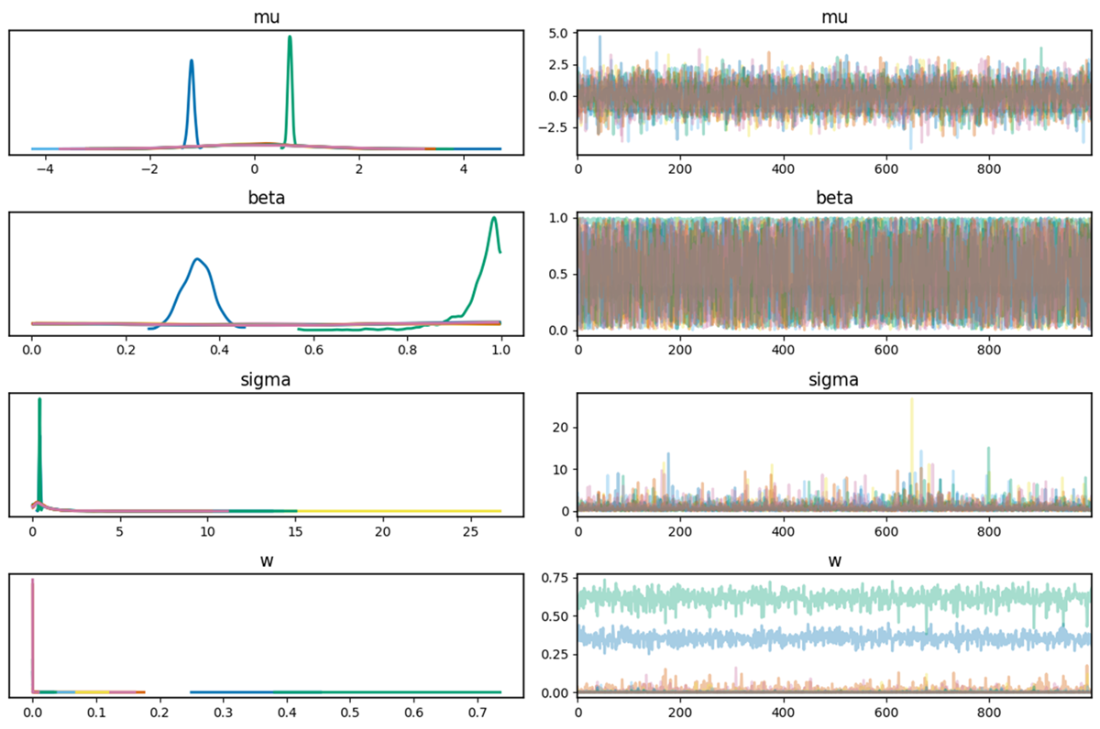
Trace plot from the 10-mixture model showing that the model detects 2 clusters from the data—the other clusters are deemed negligible.
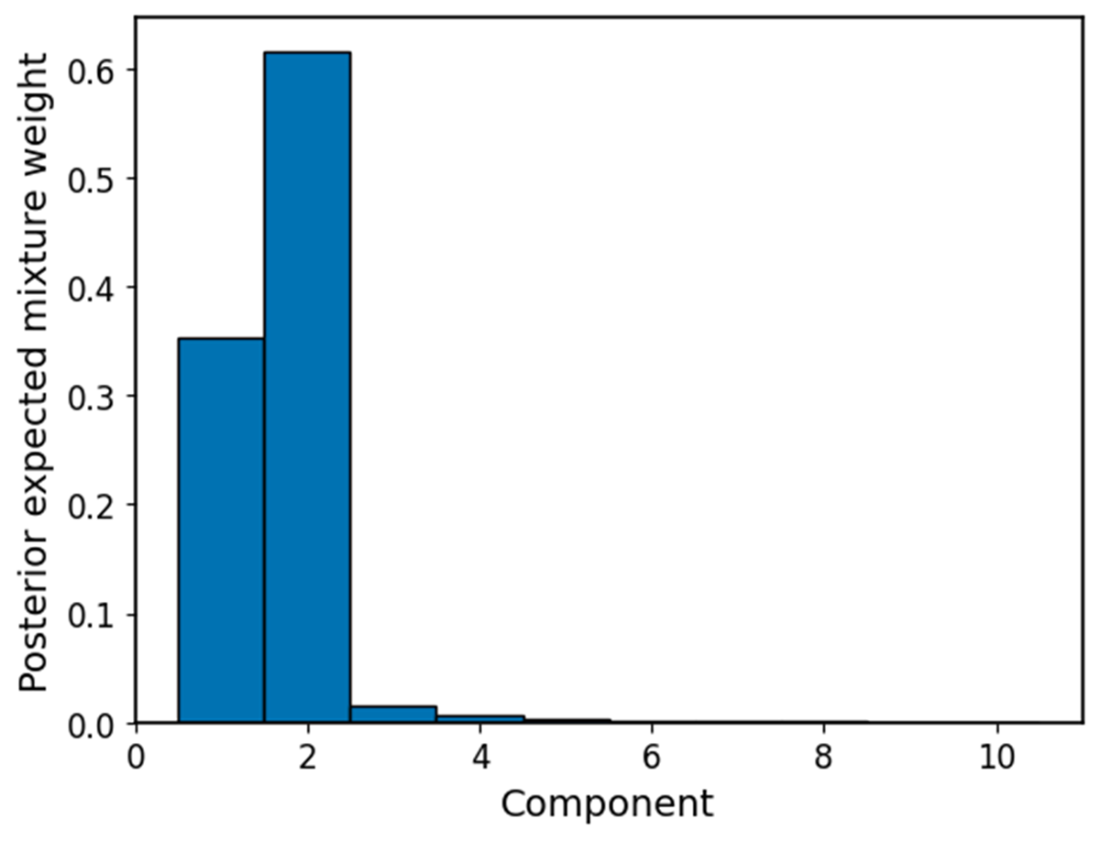
The average weights of individual components in the mixture, averaged across posterior samples. Only the first 2 components have non-negligible weights.
Summary
- Mixture models let us handle data that come from multiple hidden groups, without knowing the group of each observation.
- Bayesian mixture models allow us to reason about our uncertainty in the cluster centers, widths, prevalences, and the membership of each datapoint.
- Gaussian mixtures are especially popular: they can approximate any continuous distribution if we use enough components.
- To avoid guessing the number of clusters, we can use the stick-breaking process, an iterative procedure to construct cluster weights. This process provides a prior that allows infinitely many clusters, but in practice only a few matter.
- The concentration parameter 𝛼 of the stick-breaking process controls cluster richness: small 𝛼 favors fewer, larger clusters; large 𝛼 spreads weight across many small clusters.

 Grokking Bayes ebook for free
