4 Model checking and comparison: Evaluating and picking out the best Bayesian model
Bayesian modeling does not end once the posterior looks reasonable; a model can still be subtly wrong if its prior is unrealistic or its likelihood cannot capture the structure in the data. The chapter frames model assessment as a practical workflow: first check whether a model makes sensible data before seeing any observations, then check whether the fitted model can reproduce the observed data, and finally compare competing models quantitatively. To do this, it emphasizes the foundational skill of sampling from probability distributions, since simulated draws are the engine behind both predictive checks and model comparison.
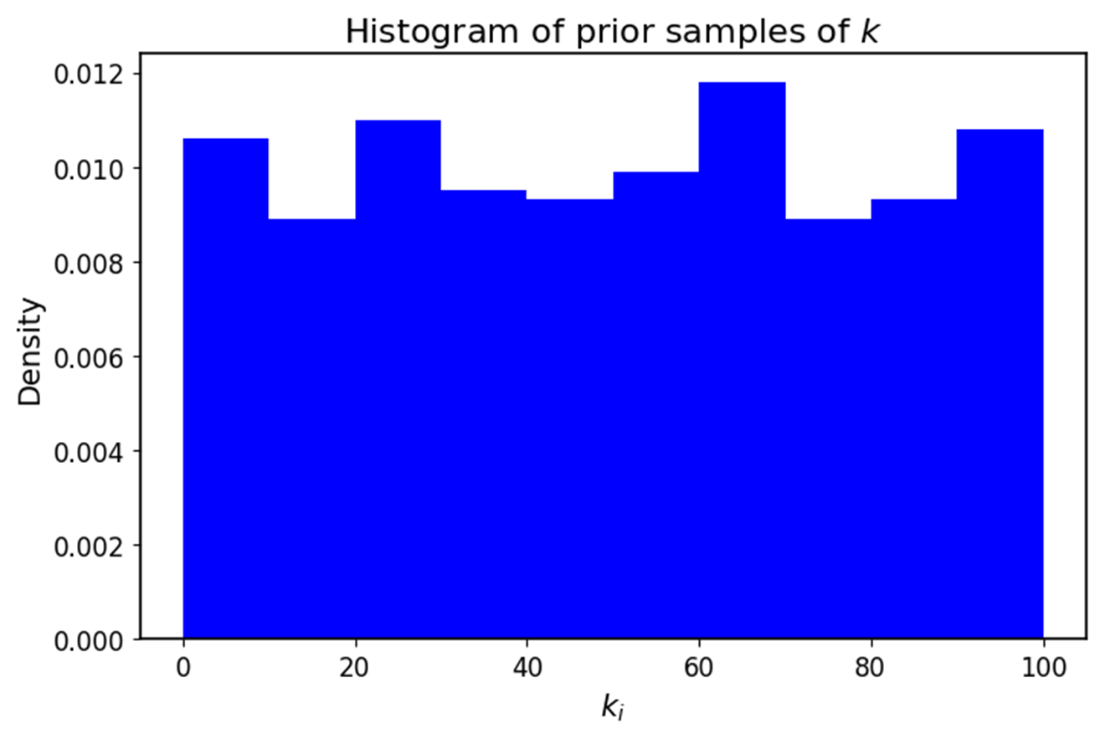
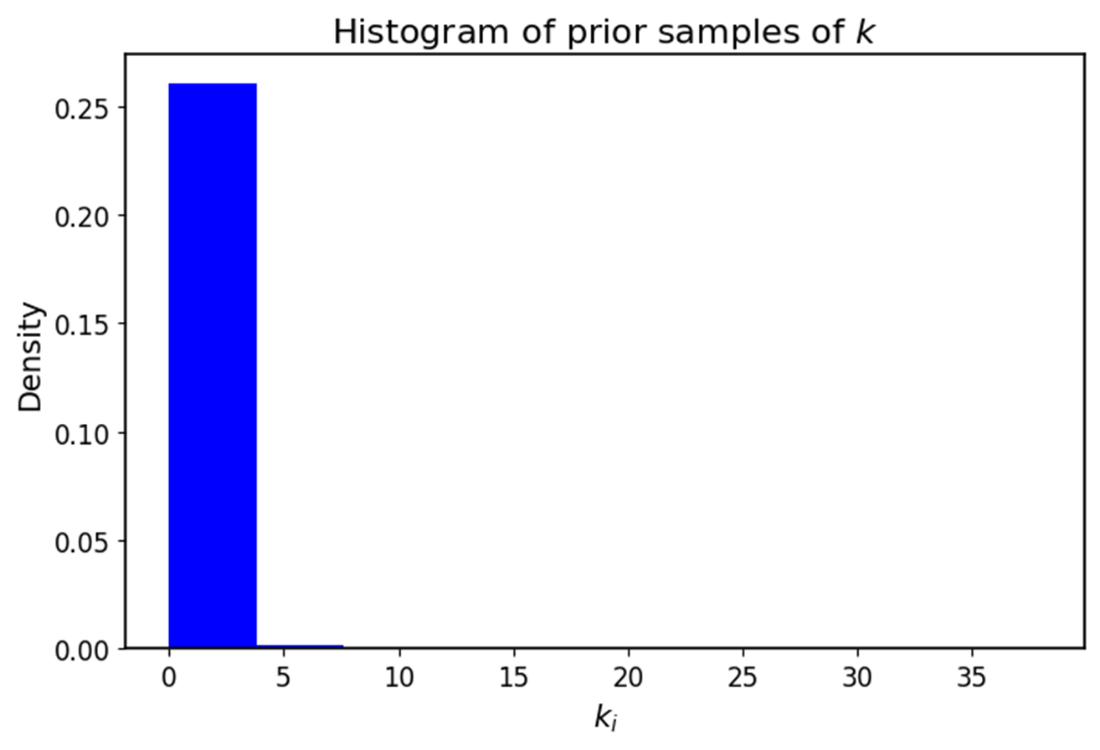
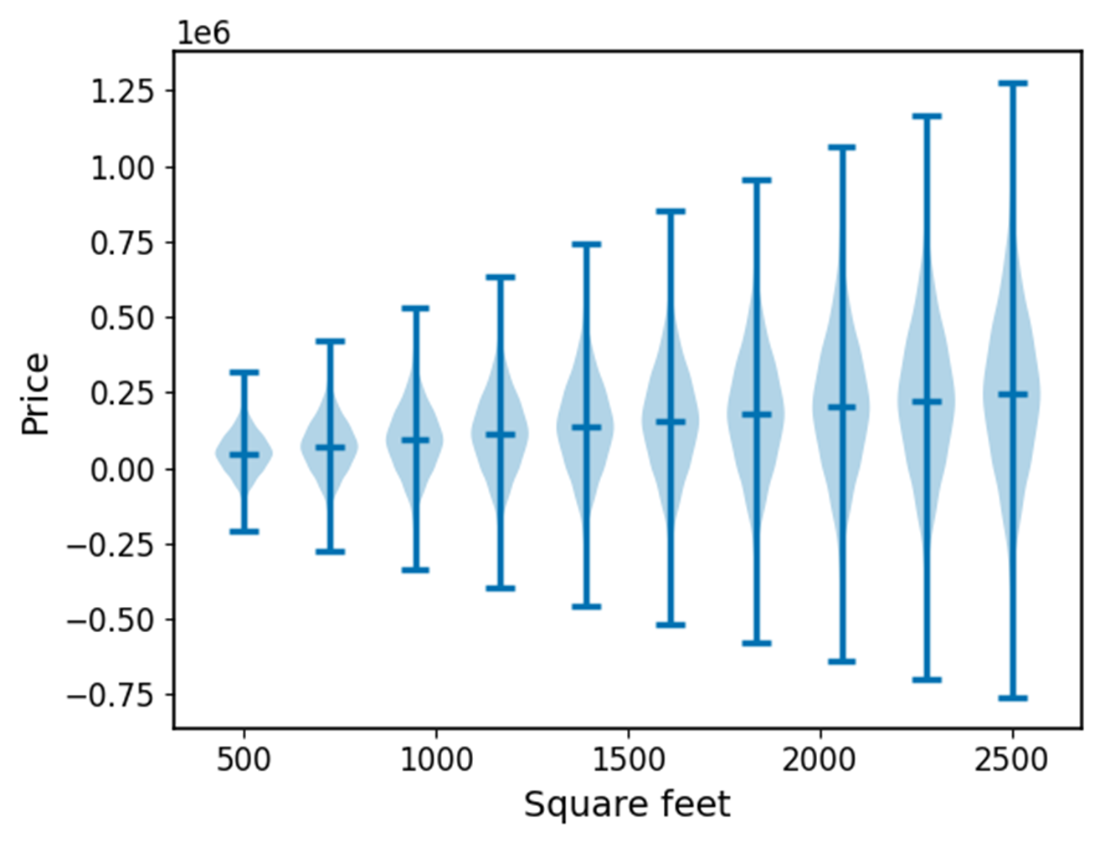
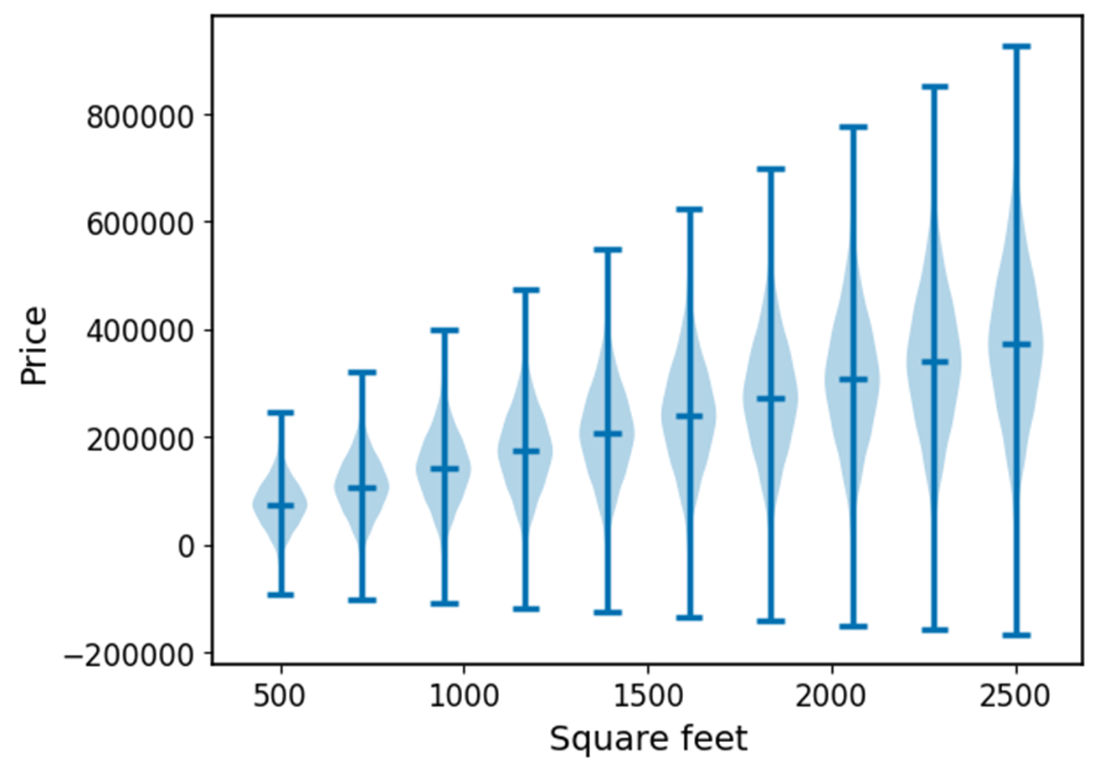
Prior predictive checks are presented as a sanity test for assumptions. The idea is to sample parameters from the prior, generate possible datasets from those samples, and inspect whether the simulated outcomes match domain knowledge. The tea-versus-coffee example shows how a uniform prior can produce plausible counts of tea drinkers, while a skewed prior may fail if it implies too many low counts. The house-price example shows a different failure mode: a normal prior on slope can generate impossible negative prices, motivating a revised prior with a higher mean and lower variance. These checks are about whether the model would generate believable data before any fitting happens.
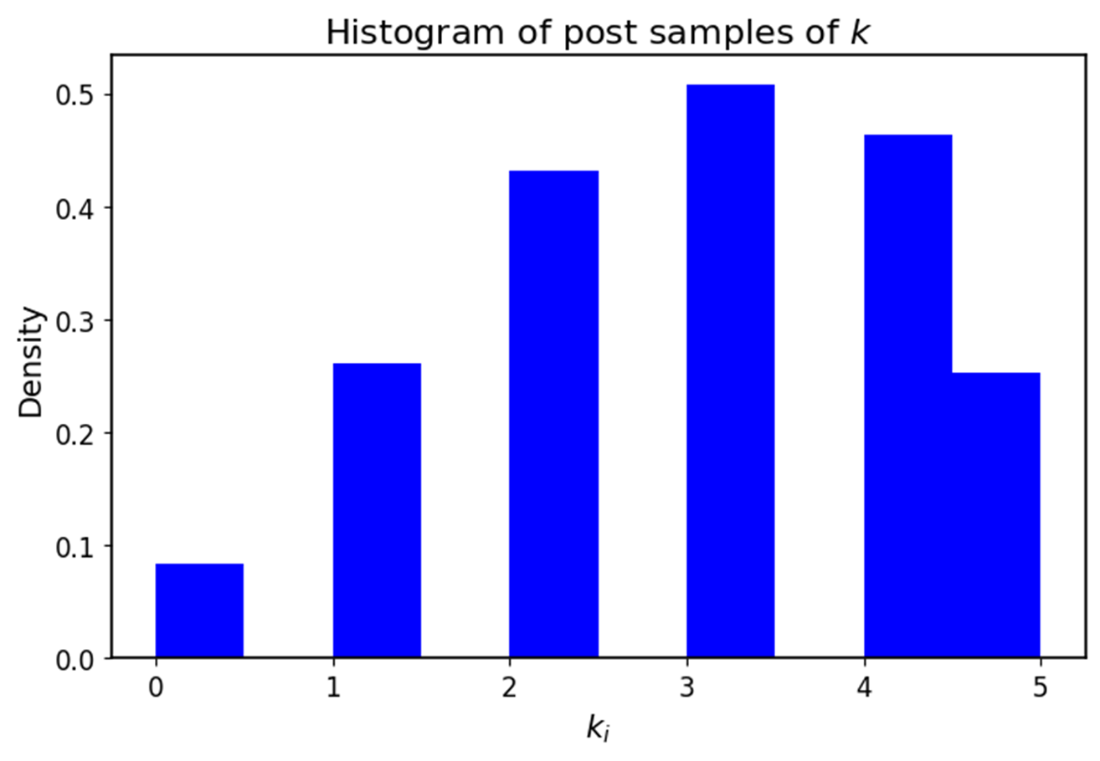
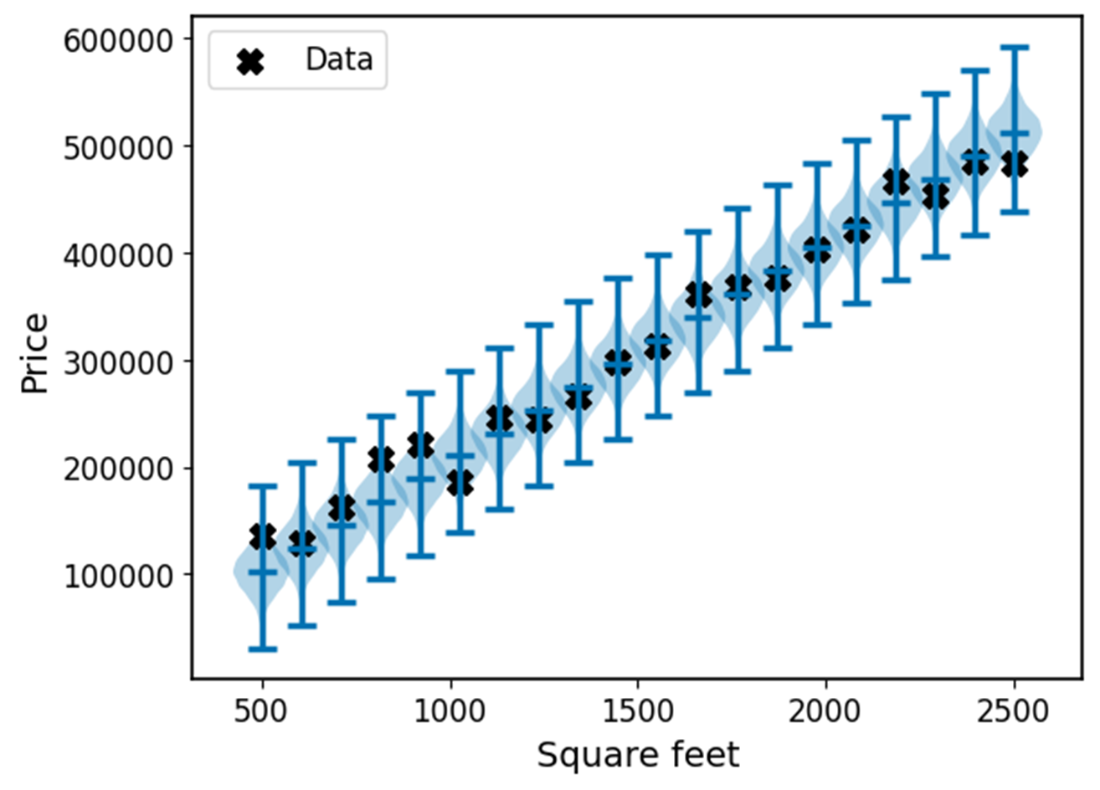
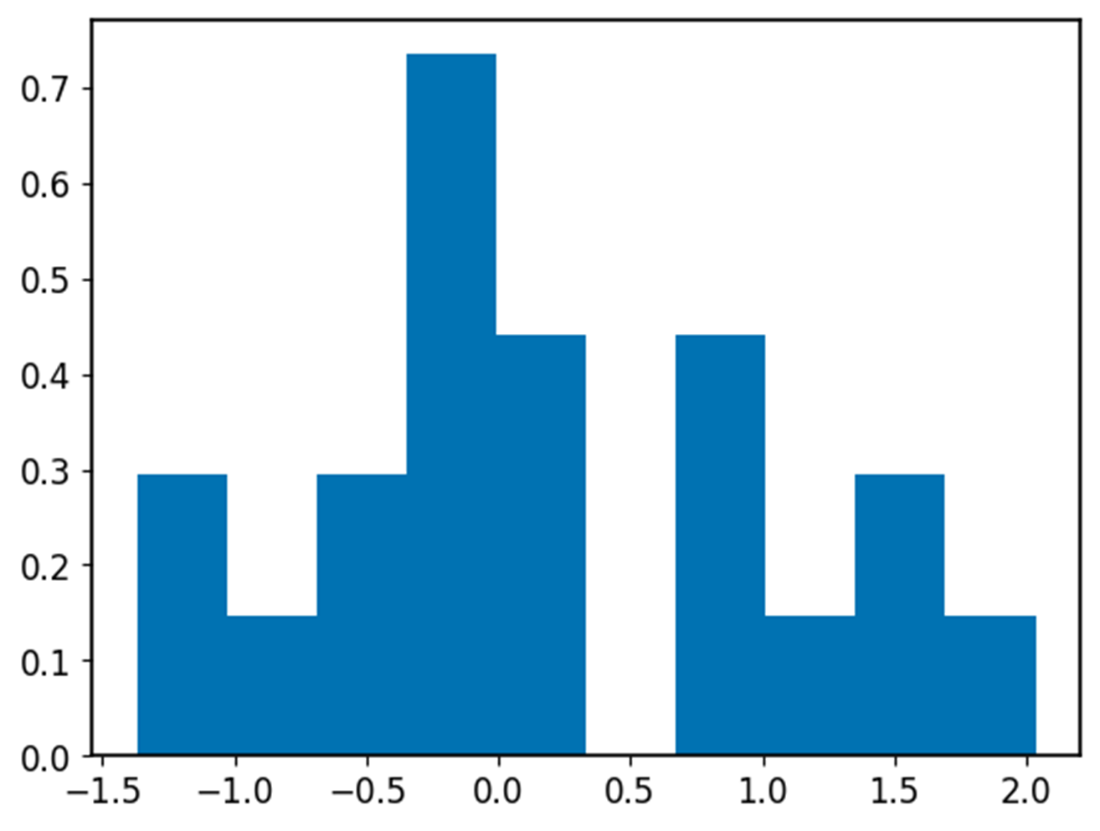
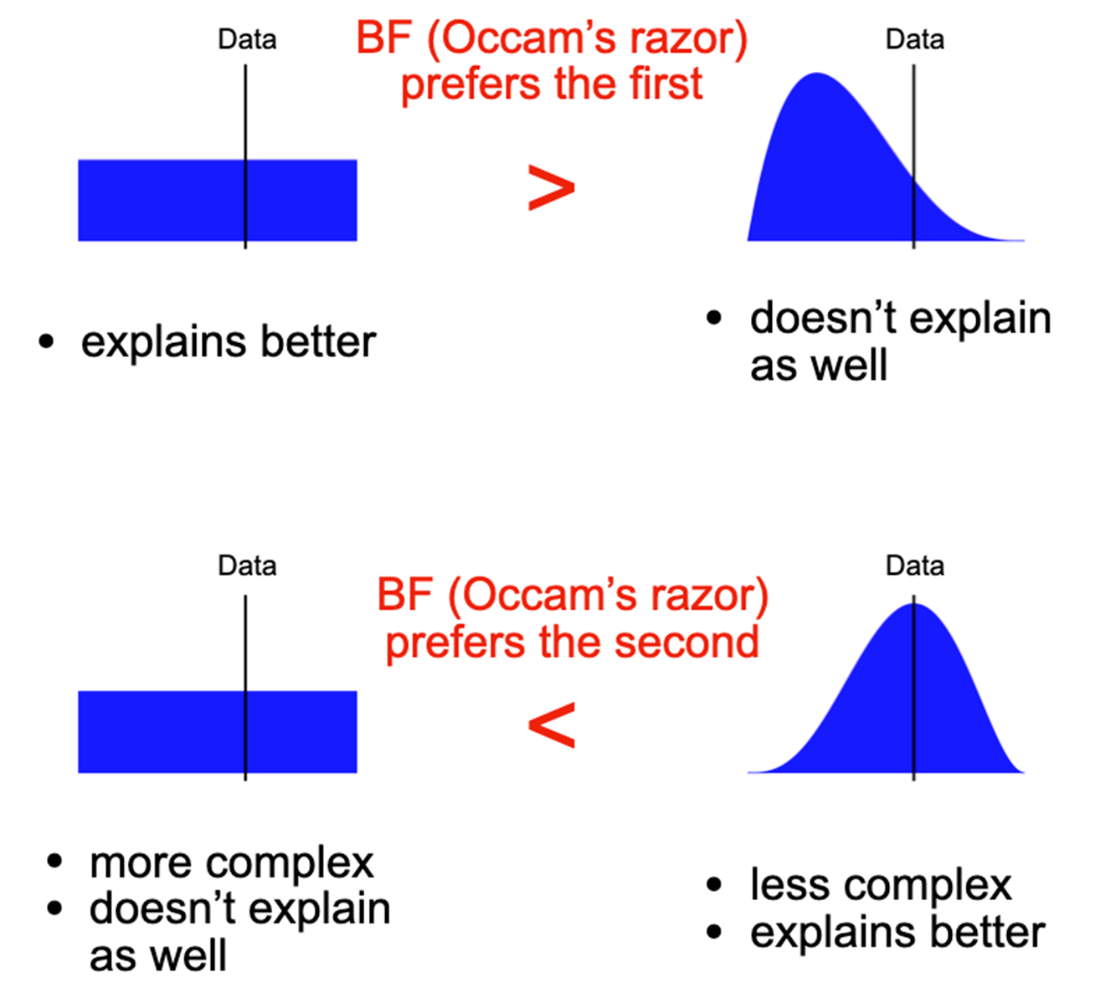
Posterior predictive checks reuse the same simulation logic, but draw from the posterior after conditioning on observed data, so the goal is to see whether the model can reproduce what was actually observed. In the beverage example, a well-behaved prior leads to posterior predictive samples centered near the observed count, while a poorly chosen prior yields biased predictions that miss the data badly. In the house-price example, posterior predictive violin plots, credible intervals, and z-scores are used to confirm that predictions cover the observed prices and have roughly normal residuals. The chapter then moves to model comparison through marginal likelihoods and Bayes factors, showing how to compare models by how well they explain the data while automatically favoring simpler explanations when they fit equally well, in line with Bayesian Occam’s razor.
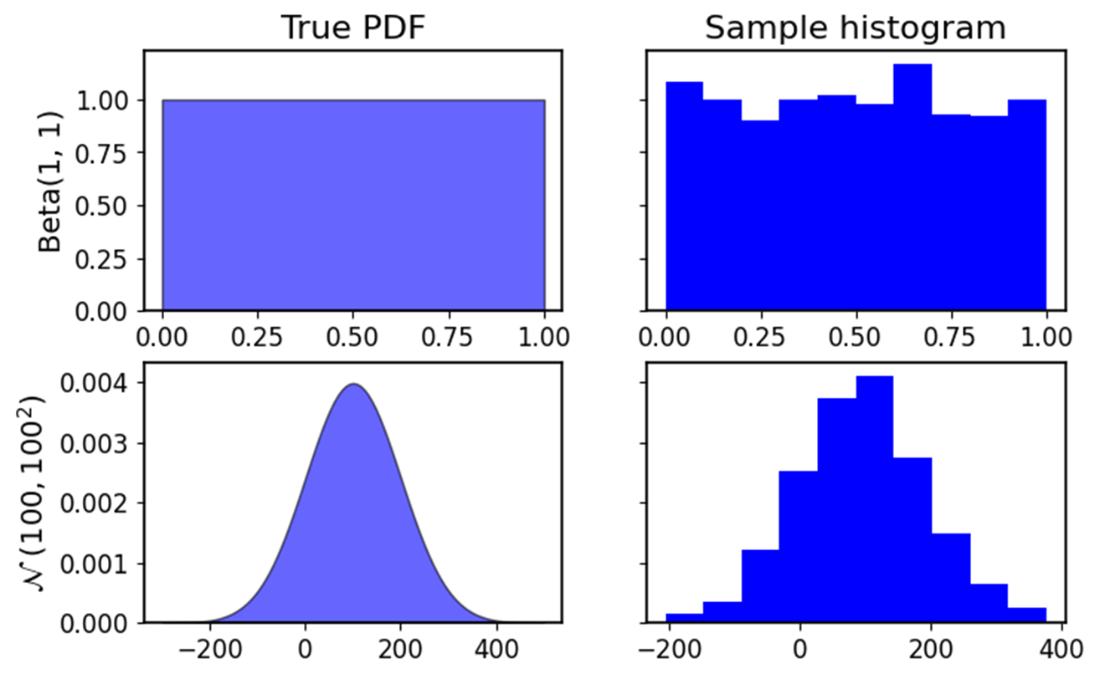
True PDFs of Beta(1, 1) and 𝒩(100,100²) (left column) and the corresponding histograms and 10,000 samples drawn from the two probability distributions (right column). Under infinite samples, the shapes of the histograms approach the respective PDFs.
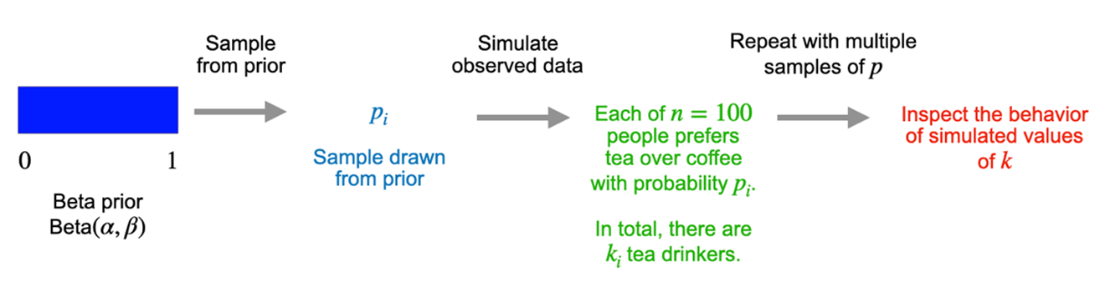
The procedure of a prior predictive check for the tea preference model. Each sample of the proportion 𝑝 from the prior yields a possible dataset in the form of the number of tea drinkers 𝑘 out of 𝑛 = 100 people surveyed. A prior predictive check is passed if the simulated behavior matches our intuition.
The distribution of samples of 𝑘, the number of people preferring tea over coffee, based on the uniform prior of 𝑝 when we set 𝑛 = 100.
The distribution of samples of 𝑘, the number of people preferring tea over coffee, based on a skewed prior of 𝑝 when we set 𝑛 = 100.


The distributions of the samples of the price of a house whose square footage is denoted by the 𝑥-axis.
The distributions of the samples of the price of a house whose square footage is denoted by the 𝑥-axis, induced by an adjusted prior for the slope 𝑚.

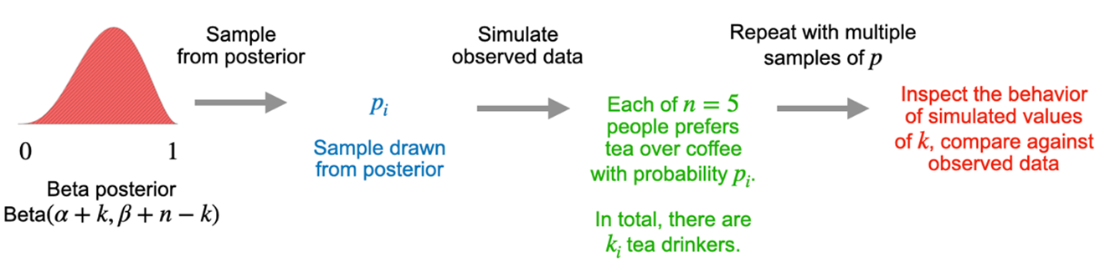
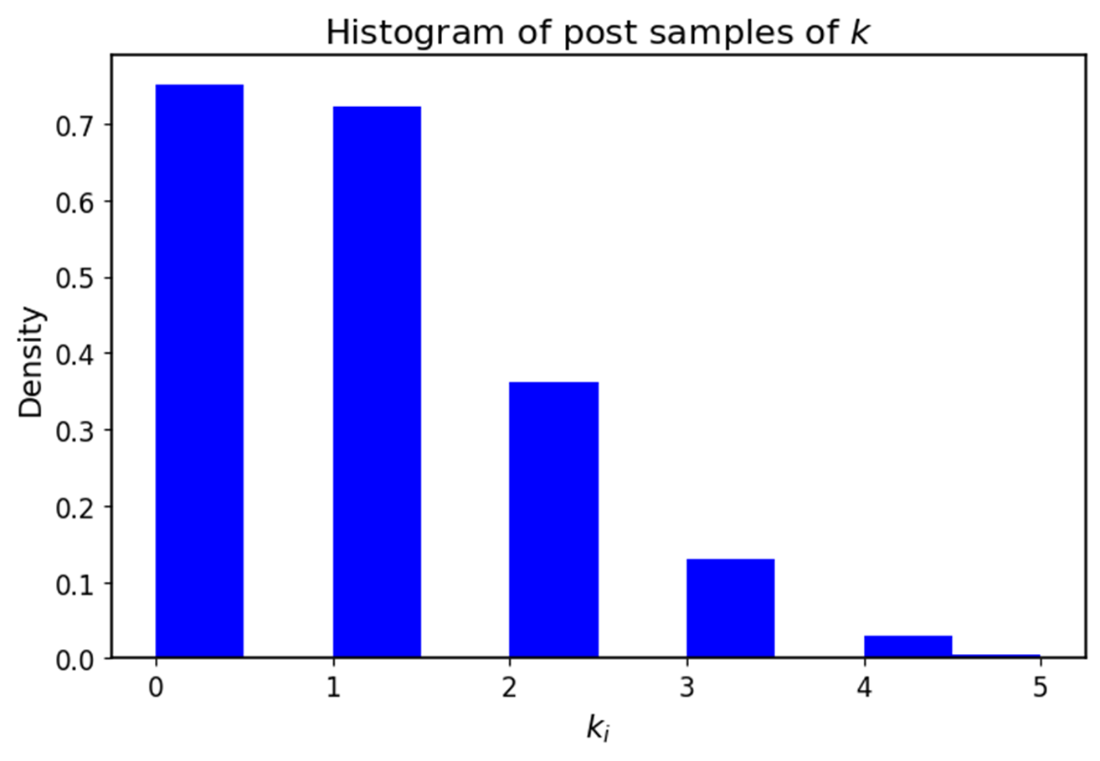
The distribution of posterior samples of 𝑘, the number of people preferring tea over coffee, based on the posterior of 𝑝 when we set 𝑛 = 5.
The distribution of posterior samples of 𝑘, the number of people preferring tea over coffee, based on the posterior of 𝑝 that started from a skewed prior when we set 𝑛 = 5.

The distributions of the posterior samples of the price of a house whose square footage is denoted by the 𝑥-axis against the observed data.
The histogram of the 𝑧-scores under the Bayesian linear regression model.
Summary
- Sampling from a probability distribution allows us to simulate plausible outcomes from our beliefs and is essential for model checking in Bayesian analysis.
- Prior predictive checks simulate datasets from the prior to ensure that our model encodes reasonable assumptions before seeing the data.
- Posterior predictive checks simulate datasets from the posterior to see whether the model can replicate the observed data.
- Posterior predictive checks are necessary, but not sufficient, for validating a model—they ensure the model hasn’t failed, but don’t prove it’s correct.
- Bayesian models can produce unrealistic predictions if their priors or likelihoods are poorly chosen.
- Bayes factors provide a principled way to compare models by computing how well each explains the observed data.
- The Bayesian Occam’s razor effect favors simpler models that explain the data well, penalizing overly complex ones that do not improve fit.
- Bayes factors can be interpreted numerically, with values over 3.2 suggesting substantial evidence and values over 10 indicating strong evidence.
- Bayesian model comparison enables us to evaluate tradeoffs between generality (complexity) and specificity (fit to data).

 Grokking Bayes ebook for free
