Overview

9 Unveiling hidden connections: graph-based analytics for advanced fraud detection

Fraud detection becomes much more effective when the focus shifts from isolated transactions to the relationships that bind people, accounts, devices, and payment instruments together. The chapter explains that conventional supervised and anomaly-based models can miss coordinated fraud because each event may look harmless on its own. Graph analytics address this blind spot by representing financial activity as a network, making hidden structures such as mule-account chains, synthetic identity webs, and fraud rings visible to both analysts and algorithms.

The chapter then builds the practical foundation for graph-based fraud analysis by showing how financial data can be modeled as nodes, edges, and properties, and by distinguishing useful graph types such as directed, weighted, sparse, heterogeneous, and multigraph structures. It outlines a workflow for transforming raw data into graph form: identify relevant sources, understand the available fields and quality issues, design the schema, define extraction and loading steps, and perform validation and enrichment after import. Using NetworkX, the chapter demonstrates how to construct a transaction graph from tabular e-commerce data, add entity nodes, create edges based on co-occurrence in transactions, and apply community detection to identify densely connected clusters that may signal suspicious coordination.

Finally, the chapter moves beyond descriptive graph analysis to Graph Neural Networks, which learn directly from connectivity patterns as well as node features. A simplified PyTorch example shows how a GNN can aggregate neighborhood information and use it to rank suspicious transactions, illustrating the advantage of relational learning over transaction-by-transaction scoring. The chapter closes by emphasizing that production fraud systems will likely combine graph analytics, GNNs, and other AI methods such as LLMs, privacy-preserving learning, and reinforcement learning, creating a layered defense that is better suited to the evolving tactics of modern financial crime.

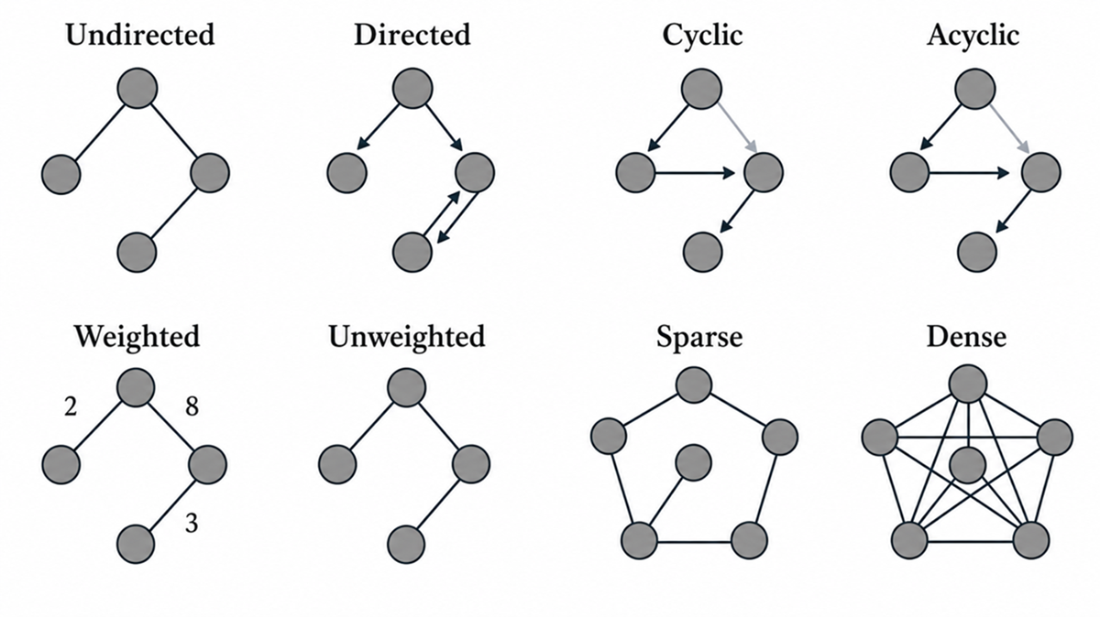
Types of graph structures commonly used in fraud detection. This figure illustrates key graph types used in financial transaction analysis.
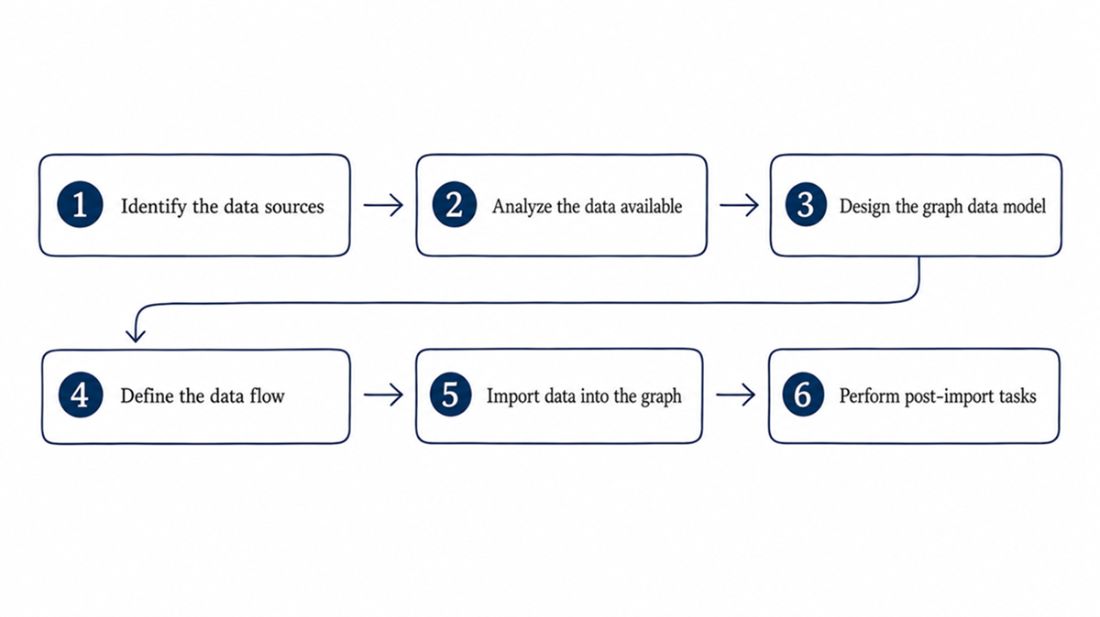
A Structured Workflow for Preparing Graph Data for Fraud Analytics. Creating graph data from raw financial sources involves a sequence of deliberate steps, beginning with identifying and analyzing the relevant data, designing the graph schema, and defining the data flow. Once the data is imported into the graph environment, post-processing tasks ensure the data is accurate and ready for downstream analysis. This structured pipeline provides a foundation for graph-based fraud detection techniques.
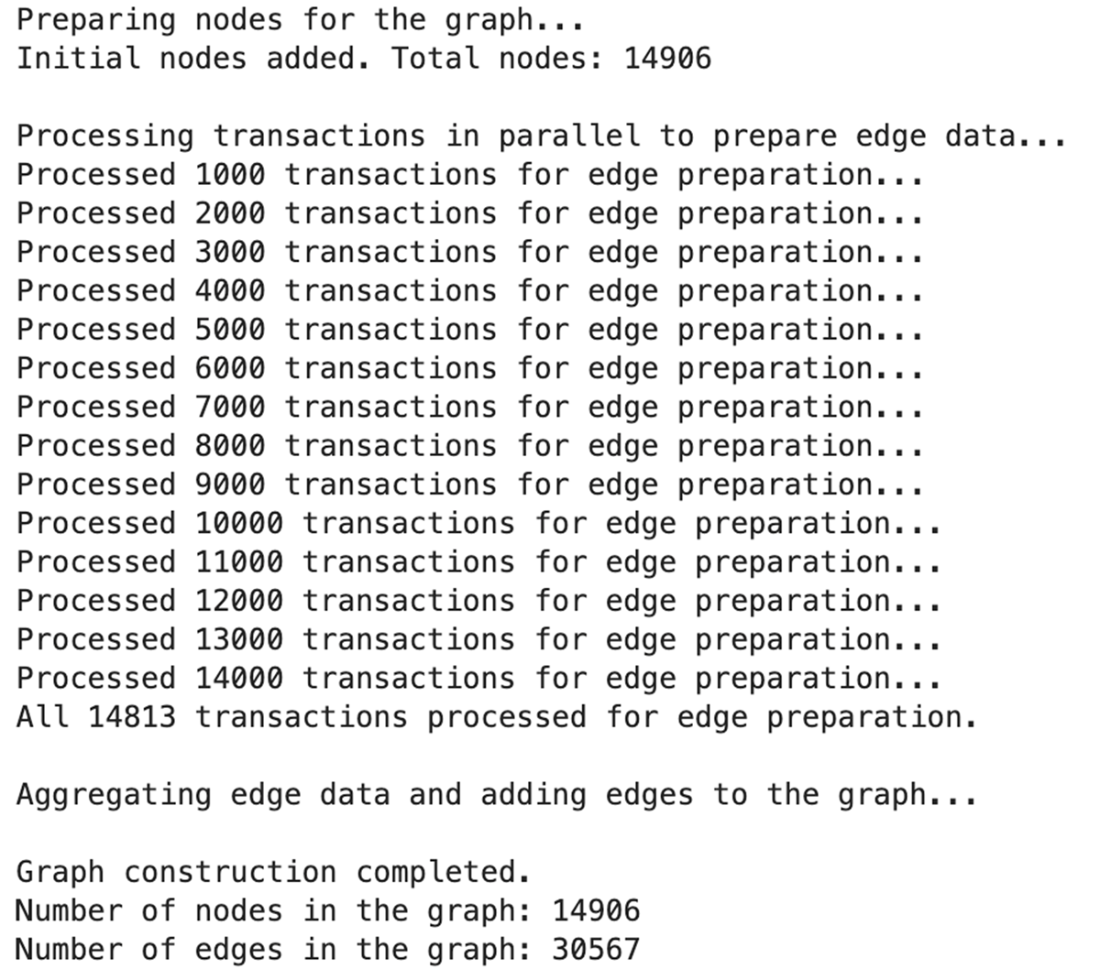
Example console output after running the graph construction script. The log shows the number of initial nodes, the progress of edge preparation, and the final statistics of the constructed graph.
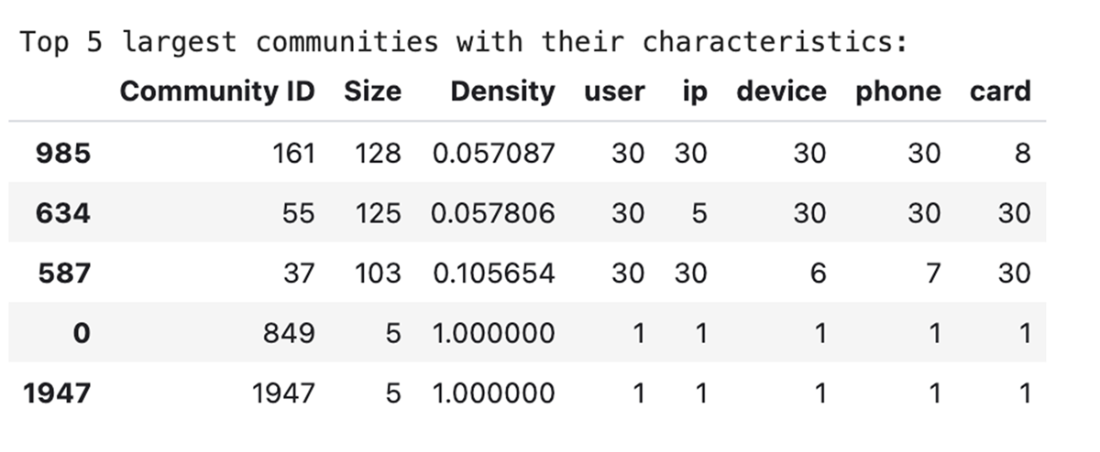
A summary table of the top five largest communities detected by the Louvain algorithm, showing their size, density, and the count of different entity types within each.
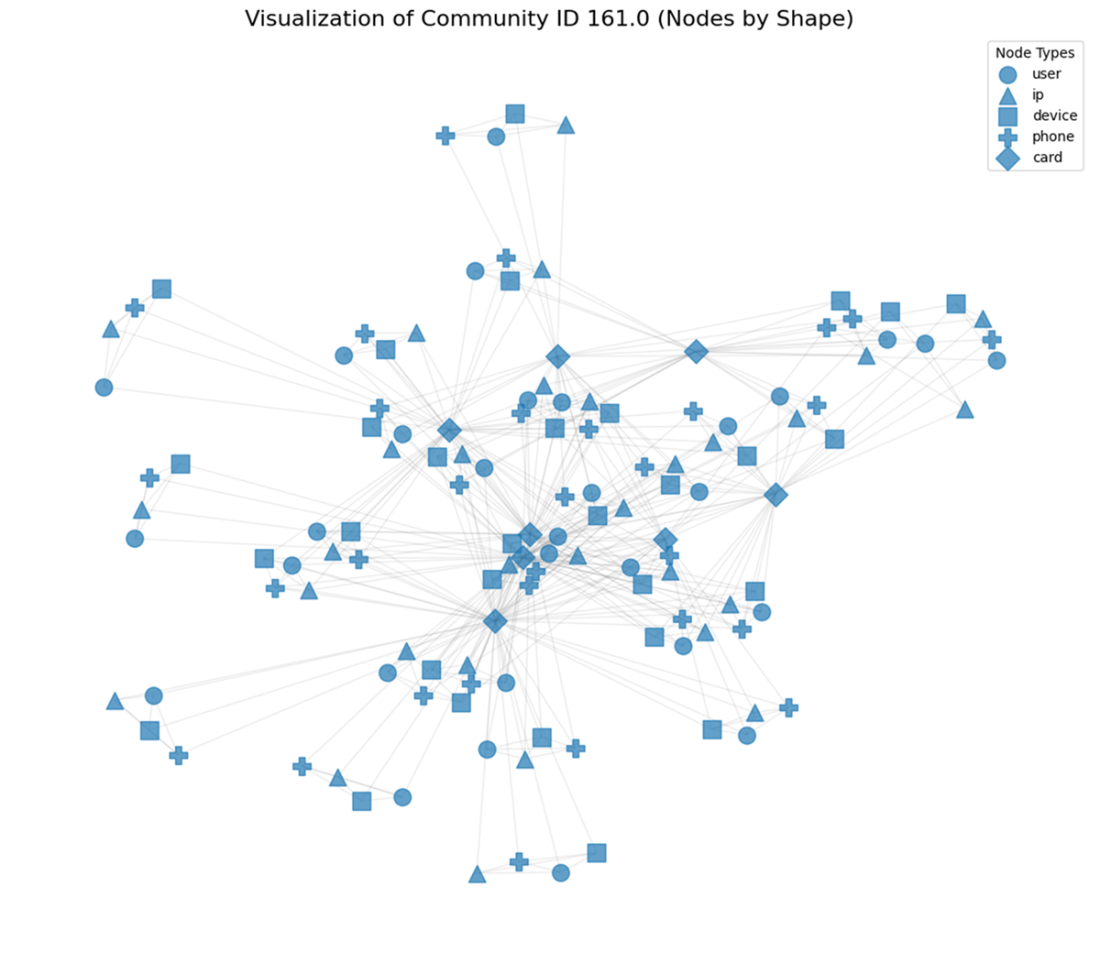
A visualization of the largest detected community (ID 161). Each node type is represented by a unique shape and color, revealing the relationships and potential bottlenecks within this suspicious cluster.
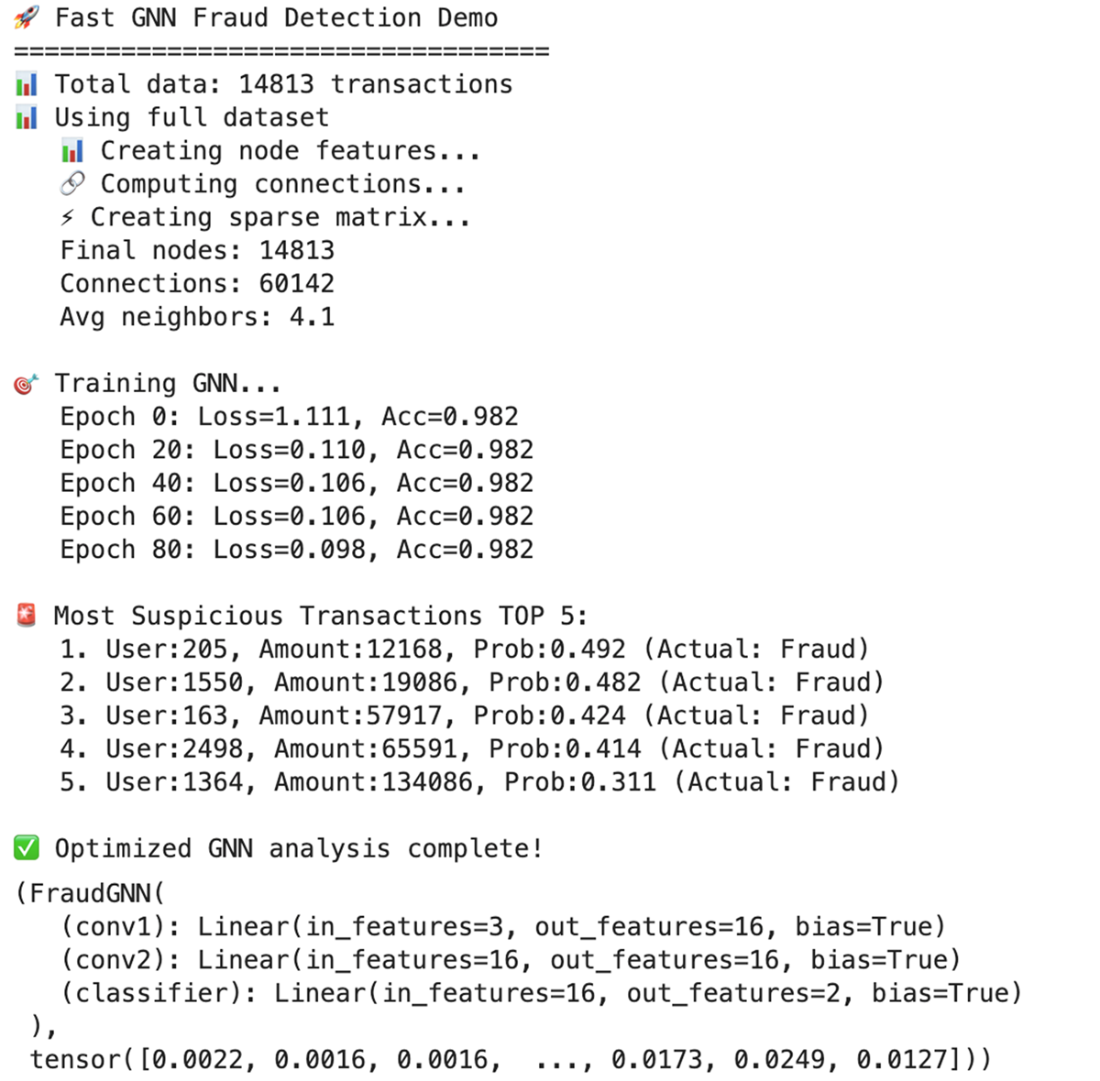
Console output from executing the full GNN demo. The log shows the entire process from data preparation and model training to the final identification of the top 5 most suspicious transactions.
Summary

  • Graph analytics reveal complex fraud schemes by analyzing the relationships and connections between entities, which often remain hidden in transaction-level analysis.
  • Model financial data as a graph by representing entities (e.g., users, accounts, devices) as nodes and their interactions or shared attributes (e.g., transactions, common IPs) as edges.
  • The choice of graph representation-directed, undirected, weighted, or heterogeneous-should be based on the specific fraud patterns you aim to detect.
  • Construct a graph from tabular data by defining unique entities as nodes and creating edges between them based on co-occurrence within transactions.
  • Use community detection algorithms, such as the Louvain method, to partition a graph into densely connected clusters, which can represent coordinated fraud rings.
  • Visualize suspicious communities to intuitively identify structural patterns, such as bottlenecks (e.g., many users sharing one IP), which are strong indicators of organized fraud.
  • Graph Neural Networks (GNNs) automatically learn feature representations from both node attributes and the graph's structure, enabling them to capture complex relational patterns that traditional models miss.
  • Effective GNN implementation in fraud detection requires addressing key challenges, including scalable training on large graphs (e.g., via neighbor sampling), handling data imbalance, and ensuring model explainability.
  • A multi-layered defense combining supervised, unsupervised, and graph-based methods provides the most robust protection against a wide range of evolving fraud tactics.

FAQ

Why are graph analytics essential for fraud detection in BFSI?Graph analytics are essential because traditional models often analyze transactions in isolation and miss coordinated fraud. By modeling entities like users, accounts, devices, IPs, and transactions as connected nodes and edges, graph analytics can reveal hidden relationships, shared identifiers, bottlenecks, and fraud rings that individual scoring models may overlook.
What are the main components of a financial fraud graph?A financial fraud graph is typically built from nodes, edges, and properties. Nodes represent entities such as customers, accounts, devices, IP addresses, merchants, and transactions. Edges represent relationships such as ownership, transfers, shared devices, or shared IPs. Properties store extra information like transaction amount, timestamp, risk score, or edge frequency.
What types of graph structures are commonly used in fraud detection?Common graph structures include directed and undirected graphs, weighted and unweighted graphs, cyclic and acyclic graphs, sparse and dense graphs, homogeneous and heterogeneous graphs, and simple graphs versus multigraphs. The choice depends on the fraud problem, the nature of relationships, and the level of detail needed for analysis.
How do you turn tabular transaction data into a graph for fraud analytics?The process usually starts by identifying relevant data sources, analyzing the schema and data quality, designing a graph schema, defining the ETL flow, and then loading the data into a graph environment. After import, validation, enrichment, and indexing are often performed before analysis begins.
Why does the chapter use NetworkX for the transaction graph example?NetworkX is used because it is flexible, easy to integrate with Python data workflows, and well suited for exploratory analysis and prototyping. It allows the graph to be built directly from transaction data, making it possible to quickly test graph-based fraud concepts without needing a full graph database.
How was the transaction graph constructed in the hands-on example?The example created nodes for entities such as users, IPs, devices, phones, and credit cards. Then it added edges between entities that appeared in the same transaction. Edge weights tracked how often pairs of entities co-occurred, and transaction IDs were stored as edge attributes to preserve traceability.
What is Louvain community detection and why is it useful for fraud?Louvain is a community detection algorithm that groups nodes into densely connected clusters. In fraud detection, these clusters can expose coordinated groups of accounts, shared resources, mule networks, or laundering cells. Suspicious communities often show bottlenecks, such as many entities funneled through a small number of IPs or devices.
How should analysts interpret suspicious communities found in a transaction graph?Analysts should look at community size, density, and the mix of node types. Large communities with many users, devices, or cards connected through only a few shared IPs or devices can indicate coordinated fraud. Very small, fully connected communities may simply represent isolated transactions and are not always suspicious by themselves.
What advantages do Graph Neural Networks offer over traditional fraud models?GNNs learn directly from graph structure as well as node and edge features. This lets them capture relational patterns, multi-hop dependencies, temporal changes, and heterogeneous data more effectively than models that only inspect transactions individually. They are especially powerful for node classification, link prediction, and graph classification tasks in fraud detection.
What are the key challenges when building production-grade GNNs for fraud detection?Key challenges include choosing the right architecture, engineering useful node and edge features, handling severe class imbalance, scaling to very large graphs, and making predictions explainable to analysts and regulators. In real systems, teams often use specialized libraries, sampling methods, and XAI techniques to address these issues.

pro $24.99 per month

  • access to all Manning books, MEAPs, liveVideos, liveProjects, and audiobooks!
  • choose one free eBook per month to keep
  • exclusive 50% discount on all purchases
  • renews monthly, pause or cancel renewal anytime

lite $19.99 per month

  • access to all Manning books, including MEAPs!

team

5, 10 or 20 seats+ for your team - learn more


choose your plan

team

monthly
annual
$49.99
$499.99
only $41.67 per month
  • five seats for your team
  • access to all Manning books, MEAPs, liveVideos, liveProjects, and audiobooks!
  • choose another free product every time you renew
  • choose twelve free products per year
  • exclusive 50% discount on all purchases
  • renews monthly, pause or cancel renewal anytime
  • renews annually, pause or cancel renewal anytime
  • Financial AI in Practice ebook for free

choose your plan

team

monthly
annual
$49.99
$499.99
only $41.67 per month
  • five seats for your team
  • access to all Manning books, MEAPs, liveVideos, liveProjects, and audiobooks!
  • choose another free product every time you renew
  • choose twelve free products per year
  • exclusive 50% discount on all purchases
  • renews monthly, pause or cancel renewal anytime
  • renews annually, pause or cancel renewal anytime
  • Financial AI in Practice ebook for free