8 Building AI fraud detectors: from supervised scoring to anomaly identification
The chapter moves from fraud detection theory into practical model-building, focusing on single-transaction fraud screening. It frames fraud detection as two complementary tasks: supervised learning for recognizing known fraud patterns from labeled history, and unsupervised anomaly detection for spotting new, unseen threats. Throughout, it emphasizes that success depends on handling the realities of fraud data, especially extreme class imbalance, privacy constraints, drift, and the need to keep modeling tied to business and operational goals.
For supervised fraud classification, the chapter walks through data preparation, feature scaling, and stratified splitting using a public credit card fraud dataset. It explains why labels are scarce and why accuracy is misleading in highly imbalanced settings, then stresses more useful measures such as precision, recall, F1, and AUC-PR. A LightGBM pipeline is built with SMOTE inside cross-validation and tuned with randomized search to maximize fraud recall without leaking information. The results are then evaluated on untouched test data, including confusion matrices, classification reports, and top-N% analyses that show the real trade-off between catching more fraud and overwhelming analysts with false positives.
The chapter then turns to unsupervised anomaly detection with autoencoders. By training only on legitimate transactions, the model learns a compressed representation of normal behavior and uses reconstruction error as an anomaly score. Fraudulent transactions tend to produce much higher reconstruction errors, which can be used for ranking and thresholding suspicious activity. The discussion closes by stressing that threshold selection is a business decision, not a purely statistical one, and by outlining the production realities of real-time fraud scoring: low latency, fallback logic, shadow mode testing, continuous monitoring, and robust deployment practices so the system remains reliable as fraud tactics evolve.
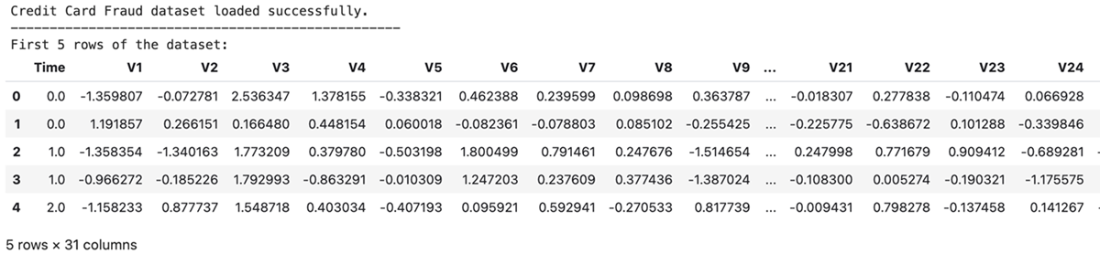
A sample of the first five rows of the dataset. This output confirms that the features have loaded correctly and gives a sense of the data structure.
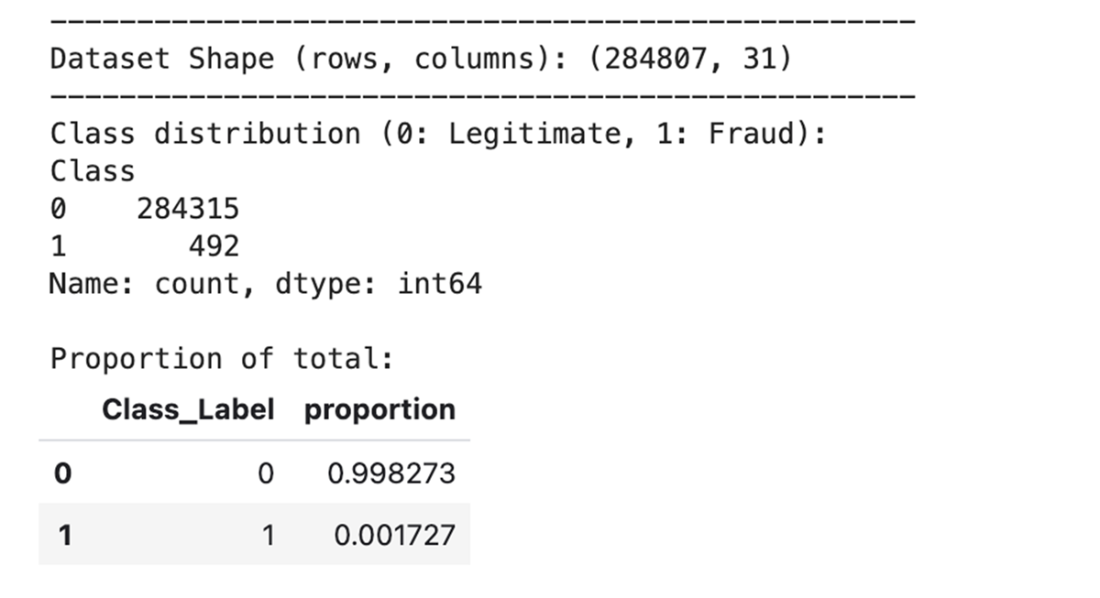
Summary statistics showing the dataset's dimensions and class distribution. The output shows only 492 fraudulent transactions out of over 284,000 total records.
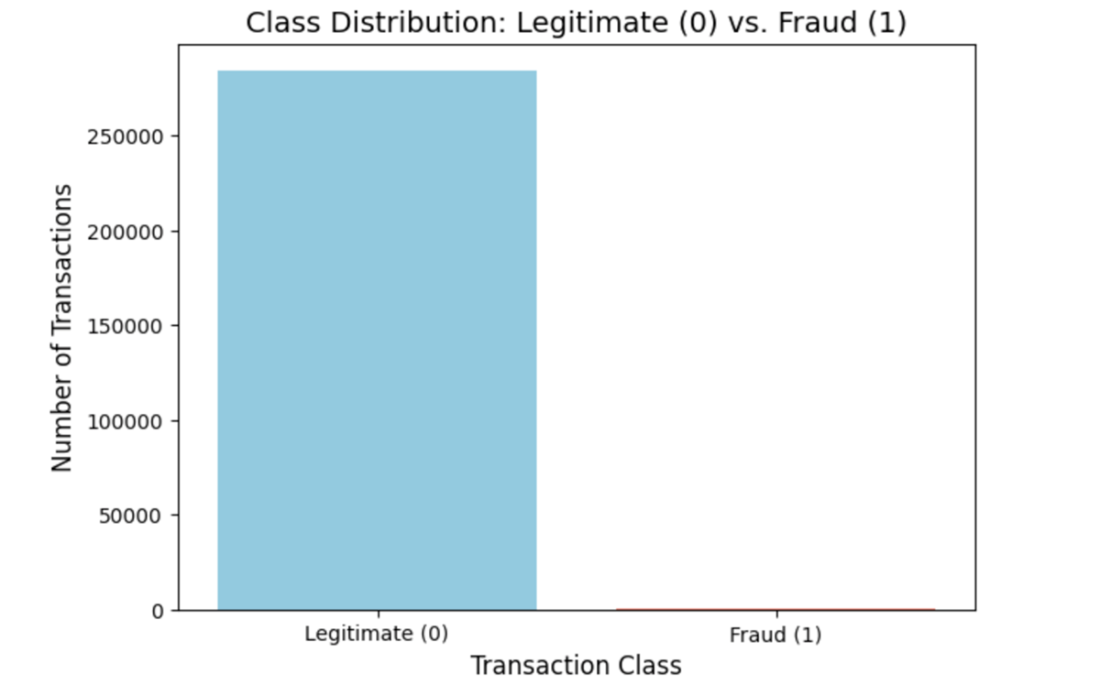
The class distribution of the credit card transaction dataset. This chart clearly illustrates the severe class imbalance that is the central challenge of this fraud detection problem. Out of more than 284,000 transactions, only 492 (approximately 0.17%) are fraudulent (Class 1), while the vast majority are legitimate (Class 0).
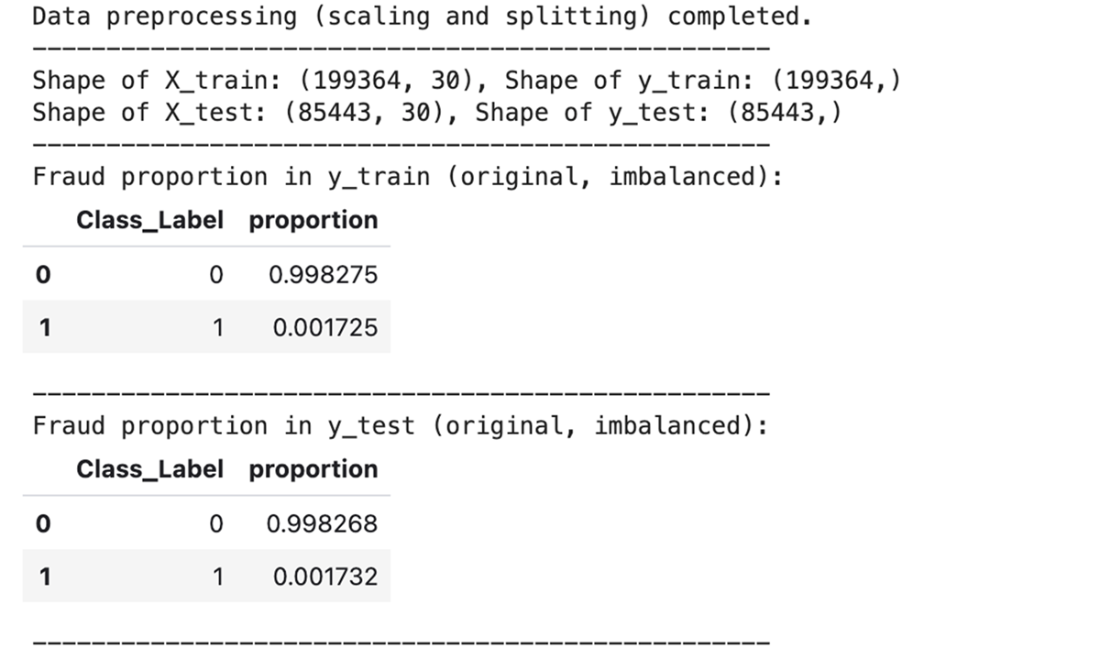
Output confirming the successful scaling and stratified splitting of the data. The shapes of the train/test sets are printed, and the fraud proportions are shown to be consistent across both sets.
Output from the completed RandomizedSearchCV. It shows the optimal hyperparameters found for both the SMOTE and classifier steps, and the corresponding best recall score of approximately 0.8894.

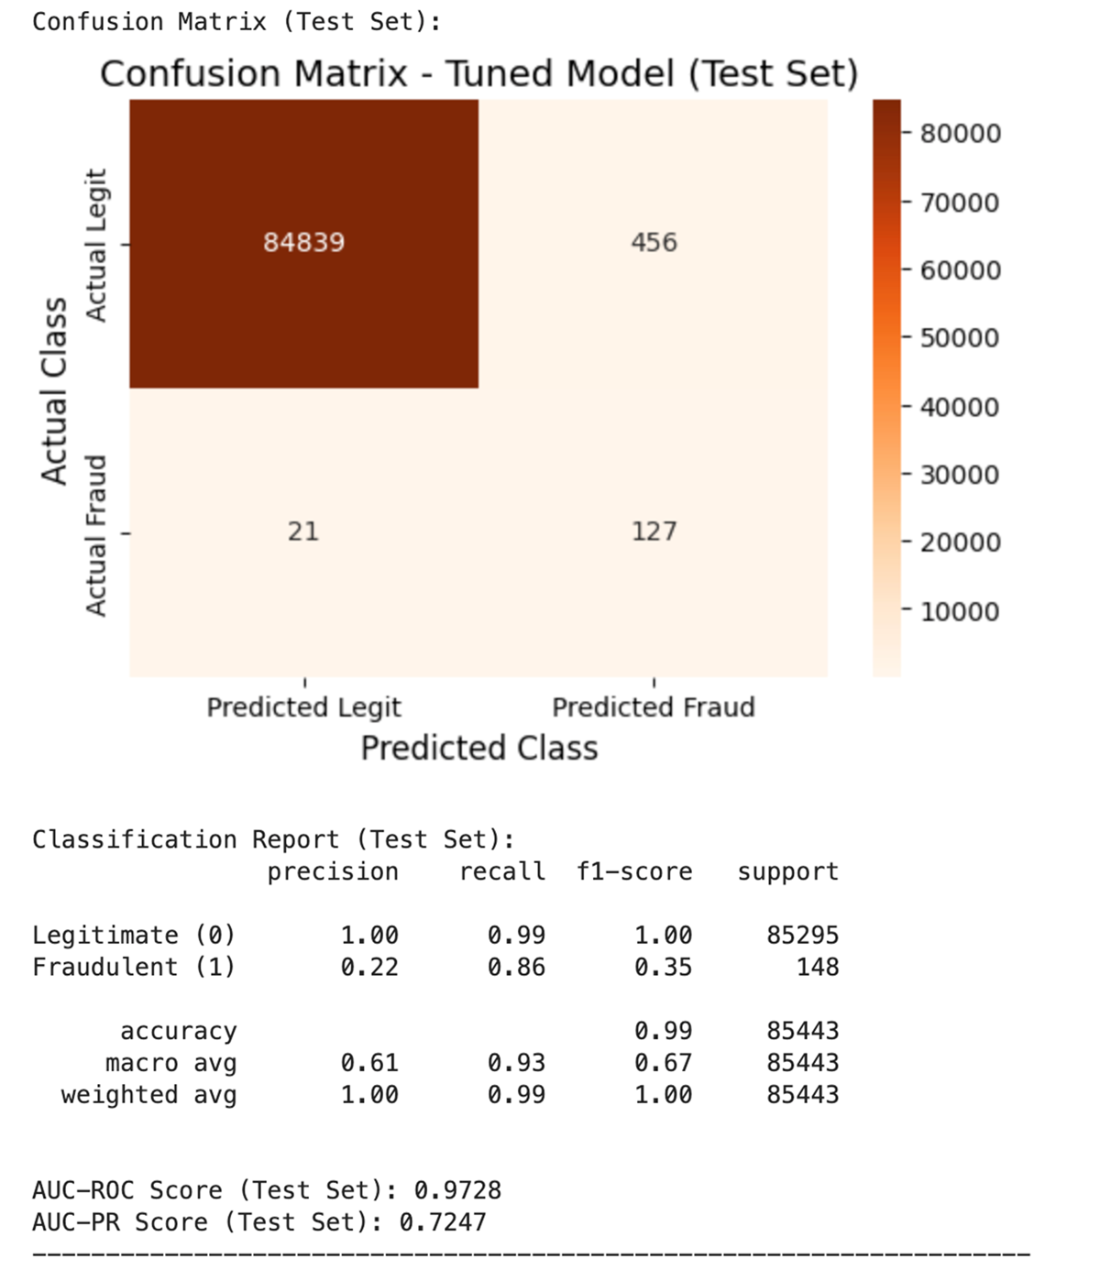
Performance of the tuned model on the test set. This comprehensive evaluation highlights the model's strengths and trade-offs. It achieves a high recall of 0.86 for fraudulent transactions (Class 1), successfully identifying 127 out of 148 actual frauds. However, the confusion matrix shows this comes at the cost of low precision (0.22), resulting in 456 legitimate transactions being incorrectly flagged as fraudulent (false positives). The AUC-PR score of 0.7247 reflects this precision-recall trade-off.
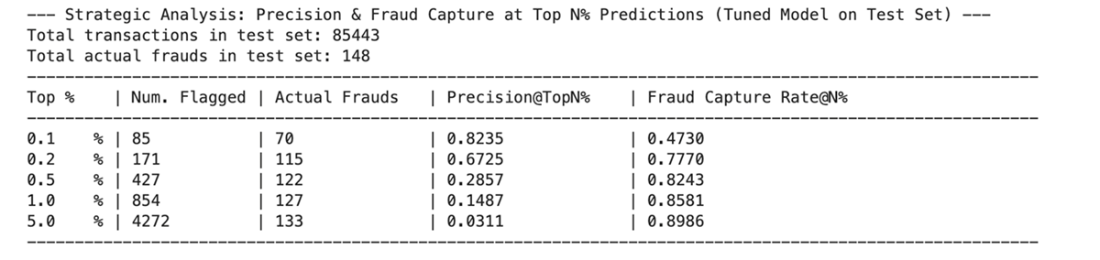
A strategic analysis table showing precision and fraud capture rates at different top-N% thresholds. This output allows a direct comparison of how detection accuracy changes as the review scope widens.
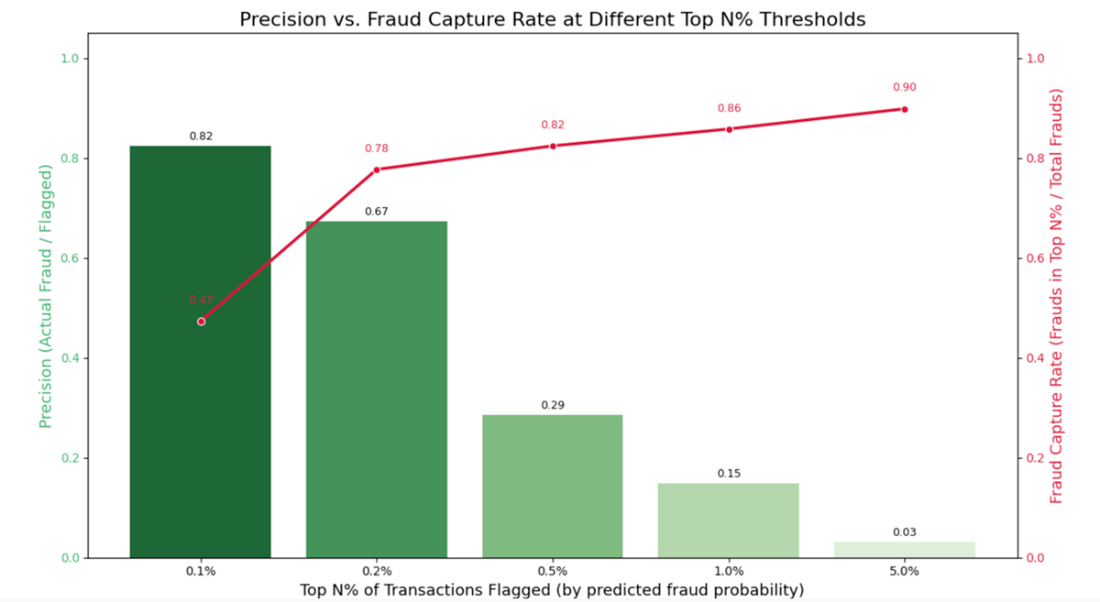
A business-centric view of model performance, illustrating the trade-off between precision (bars) and fraud capture rate (line). Reviewing only the top 0.1% of riskiest transactions yields a high precision of 0.82 but captures just 47% of total frauds. To increase the capture rate to 82%, a fraud team must review the top 0.5% of transactions, accepting a much lower precision of 0.29.
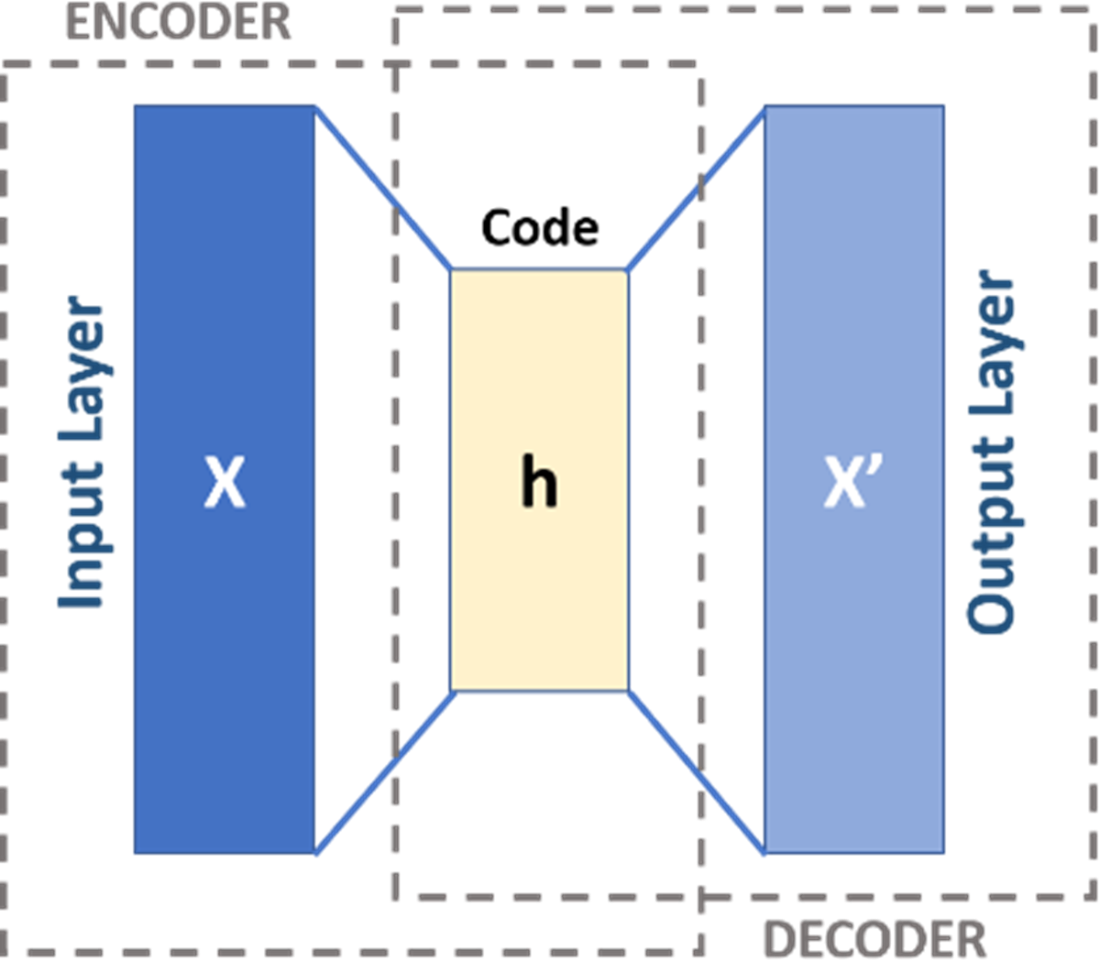
Autoencoder architecture for unsupervised fraud detection. The encoder compresses the input transaction X into a low-dimensional representation h, and the decoder reconstructs it as X′. Anomalous (potentially fraudulent) transactions are identified when the reconstruction error ∥X−X′∥ is significantly high, indicating patterns the model failed to learn during training on normal data.
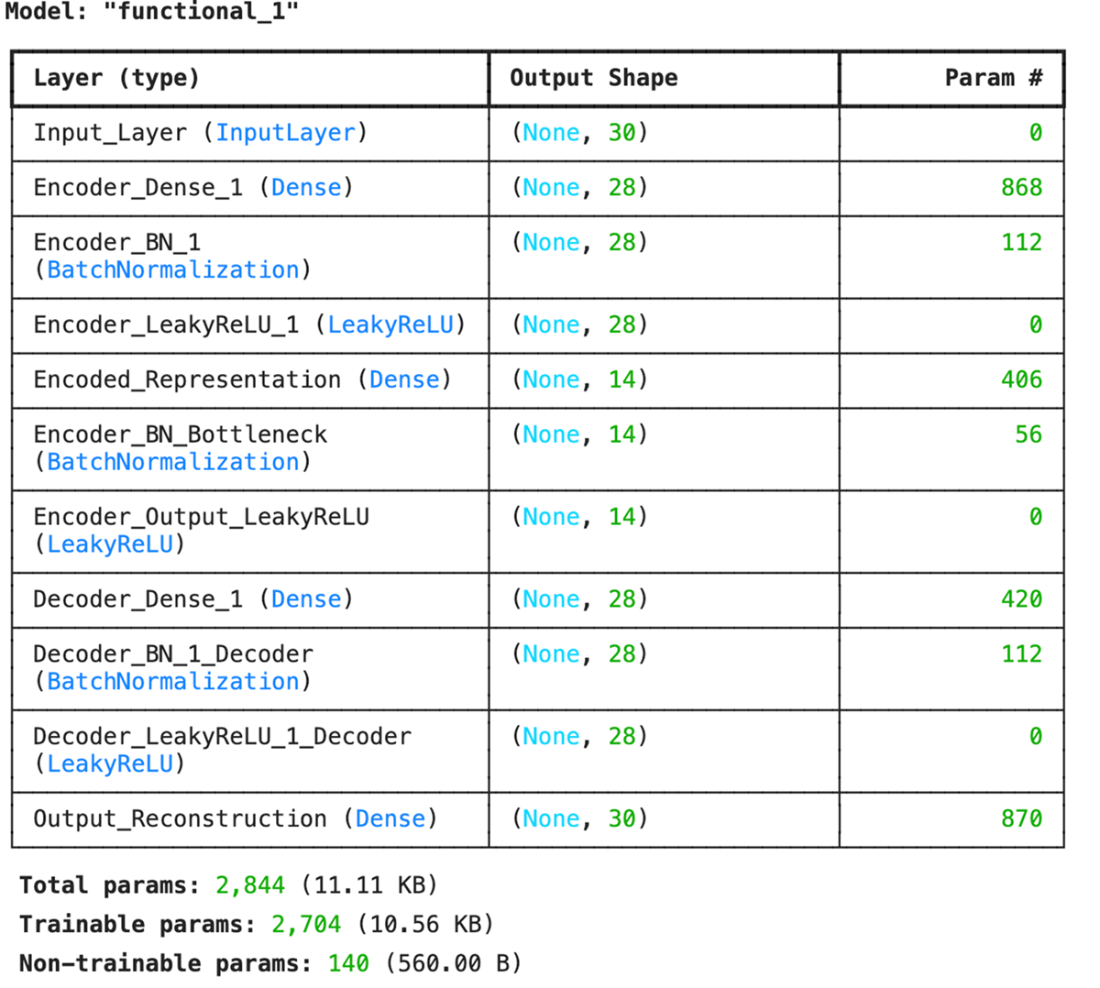
The architecture summary of the autoencoder model. The table shows the model layers, starting from the input layer with 30 features, compressing down to the Encoded_Representation bottleneck of 14 features, and then expanding back to the final Output_Reconstruction layer with 30 features.
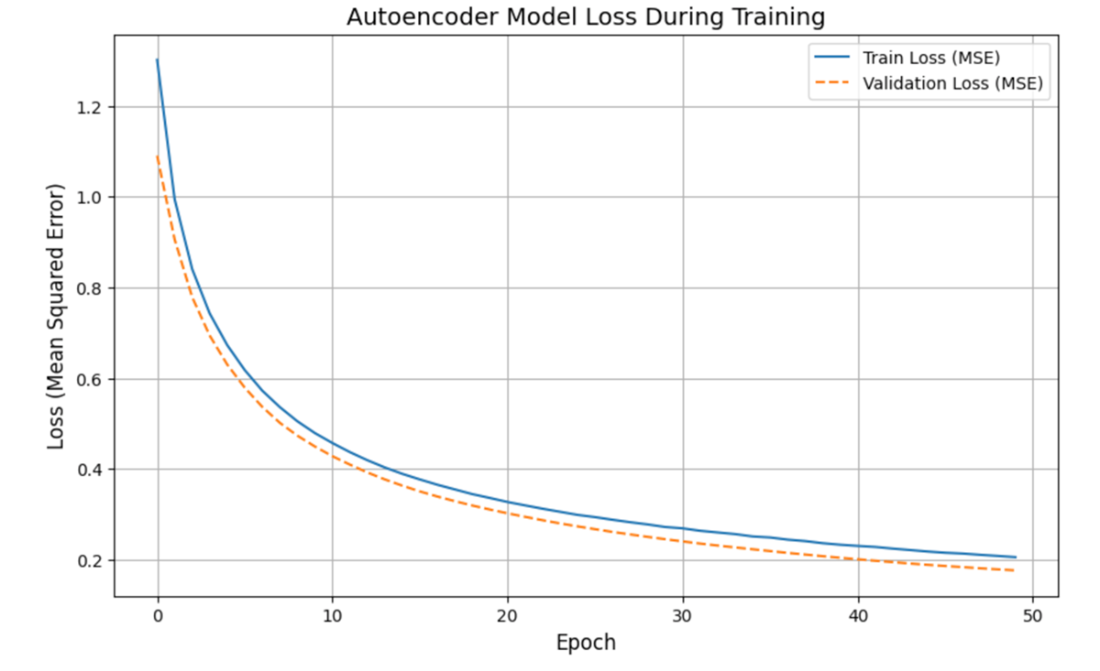
Autoencoder training and validation loss. The plot shows that both the training loss (solid line) and the validation loss (dashed line) on legitimate data decrease steadily and converge. The stabilization of the validation loss indicates that the model has successfully learned to reconstruct "normal" transactions without significant overfitting, and that the EarlyStopping callback likely halted training at an optimal point.
Summary statistics of reconstruction errors, grouped by the true class. The table clearly shows that the error metrics (both MSE and MAE) are substantially higher for the fraudulent class (true_class=1) compared to the legitimate class (true_class=0).

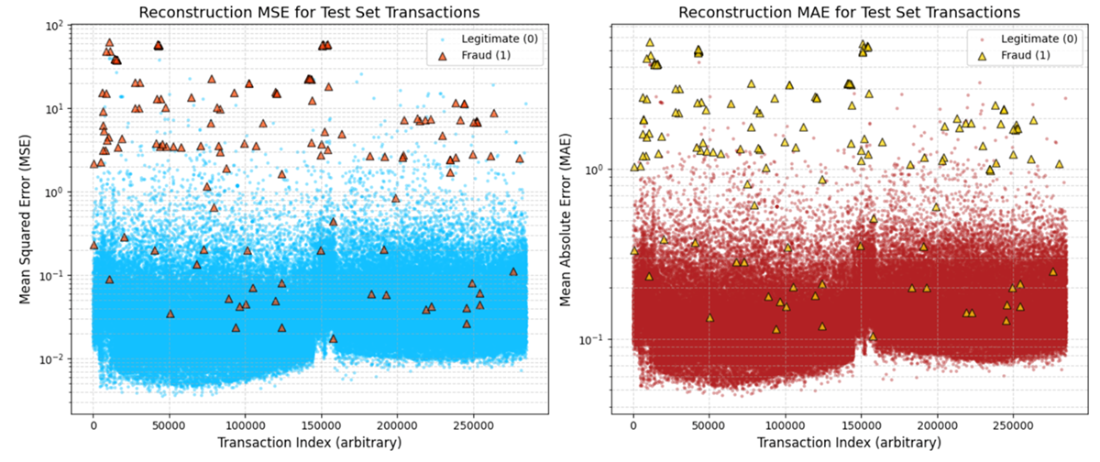
Reconstruction error scatter plots for the test set. These two plots show the Mean Squared Error (MSE, left) and Mean Absolute Error (MAE, right) for each transaction. Legitimate transactions (circles) are clustered at the bottom with low error values, while fraudulent transactions (triangles) are clearly separated with significantly higher errors. This visual separation on the log-scaled y-axis provides strong evidence that reconstruction error is an effective feature for identifying anomalies.
Summary
- Effective AI-driven fraud detection centers on three quests: recognizing known fraud patterns, finding unknown anomalous activities, and (as a precursor to Chapter 9) unveiling hidden connections between entities.
- Supervised learning is powerful for "recognizing the known" when reliable labeled historical fraud data is available, learning to classify transactions or score their risk based on past illicit patterns.
- Key challenges in supervised fraud detection include acquiring high-quality labels, addressing extreme class imbalance (e.g., via SMOTE or cost-sensitive learning), and selecting appropriate evaluation metrics (e.g., Precision, Recall, F1-Score, AUC-PR) over simple accuracy.
- Modern supervised systems strive for contextual understanding beyond binary classification, learning to differentiate legitimate atypical behavior (like travel) from true fraud by analyzing a rich tapestry of features, thereby reducing false positives.
- A hands-on example demonstrated building a LightGBM classifier within an imblearn pipeline that incorporates SMOTE, performing hyperparameter tuning using RandomizedSearchCV and evaluating the tuned model on an imbalanced test set.
- Strategic analysis, such as calculating and visualizing Precision@TopN% and Fraud Capture Rate@TopN%, translates model performance into actionable operational insights, helping to set alert thresholds and allocate review resources based on risk appetite and capacity.
- Unsupervised anomaly detection, exemplified by autoencoders, is vital for "finding the unknown" by learning the patterns of normal data and flagging significant deviations (high reconstruction errors) as potential novel fraud, without relying on prior fraud labels for training.
- Autoencoders for fraud are typically trained on legitimate transaction data to learn "normality"; fraudulent transactions, being anomalous, are expected to have higher reconstruction errors when processed by the trained model.
- Visualizing reconstruction error distributions (e.g., via scatter plots on a log scale) can demonstrate the separability between legitimate and fraudulent transactions based on these errors.
- In real-world unsupervised scenarios (lacking true labels for new data), setting an operational threshold for reconstruction error is a critical strategic decision, often guided by statistical analysis of normal errors, operational review capacity, customer friction tolerance, and extensive testing in "shadow mode" with analyst feedback.
- Deploying real-time fraud scoring models (both supervised and unsupervised) involves considerations like model export formats (ONNX, PMML), high-performance serving infrastructure, low-latency feature retrieval, integration with decision engines, safe rollout strategies (A/B testing, canary releases), and comprehensive logging for audit and continuous monitoring.

 Financial AI in Practice ebook for free
