6 Enhancing BFSI scoring workflows: advanced binning, monitoring, and explainability
This chapter shows how BFSI scoring workflows can move beyond slow, manual model building toward automated, governed, and explainable systems. It begins from the reality that hand-crafted WOE binning, constant drift checks, and bespoke scorecard construction are too time-consuming for enterprise use. To address this, the chapter introduces automation tools that preserve interpretability while reducing operational burden, with a strong emphasis on compliance, stability, and communication across technical and business teams.
At the modeling level, OptBinning is used to automate numeric and categorical binning, enforce statistical selection rules, and generate production-ready scorecards with standard BFSI score ranges. The chapter explains how bins are evaluated, how scorecards are fitted on top of a logistic model, and how practitioners inspect both compact and detailed scorecard views to verify point assignments and monotonic risk patterns. It also covers performance validation with ROC, CAP, and K-S metrics, showing how standardized scores can be used for accept/reject thresholds and portfolio decisions.
Beyond model creation, the chapter focuses on keeping scorecards trustworthy after deployment. OptBinning’s monitoring tools and Evidently are presented as complementary ways to track drift, compare reference and current populations, and identify changes in feature or target distributions. The chapter then expands into explainability, distinguishing local methods such as LIME and SHAP for answering individual “why me?” questions from global methods like feature importance, partial dependence plots, and surrogate models for auditor-level understanding. It closes by stressing that explanations must be operationalized carefully through reason codes, fairness checks, privacy safeguards, and simple user-facing narratives, with GenAI positioned only as a controlled translation layer rather than a decision-maker.
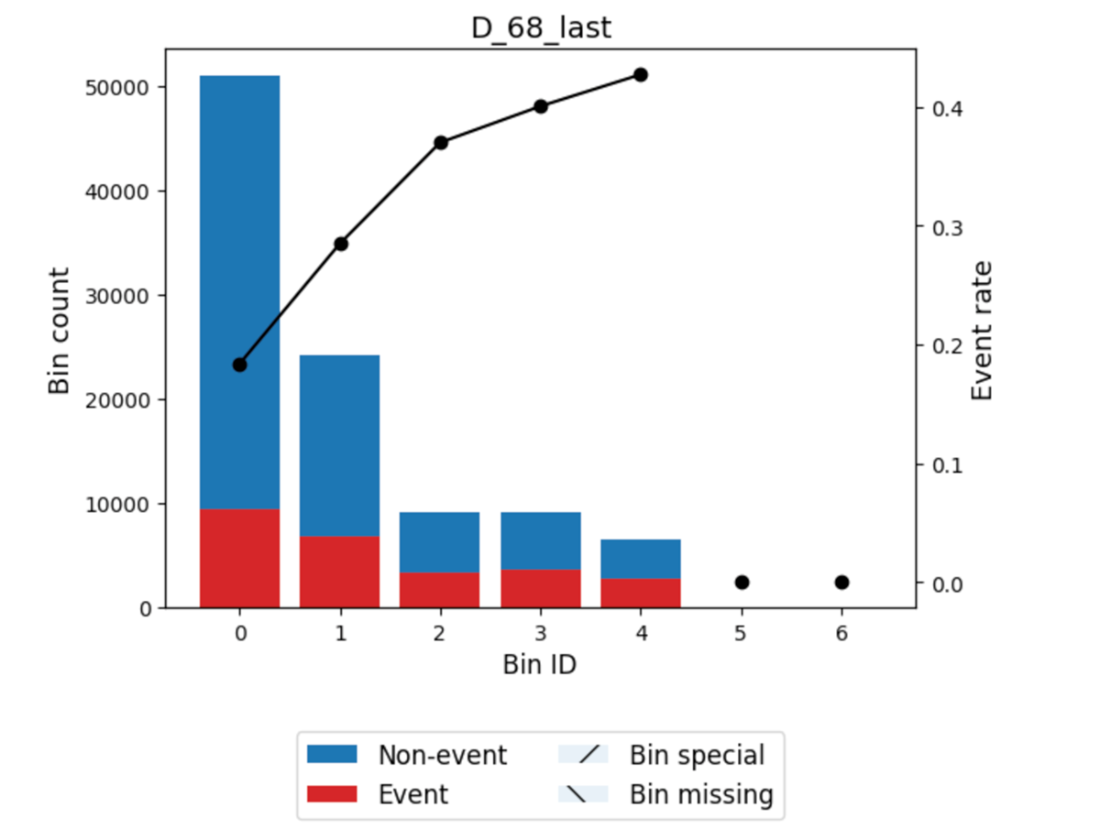
Default rate and bin counts for D_68_last. Each bar represents the number of observations per bin, broken down by event (red) and non-event (blue). The black line shows the default rate for each bin. Bars labeled “Bin special” represent outliers or special codes (e.g., -999), while “Bin missing” indicates null values handled separately.
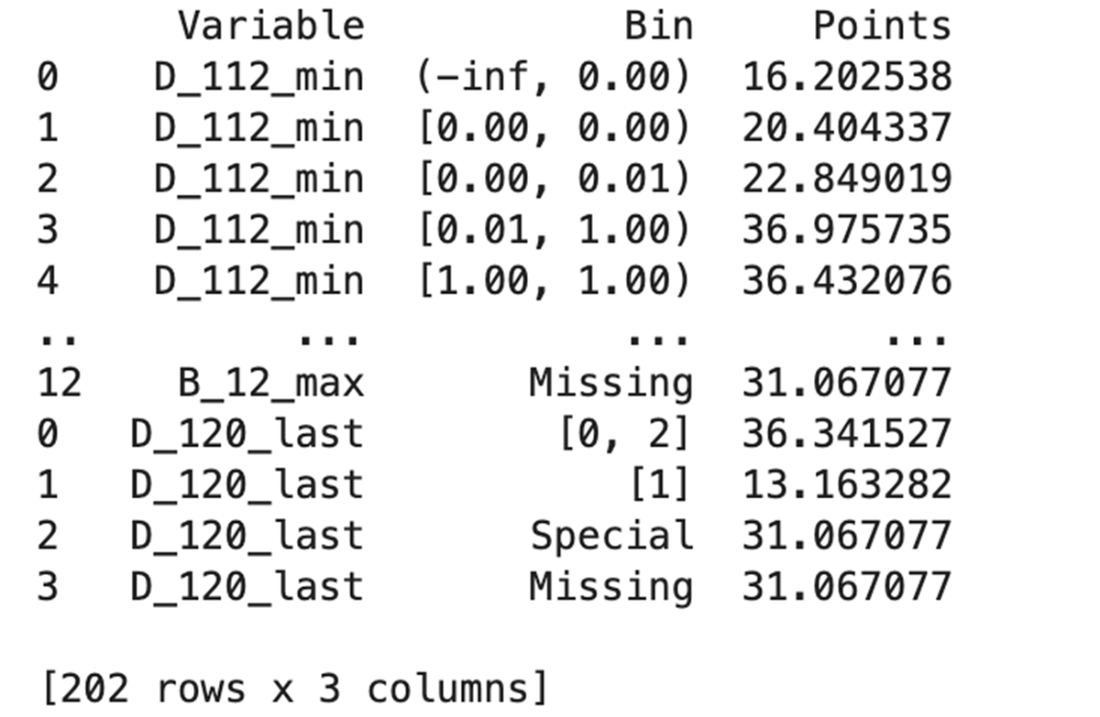
Summary scorecard table showing variable-wise bin points.
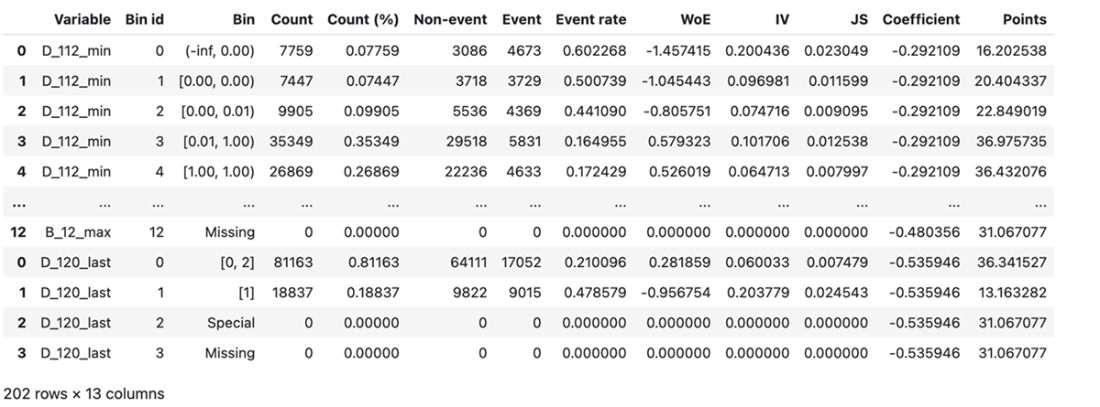
Detailed scorecard table showing additional metrics for each bin.
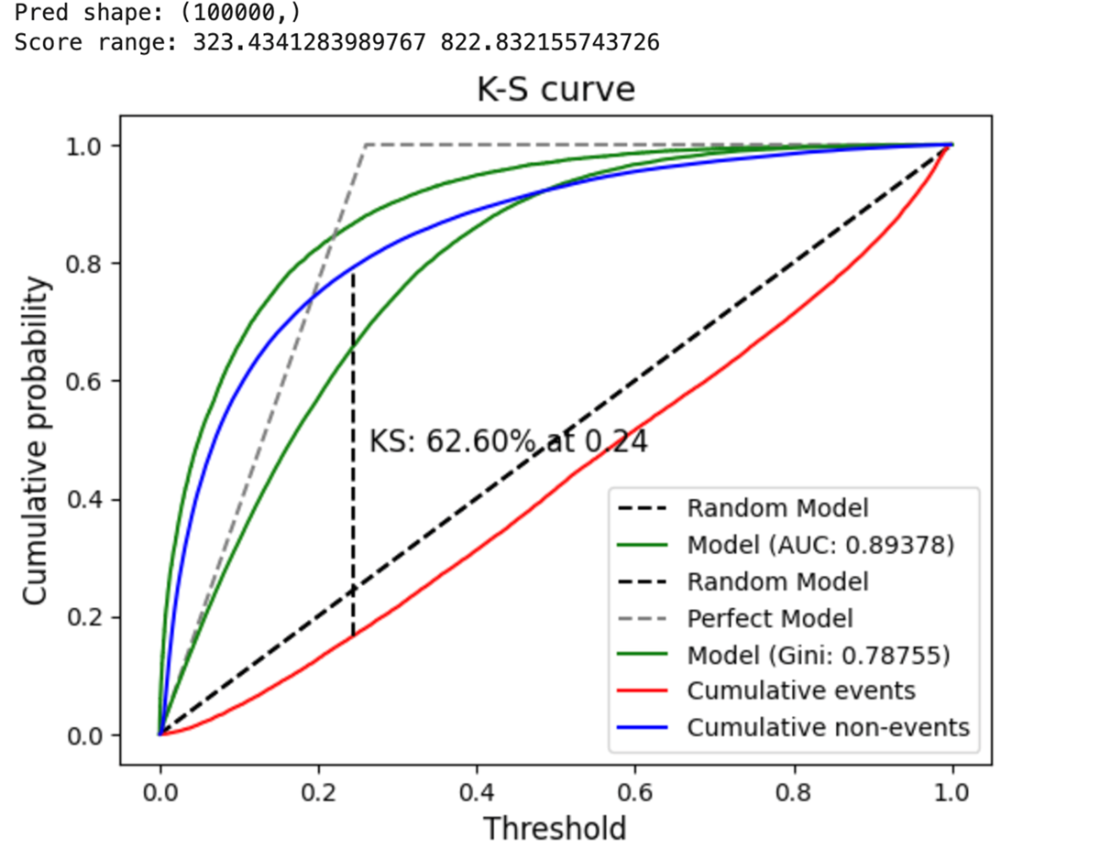
K-S curve showing model separation. The dashed diagonal represents a random model, while the dotted line shows a perfect classifier. The solid lines display the cumulative proportion of events and non-events based on predicted probability thresholds. The vertical distance at the K-S point (here, 62.6% at threshold 0.24) is the maximum separation between these two groups.
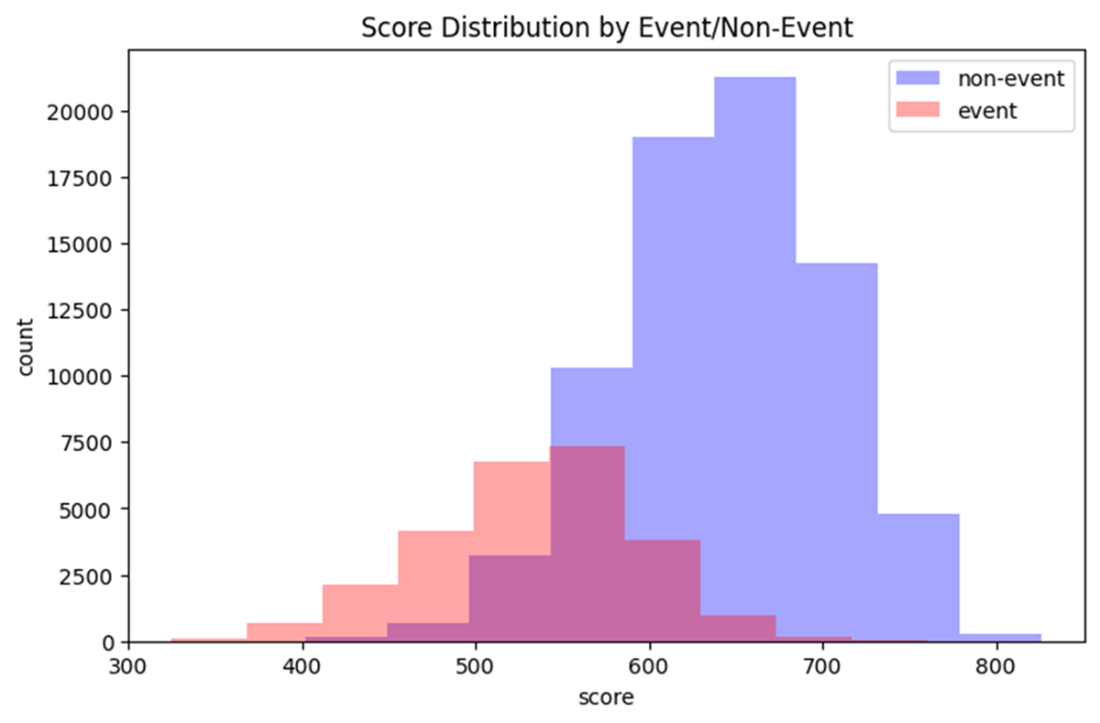
Distribution of scores by event status. This histogram illustrates how BFSI credit scores spread across the population. The lighter fill represents non-events (higher scores), while the dashed black outline denotes events (lower scores). A visible separation suggests the model successfully distinguishes creditworthy applicants from high-risk ones.
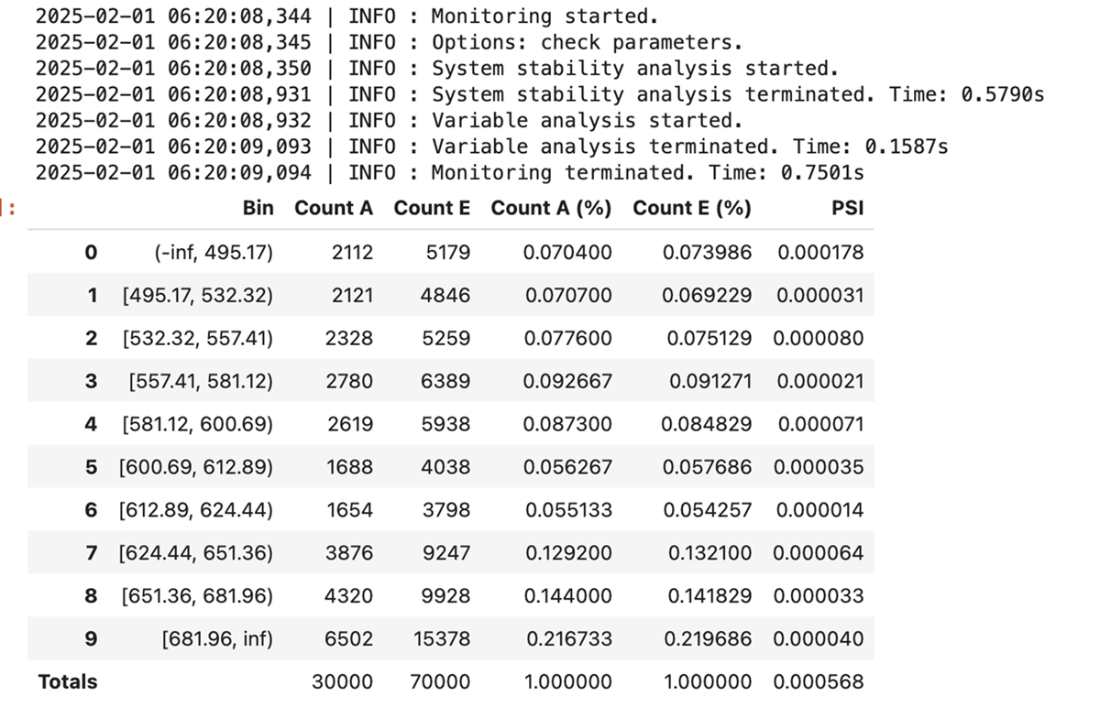
PSI summary table. Each row compares the score distribution between current and reference populations. The rightmost column shows the PSI value for that bin.
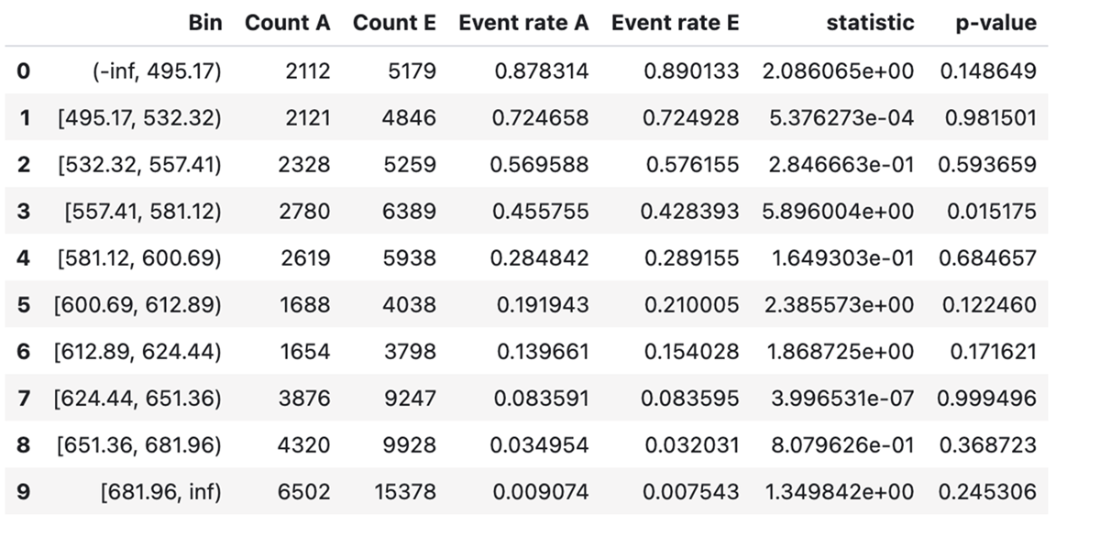
Significance testing results by bin. Each row reports a p-value testing whether the event rate has shifted between the two datasets for a given bin.
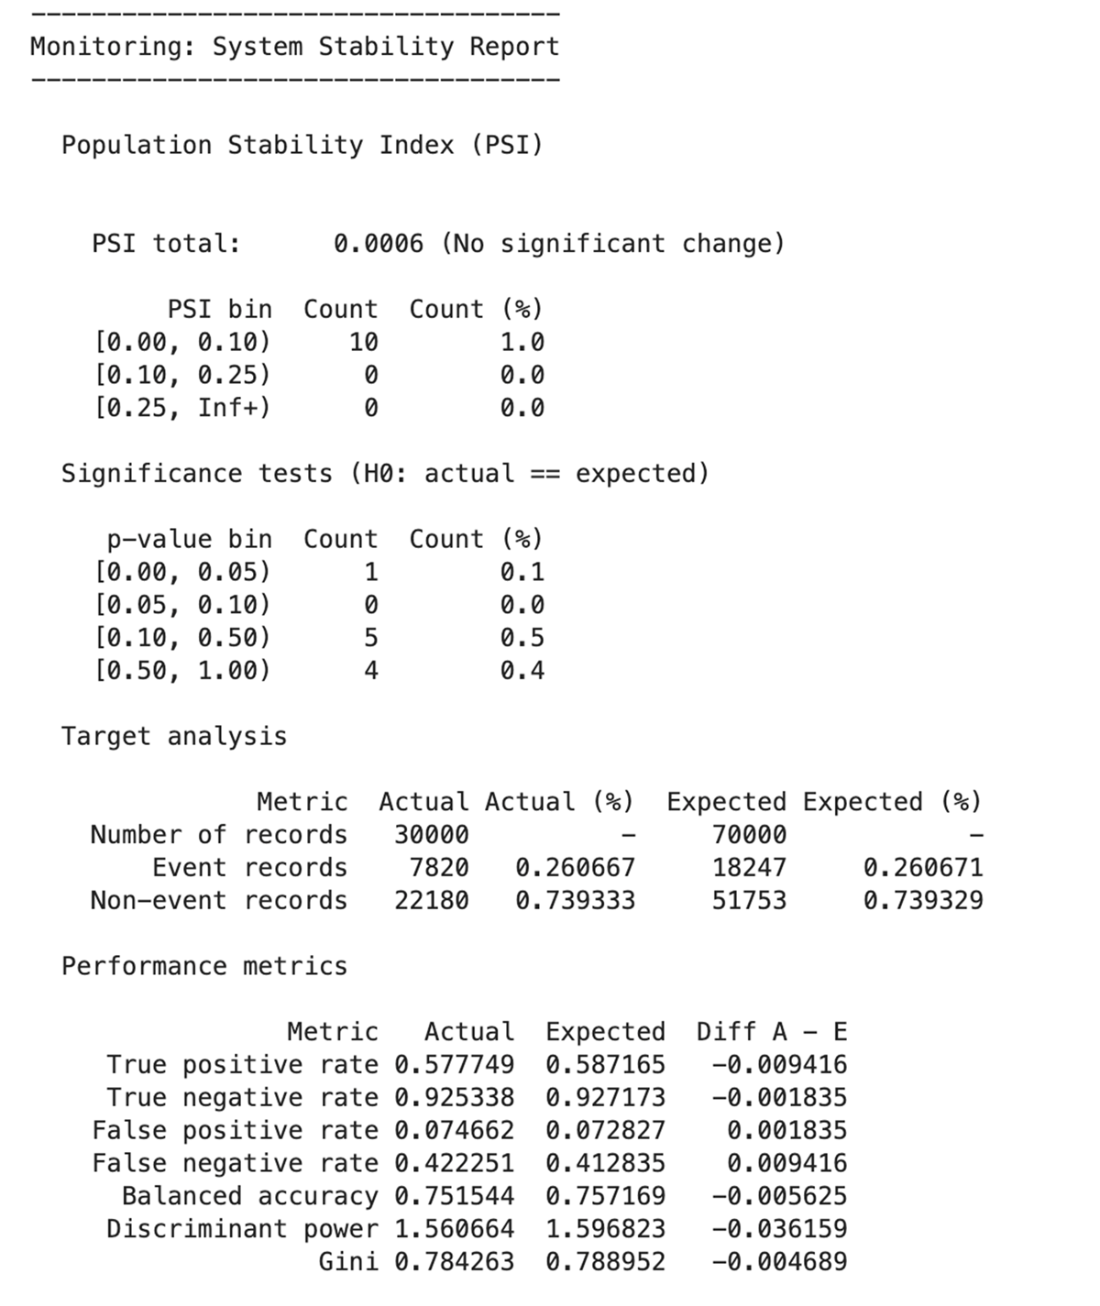
Consolidated system stability report. A comprehensive summary showing drift indicators (PSI, p-values) alongside model-level performance comparisons.
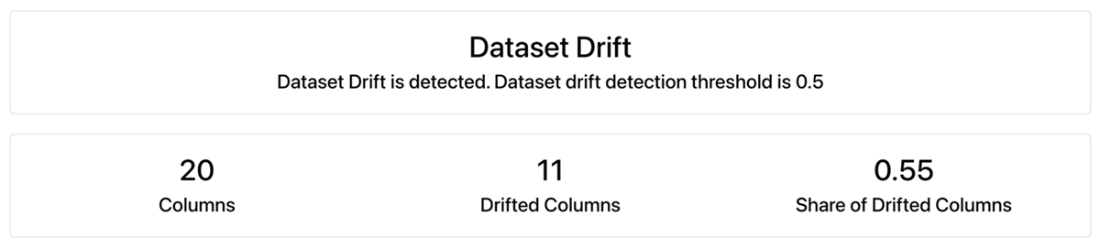
Top-level drift summary in Evidently. The model identified that more than half (11 out of 20) BFSI features exceeded the default drift threshold of 0.5, prompting further review. Note that this Evidently run flags more drifted features than the near-zero PSI reported earlier. That is expected: PSI and Evidently's per-column tests use different statistics and thresholds. Treat the flagged features as candidates to review against business KPIs, not as a contradiction.
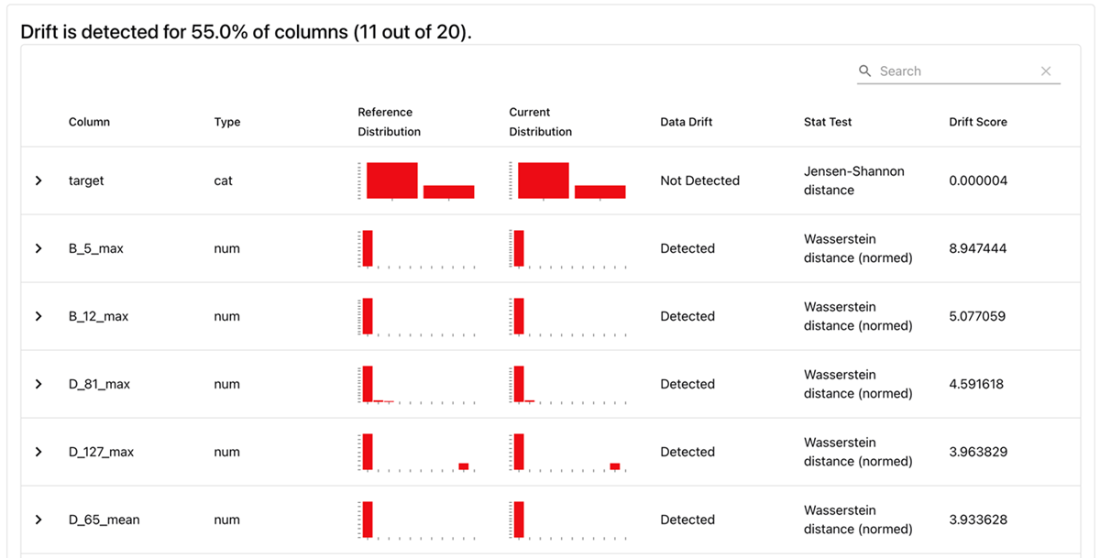
Detailed per-feature drift table. Each row reveals the drift measure used (e.g., Wasserstein), the normalized drift score, and a mini visualization of distribution changes from reference to current. A small search bar in the corner enables quick filtering by feature name.
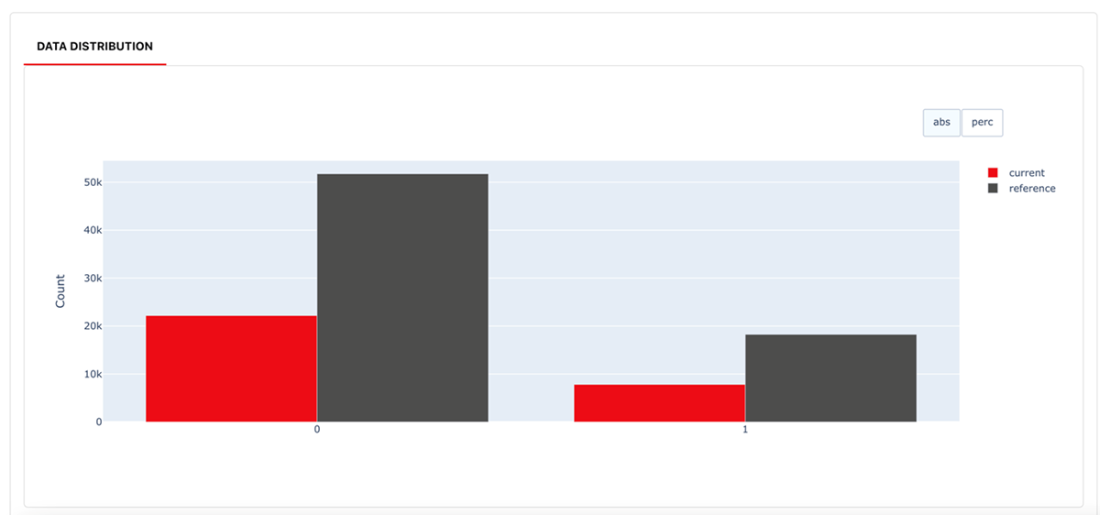
Target drift panel in Evidently. The bar chart displays the default=0 and default=1 rates in the reference set (gray) vs. the current set (red). Here, “no drift detected” indicates minimal changes in the proportion of defaults.
Summary
- OptBinning automates the binning process for numeric and categorical features, reducing manual WOE steps and ensuring consistent bin boundaries.
- Domain constraints—like information value thresholds or minimum quality scores—enable BFSI teams to align binning decisions with regulatory requirements and data quality standards.
- A logistic model trained on OptBinning’s bins can produce a transparent BFSI scorecard, assigning interpretable point values to each bin.
- ScorecardMonitoring uses population stability indexes (PSI) and significance tests to spot distribution drifts, helping teams maintain stable credit models over time.
- When substantial drift appears, champion–challenger strategies let BFSI practitioners compare old and new models side by side before full deployment.
- Evidently provides an interactive HTML dashboard that highlights shifting feature distributions and target rates, allowing BFSI risk managers to diagnose and address model performance issues promptly.
- Explainability-via LIME, SHAP, and global interpretation methods-ensures credit decisions are transparent to regulators and users, yielding reason codes and actionable feedback.
- LLM‚based Q&A can further enhance user experience, but must be carefully integrated to avoid privacy or compliance pitfalls, reinforcing BFSI's commitment to trustworthy AI solutions.
- While mathematical interpretability (like SHAP) provides regulatory transparency, Generative AI bridges the gap to human comprehension. By strictly limiting LLMs to a "translation" role—converting deterministic model outputs into readable text or chat interfaces for underwriters—institutions can improve user experience without risking compliance violations from AI hallucinations.

 Financial AI in Practice ebook for free
