10 Building the quantitative engine: market direction prediction with ML
We begin by shifting from defensive AI use cases in finance to an offensive one: building an end-to-end investment system aimed at generating alpha. The chapter frames this effort within the evolution of quantitative finance, showing how modern practice blends classical portfolio theory, factor investing, machine learning, and newer AI capabilities into a layered workflow that moves from idea generation to live execution. It emphasizes that the project is intentionally practical and accessible, focusing on daily and weekly horizons and public data rather than ultra-fast trading or expensive proprietary feeds.
The core of the chapter is data preparation for market direction prediction. It argues that data quality matters more than model complexity, then builds a robust ETF-based pipeline using broadly available instruments as economic proxies for equities, bonds, commodities, credit, currencies, and sectors. After downloading and validating ten years of adjusted price and volume data, the chapter engineers a rich feature set: technical indicators, volatility measures, momentum signals, volume relationships, and cross-asset features such as correlations and spreads. It also defines a realistic three-class target for next-day SPY movement using a meaningful threshold to separate bullish, bearish, and neutral days, which helps reduce noise and better reflect trading reality.
For modeling, the chapter favors Random Forest over more glamorous deep learning approaches because it is better suited to noisy, regime-dependent financial data and offers useful interpretability. It insists on time-series-aware validation, adding embargo periods to prevent leakage caused by overlapping feature windows, and then trains the model with conservative hyperparameters to avoid overfitting. Evaluation is framed in trading terms rather than academic accuracy alone: the model achieves only a modest edge, with directional accuracy slightly above chance and balanced accuracy reflecting the class imbalance, but that is presented as meaningful in efficient markets. The main takeaway is that the model is not a standalone trading solution, but a disciplined, diagnosed signal that can later be combined with complementary sources, such as LLM-driven news sentiment, in a broader multi-signal strategy.
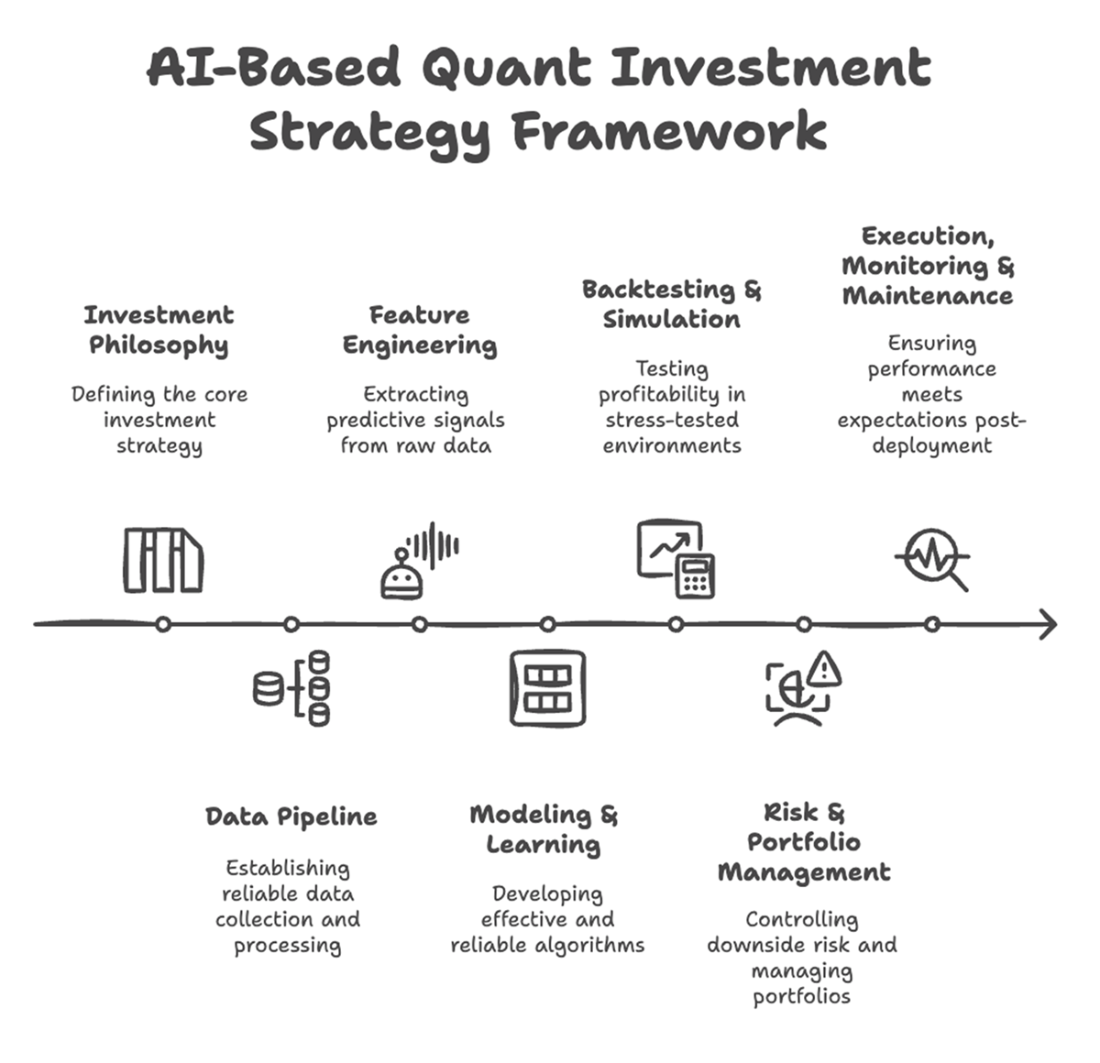
The AI-Based Quantitative Investment Strategy Framework, an industrial-grade workflow for developing and deploying robust strategies. This seven-step process represents the end-to-end pipeline used by professional quantitative teams, moving from a core idea to a live, monitored trading system. Each stage is a critical link; a failure in one invalidates all subsequent work.
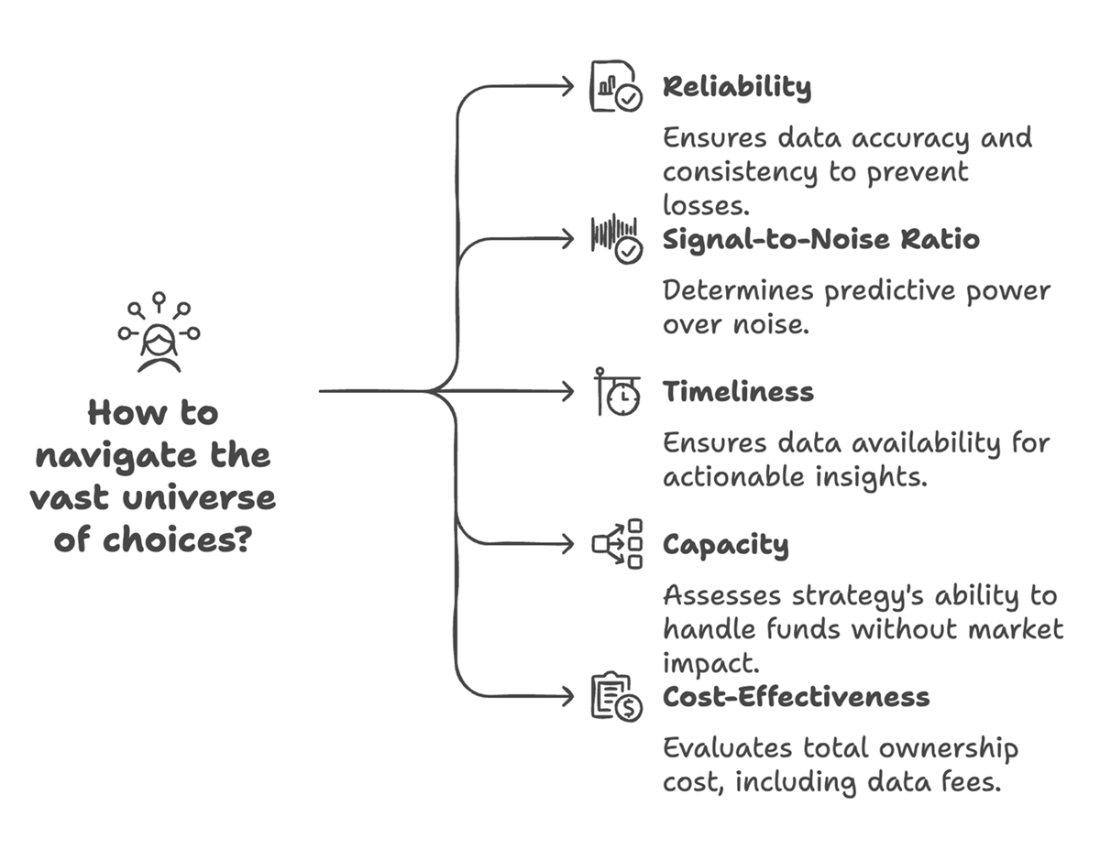
The professional quant's framework for evaluating data sources, a five-point due diligence process to systematically filter potential alpha streams. In a world of infinite data, the ability to make intelligent choices is paramount. This framework is not merely a checklist but a rigorous gating process that professional funds use to assess the viability of any potential data source before committing significant time and resources.
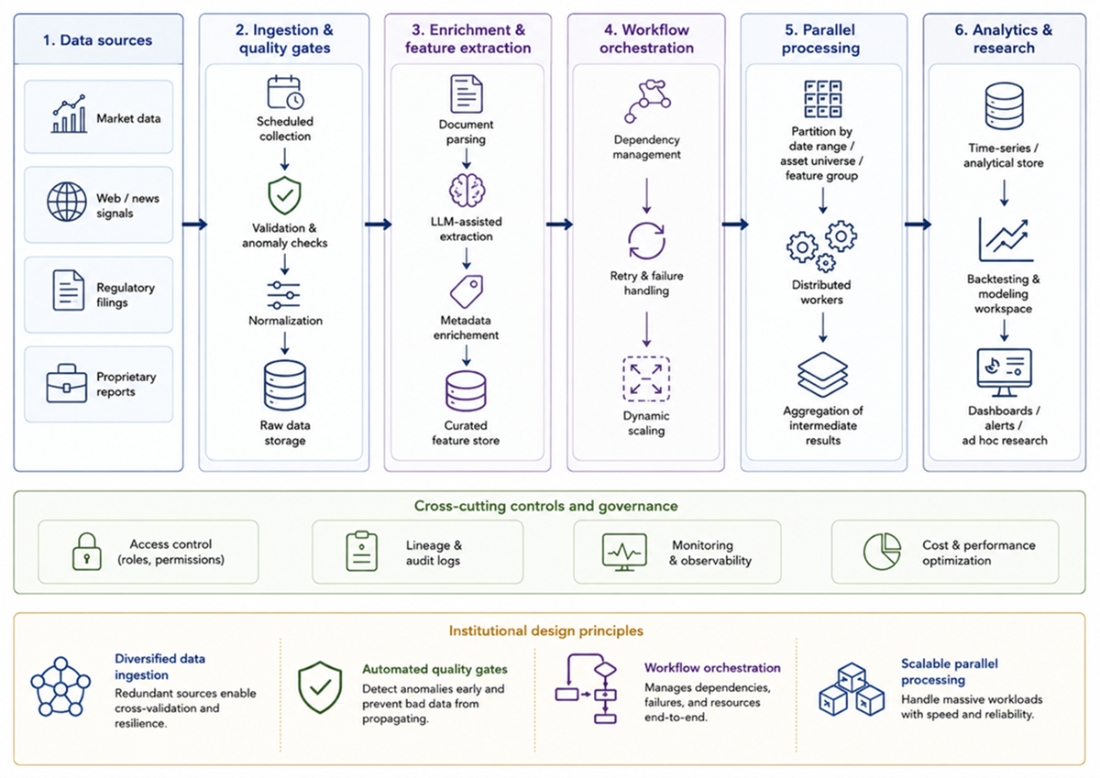
Conceptual architecture for an institutional quantitative research pipeline. The figure shows how a production-grade pipeline expands beyond simple data download into source diversification, quality gates, enrichment, orchestration, parallel processing, and research-ready analytical storage.
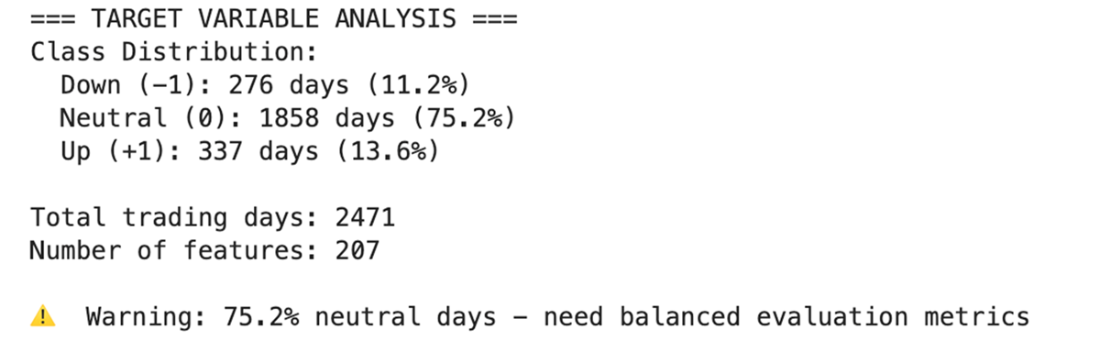
Target Class Distribution. This severe class imbalance reinforces the need for class-weight adjustments and balanced evaluation metrics.
Expanding Window Splits. The output shows that with each fold, the training data grows to include the previous test period, always maintaining the chronological order.
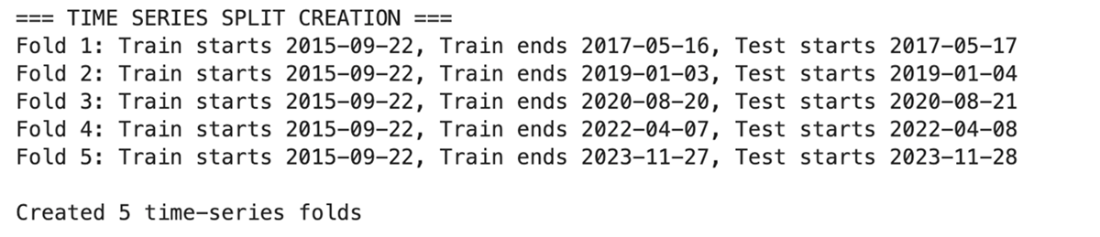
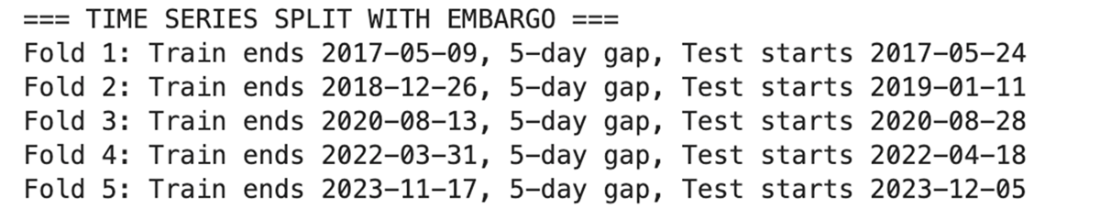
Embargoed Time-Series Splits. The output now clearly shows a consistent time gap between the end of the training data and the start of the test data. This is the validation set (splits) we will use going forward.
Final Model Training Results. The conservative parameters prioritize model stability over training accuracy. The reduction from 2,471 to 2,030 predictions reflects the embargo periods applied for rigorous validation—the price we pay for honest out-of-sample evaluation. In a real-world setting, an additional step before training would involve analyzing feature correlation to mitigate multicollinearity, ensuring that our model isn't overly reliant on redundant signals.

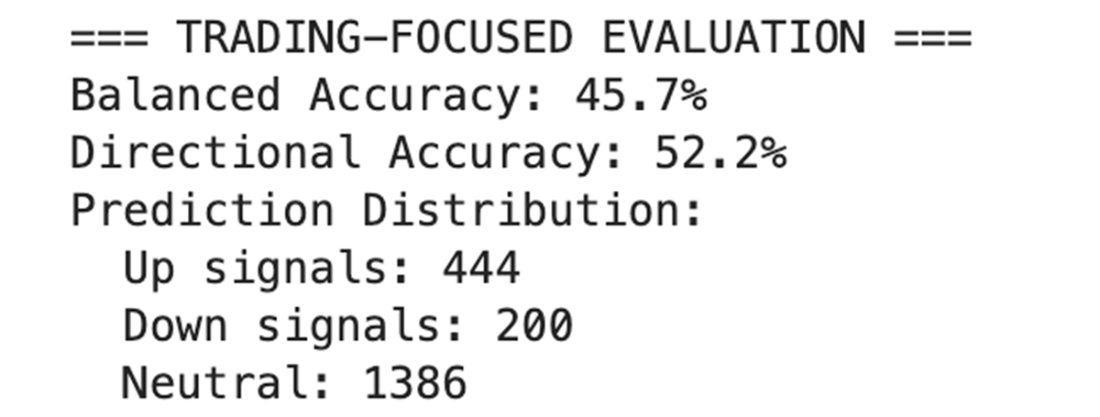
Final Model Performance. The results show a Directional Accuracy of 52.2%, suggesting a modest predictive edge under the specific condition that both the model makes a directional prediction and the market actually moves. The balanced accuracy of 45.7% represents a meaningful improvement over the 33% random baseline for this 3-class problem.
Summary
- Professional quant strategies are built on a structured framework, mapping a 7-step workflow (from Investment Philosophy to Execution) to a 4-Layer Architecture (Data Asset, Modeling, Strategy & Monitoring, Application) to ensure a robust and scalable system.
- ETFs provide real-time economic proxies that avoid fundamental data lag—use SPY as target variable while leveraging TLT (treasuries), GLD (gold), and UUP (dollar) as predictive features for cross-asset relationship modeling.
- Professional quantitative strategies require rigorous time-series validation that respects temporal ordering—standard k-fold cross-validation commits the cardinal sin of training on future data to predict the past.
- Embargo periods between training and test sets are mandatory, not optional, because multi-day features like 60-day momentum create information leakage that artificially inflates performance metrics and leads to live trading failures.
- Cross-asset features like SPY-TLT correlation and risk-on/risk-off momentum differentials provide more sustainable alpha than individual asset momentum—engineer both technical indicators and relationship features for maximum predictive power.
- Random Forest excels in financial prediction tasks because it naturally captures regime-dependent, non-linear relationships while providing interpretability for risk management—essential qualities that black-box deep learning models often lack.
- Balanced accuracy and directional accuracy provide more meaningful evaluation than standard accuracy when dealing with imbalanced financial data where 75% of days are neutral moves.
- Directional accuracy of 52% shows limited but potentially useful predictive skill when evaluated only on directional market moves—this conservative evaluation approach reveals the model's true edge is small and requires careful integration with other alpha sources.
- Multi-signal strategies require combining diverse alpha sources rather than relying on single models—our ETF directional model provides one component that must be integrated with complementary signals and proper risk management for profitable trading.

 Financial AI in Practice ebook for free
