5 Evolutionary Observability
Observability is presented as a foundational capability for modern platform engineering, turning raw telemetry into actionable insights that improve system stability, speed diagnosis, and build trust with stakeholders. The chapter argues that true observability goes beyond data collection to explain system state and usefulness, combining metrics, logs, and traces to answer what happened, how it happened, and why. It warns that demand for insights can spur shadow IT (e.g., spreadsheet silos) unless the platform intentionally treats data as a product and provides self-serve capabilities. To avoid narrow, app-only monitoring and “telemetry debt,” observability is framed across eight lenses—infrastructure, application, service health, incidents, portfolio, platform, cloud cost, and business operations—so leaders, engineers, finance, and security share a common picture and vocabulary. The outcome is an evolutionary feedback loop in which observability informs decisions from day one and grows in value as the platform matures.
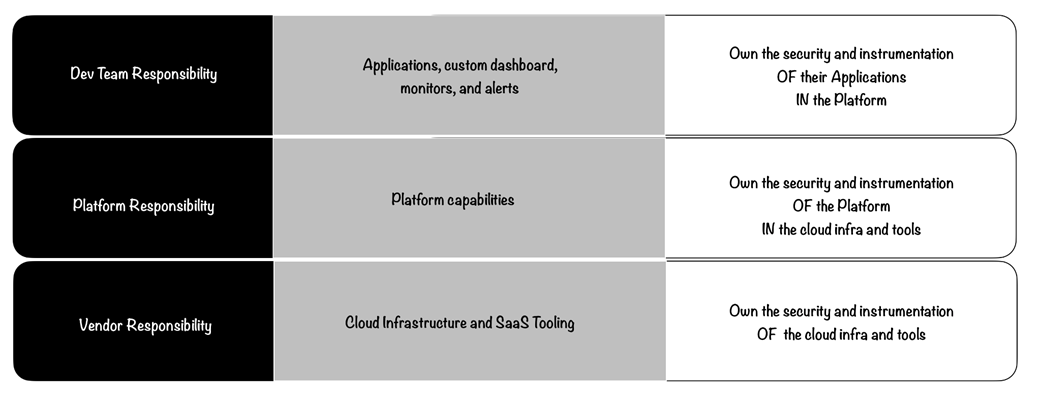
Practically, the chapter defines “what good looks like” through three operating states—known-knowns, known-unknowns, and unknown-unknowns—and emphasizes moving more scenarios into the first category through strong tracing and broader data coverage, increasingly aided by anomaly detection. It recommends a single pane of glass that correlates telemetry across tools and domains without enforcing a monolithic datastore, backed by automatic collection via standard endpoints to minimize onboarding friction as backends change. As a platform service, observability should offer seamless SSO/RBAC, scalable aggregation across teams (avoiding per-team silos), codified dashboards/alerts, and a clear shared-responsibility model: product teams own dashboards and alert definitions; the platform team owns ingestion, storage, and UX; vendors provide cloud and SaaS foundations. Cross-platform monitoring from outside the runtime (e.g., clusters observed externally) prevents blind spots during outages and enables aggregation across environments.
The chapter tracks the organizational evolution from team-specific tooling to a centralized observability platform treated as an internal product, describing common architectural patterns (collection agents, durable ingestion, type-appropriate stores for metrics/logs/traces, and flexible visualization/alerting) and urging modular, interoperable choices. Build-versus-buy decisions should weigh total cost of ownership, time to value, opportunity cost, and lock-in, often landing on a hybrid approach that evolves with data. Driving adoption requires education, automation and templates, early success stories, balanced baselines versus optional depth, workflow integration with CI/CD, and incentives—all aimed at lowering friction and raising trust. Finally, publishing SLIs, SLOs, and (where applicable) SLAs—together with error budgets and “SLOs as code”—makes reliability visible, measurable, and improvable, aligning the platform’s evolution with user expectations and business outcomes.
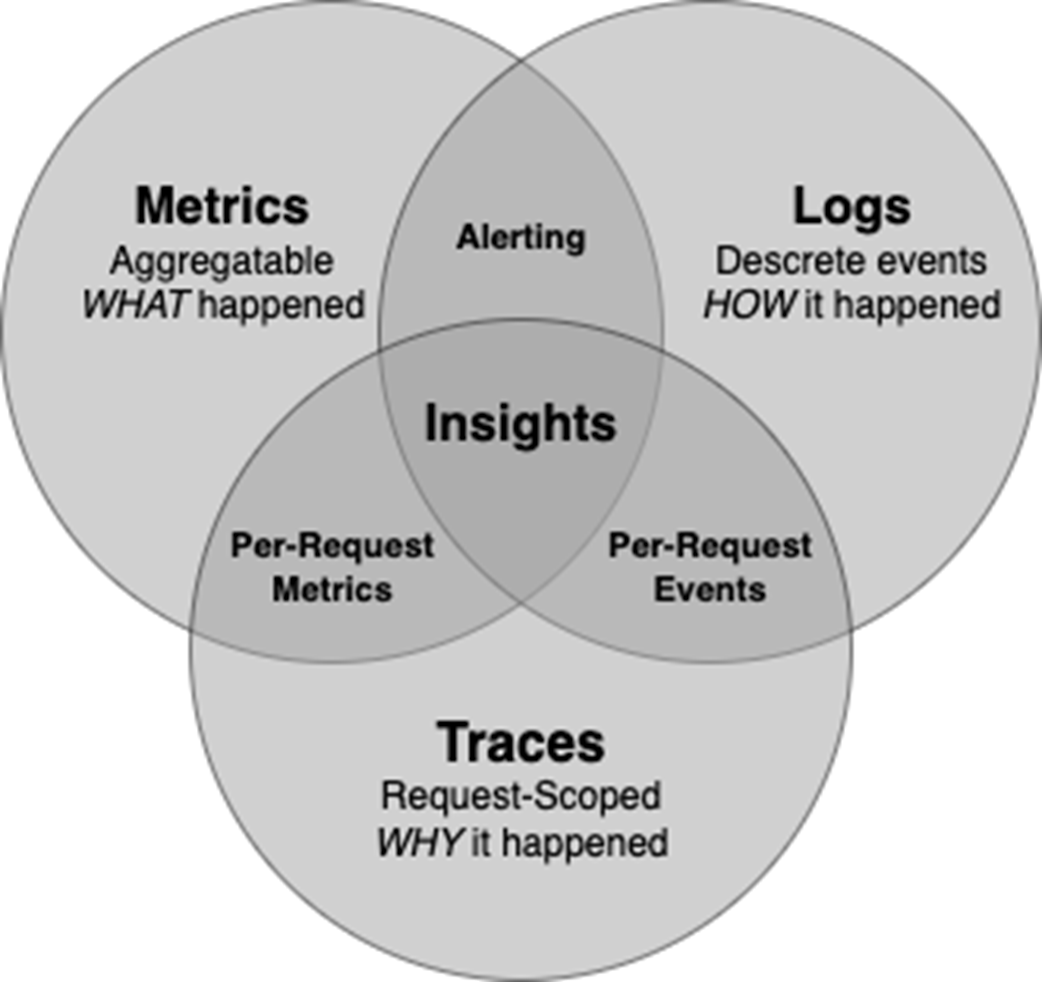
Components of Observability go beyond metrics to include logs and traces. These can be used to show what is happening in the system, why it happened, and how it got into its current state. Metrics and Logs are typically used to trigger alerts, but correlating all three types can result in powerful insights into the system state.
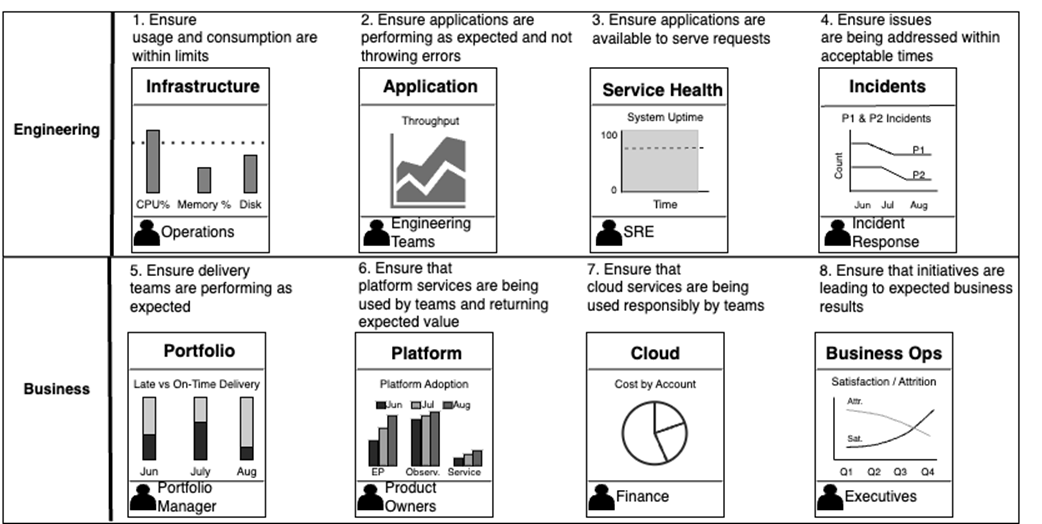
Observability data can be described across multiple engineering and business operations facets. Users and use cases are more than developers and operations personnel responsible for running the system. Stakeholders, security, and governance also have questions that the data can answer.
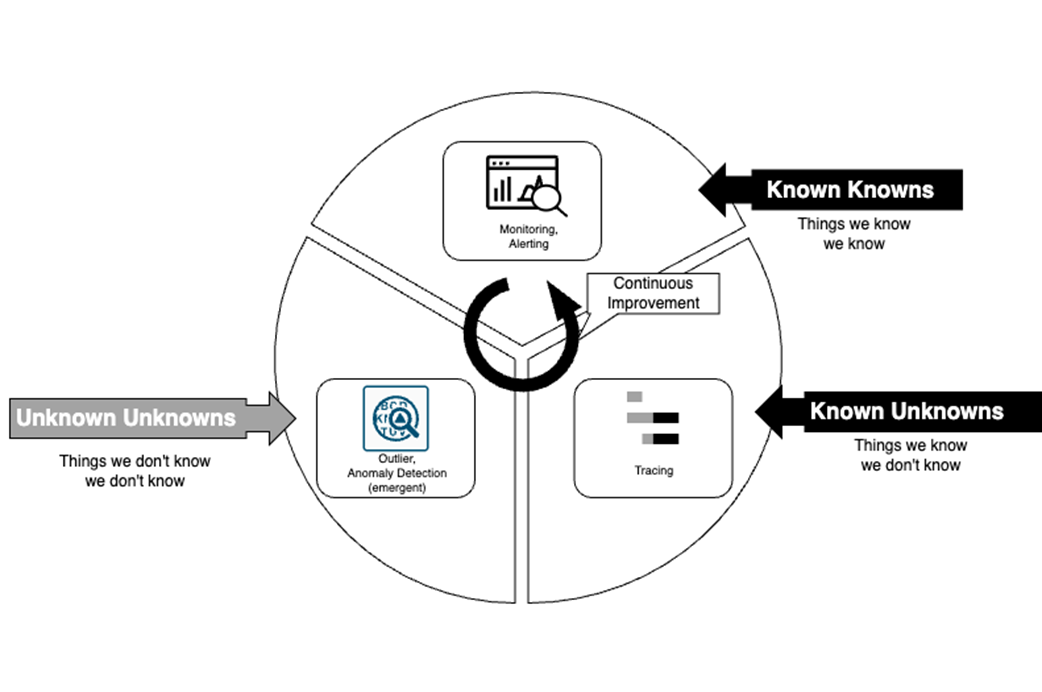
Knowing what to look for when querying observability data is an evolving process.
By allowing observability data to be queried across data sources in a single place, generating insights across the entire business is much easier. Users can create dashboards and alerts based on these insights, allowing them to see the business's health and individual systems.
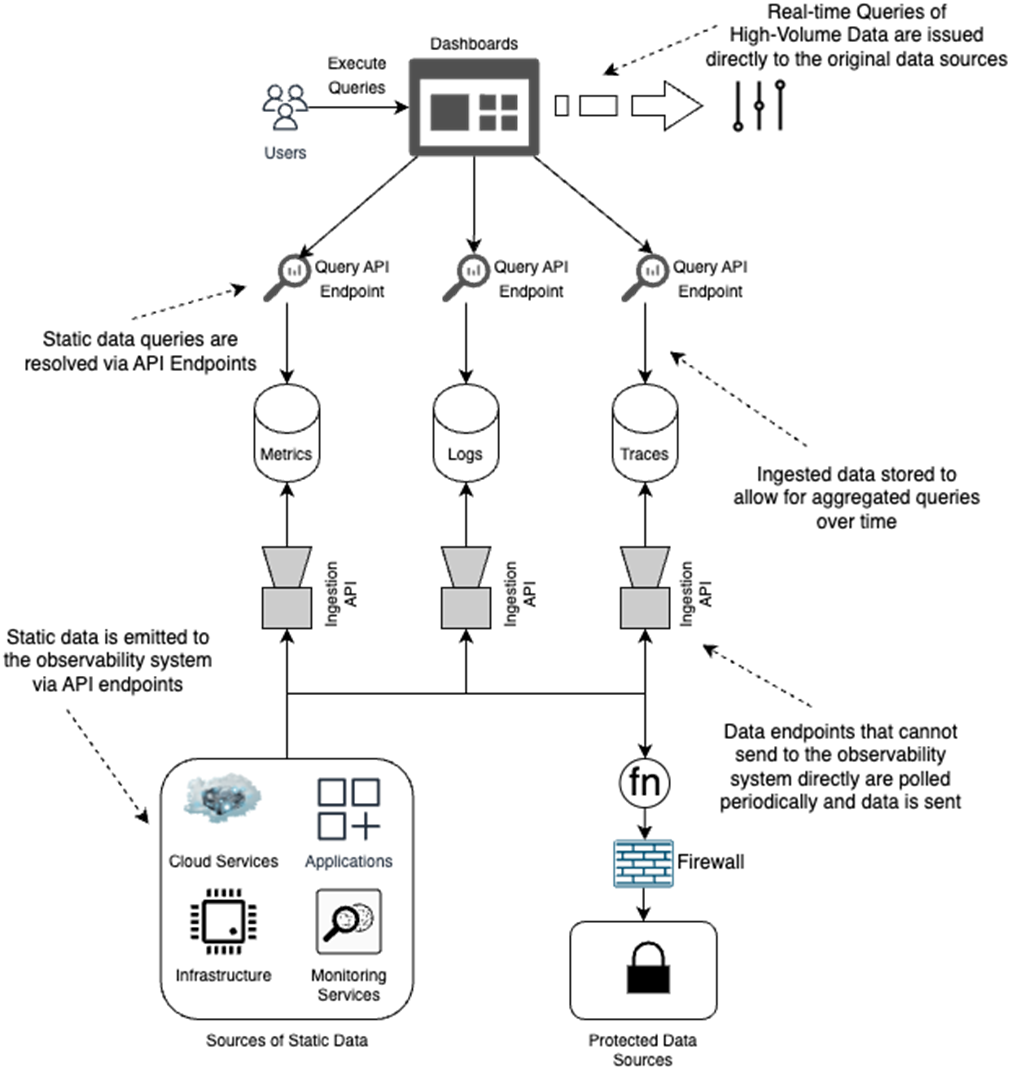
There are three primary forms of telemetry that user applications will produce and need to be ingested: metrics, logs, and traces. By collecting these automatically via well-known endpoints, your users will have a much easier onboarding experience when getting started. They will be unaffected as the backend technologies change over time.
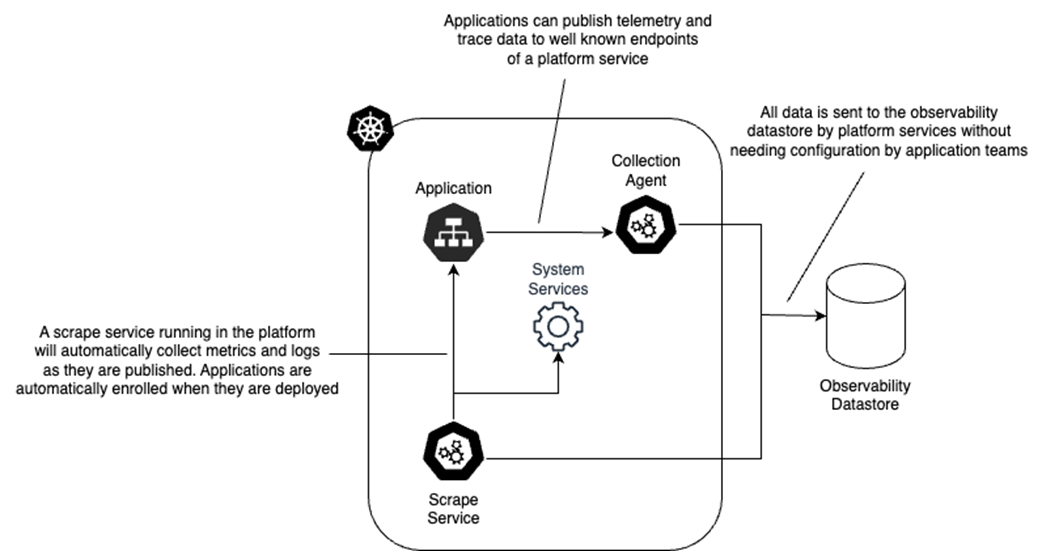
A shared responsibility model is critical to reducing friction when teams adopt any platform service.
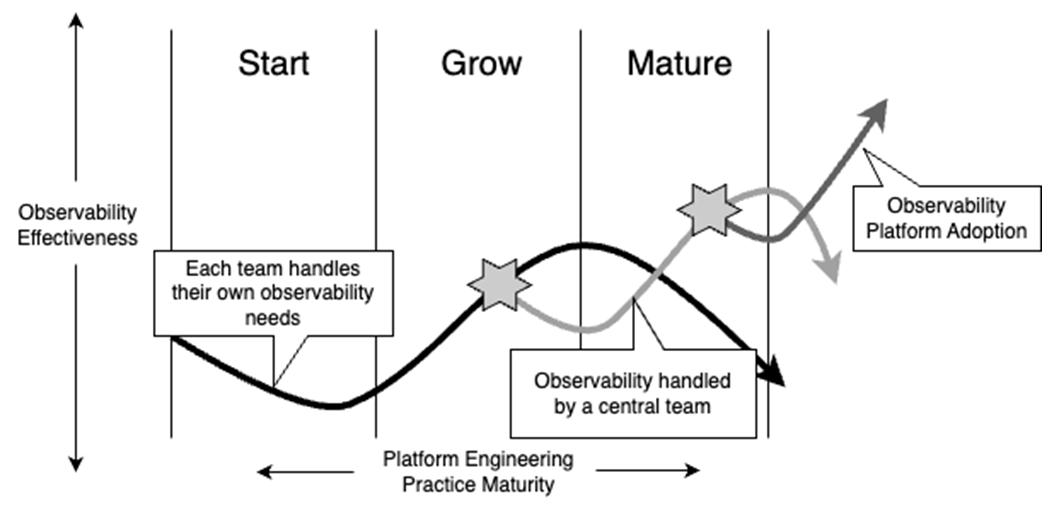
When the adoption of platform engineering services starts, there may not be a need for a fully functional observability platform distinct from the engineering platform. Over time, however, the needs of a growing number of stakeholders, teams, and systems will make investing in this a more feasible option.
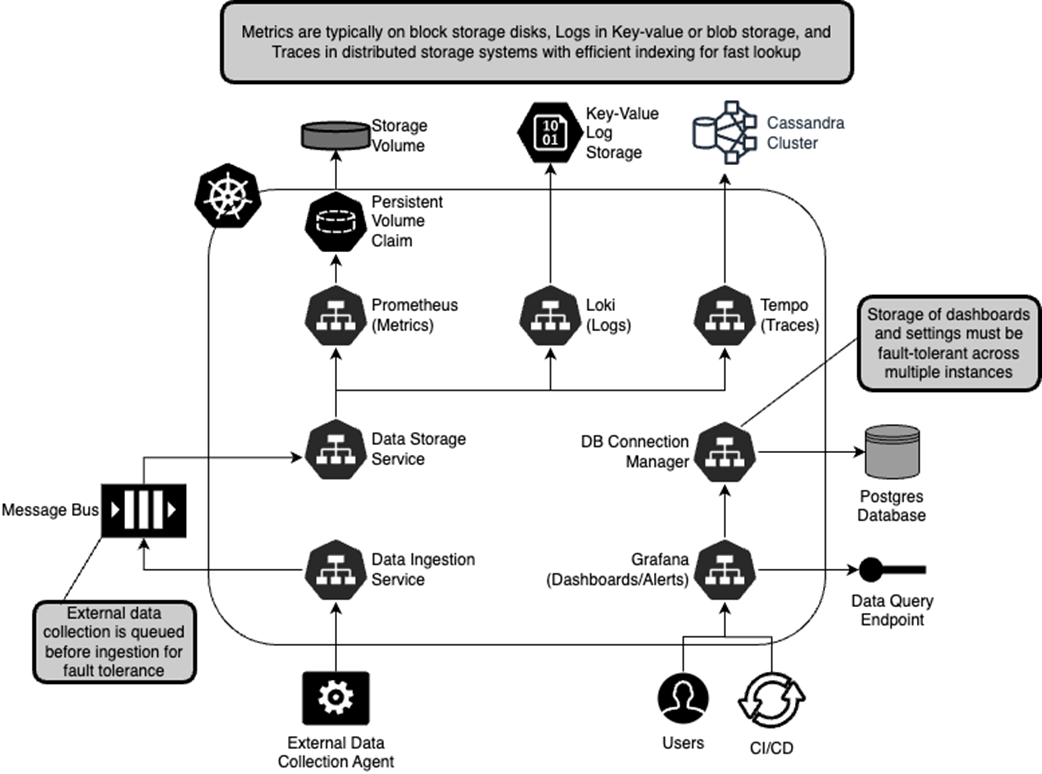
Most observability platforms, whether OSS or commercial, will use a similar high-level architecture. Specific technology components will be different depending on scale, but understanding this footprint will be important when considering build vs buy options.
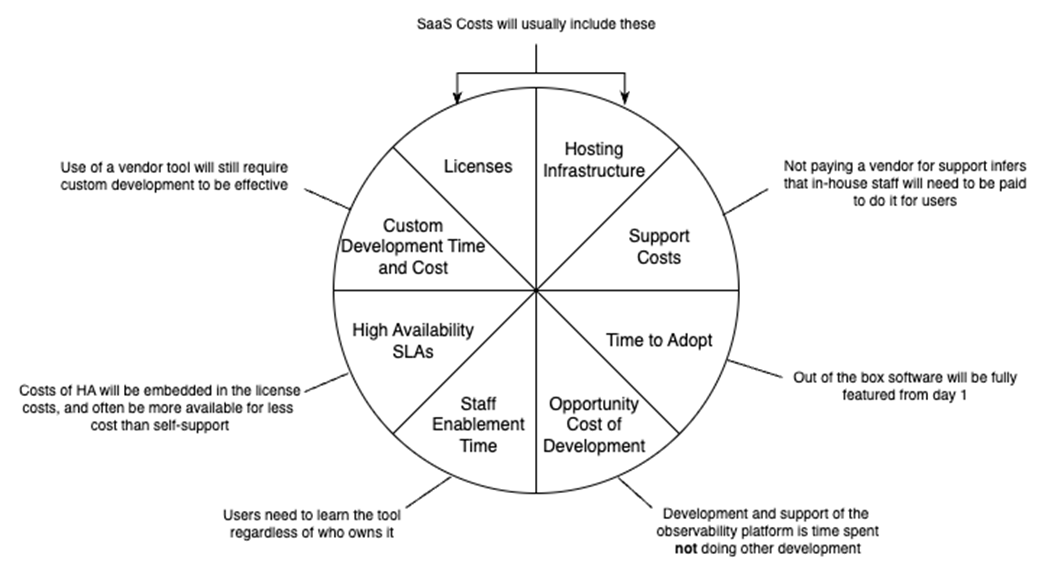
Finding the TCO of buying or building an observability platform, or any commercial software, is much more than just license costs and infrastructure hosting.
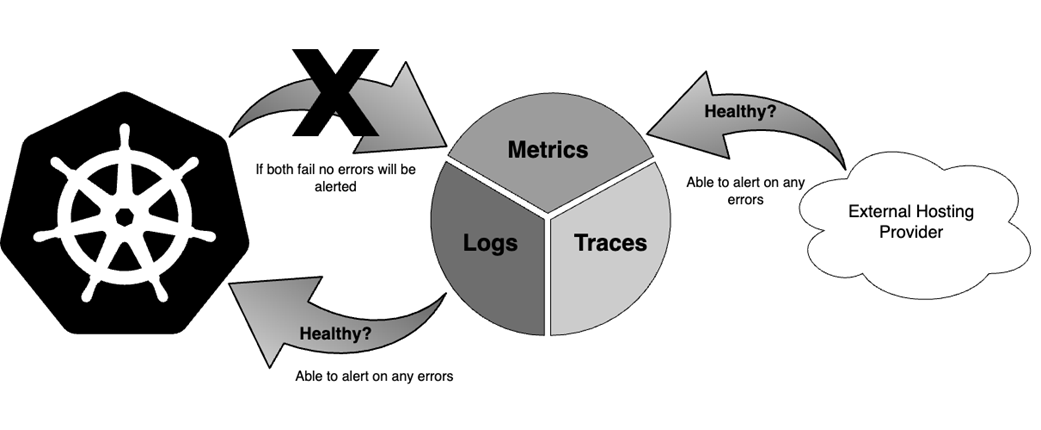
Observing your engineering platform should be done external to the platform itself. Otherwise, you risk not being alerted properly about a total outage because the observability system would also be down! Similarly, your observability platform is an equally critical system component and should also be observed externally.
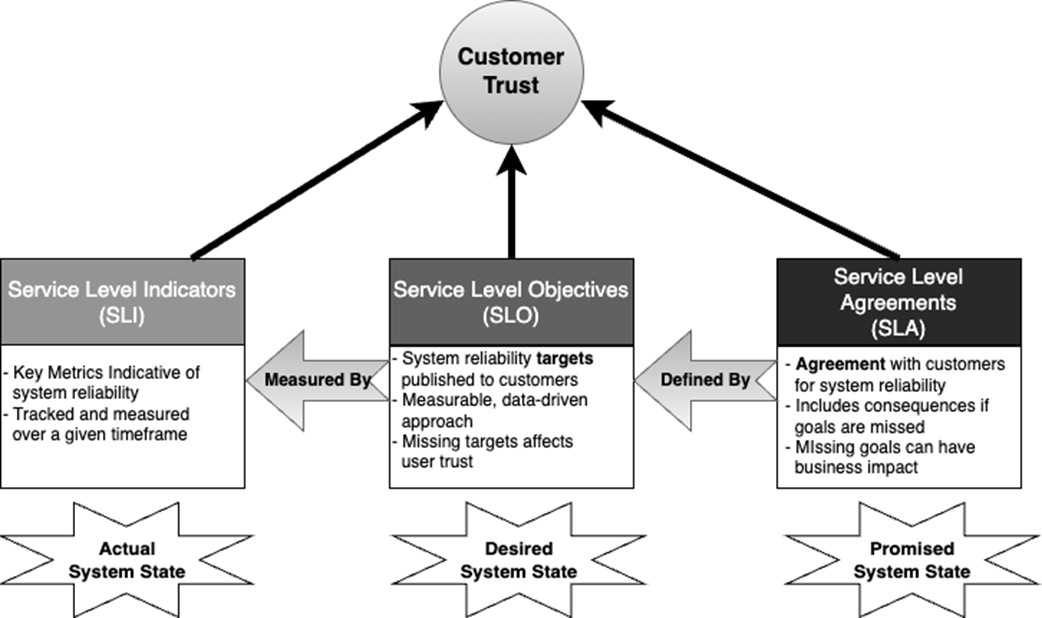
SLIs inform SLOs that can be used to notify and publish SLAs.
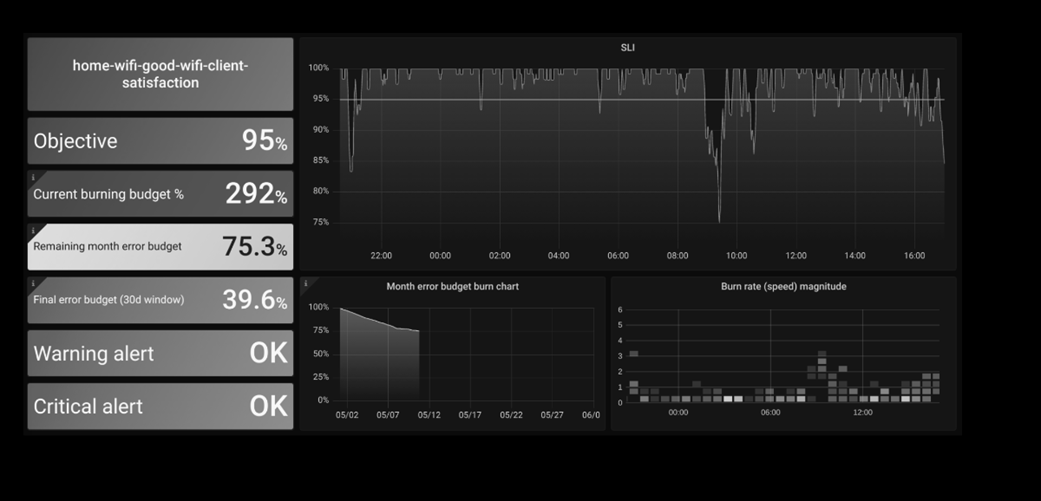
Publishing an SLO dashboard for engineering platform services is an easy way to show success for the platform meeting its objectives. It also becomes a place where teams can quickly check when diagnosing an issue to ensure it isn’t a problem with the underlying systems.
Summary
- Observability is critical for engineering platforms themselves as well as the products these platforms are supporting.
- Observability is not monitoring or looking at metrics, logs, and traces. Instead, it goes beyond that by predicting a system's internal workings by examining its external behaviors.
- We should be monitoring and alerting on all known-knowns for any component or service.
- We should implement tracing and transaction IDs to accelerate resolving the unknowns that any complex system will exhibit.
- Flexible time-series data analysis visuals are table stakes for dealing with unknown and unanticipated issues. Analyzing all the observability data we collect and developing predictive models around these unknown unknowns is where we find greater value in evolving observability systems.
- Building an observability system includes these five critical steps (1) Understanding your observability goals (2) Buying a tool or building one that provides the necessary framework to achieve these goals with a well-defined and predictable user experience framework (3) Instrumenting your code (4) Ensuring automated and verifiable data collection from all the sources (5) Establishing a transparent shared responsibility model.
- It's important to understand that building a world-class observability platform is an evolutionary process, not an immediate achievement.
- Building a platform is not enough. Getting the cultural aspects right to ensure your developers adopt the platform is challenging but crucial.
- Observability is critical to providing SLOs that will establish trust in the system for its customers.
- Workloads deployed on the platform should be observable by default with self-service.
FAQ
What does “observability” mean in a platform context?
It’s the ability to infer and explain a system’s internal state and usefulness from the data it emits, turning telemetry into insights that improve reliability, speed diagnosis, and demonstrate value to the business.How do metrics, logs, and traces differ—and why do we need all three?
- Metrics: high‑volume time series that tell you what happened (e.g., CPU, error rates).- Logs: discrete events that explain how the system got into a state.
- Traces: end‑to‑end request journeys (via correlation IDs) that reveal why issues occur across services.
Correlating all three accelerates root‑cause analysis and prevents misdiagnosis.
Why does observability matter to both platform teams and users?
It increases stability, developer autonomy, and operational transparency; avoids “telemetry debt” and shadow IT; and provides shared, data‑driven insights that build trust between engineering and the business.What are the “eight lenses” of observability beyond basic app monitoring?
Infrastructure, Application, Service Health, Incidents, Portfolio, Platform, Cloud (usage/cost), and Business Operations. Viewing telemetry through all eight avoids tunnel vision and ties engineering signals to business outcomes.What does “good” look like? How do known‑knowns, known‑unknowns, and unknown‑unknowns guide observability?
- Known‑knowns: predictable failures—define SLIs/SLOs, alerts, and self‑healing.- Known‑unknowns: expected but varied failure modes—instrument with rich tracing and context.
- Unknown‑unknowns: surprising failures—use broad, high‑quality data, flexible dashboards, and anomaly/outlier detection to surface weak signals.
How do we avoid shadow IT (spreadsheet sprawl) with observability?
Provide self‑serve, standardized dashboards and queries; publish shared definitions and schemas; centralize access via a single pane of glass; and keep telemetry consistent so downstream consumers aren’t broken by schema drift.What is a Single Pane of Glass (SPOG), and how do we build it without a monolithic datastore?
A SPOG is a unified place to query, correlate, and visualize telemetry across tools and teams. Implement type‑specific ingestion (metrics/logs/traces), dedicated storage per type, secure push/pull from sources (even across firewalls), and shared query APIs powering user dashboards.What makes observability a great platform service for developers?
Seamless SSO/RBAC, organization‑wide aggregation (not team silos), scalable performance as data grows, and everything managed as code (dashboards, alerts, queries) with starter kits so teams can customize safely.How is telemetry automatically collected from user applications?
Use collection agents and scrape services for well‑known endpoints, accept pushes from instrumented apps (e.g., OpenTelemetry), and route all data to a central datastore so backend changes don’t impact application teams.How should we handle SLIs, SLOs, and SLAs—and make SLOs “as code”?
- SLIs: the measured signals (e.g., latency, availability).- SLOs: targets for those signals (e.g., p99 latency ≤ 200 ms, 99.9% of the time) with error budgets to guide response.
- SLAs: contractual commitments (often external only).
Publish SLO dashboards, track burn rates, and manage SLO configs, rules, and alerts in code to build trust and speed diagnosis.

 Effective Platform Engineering ebook for free
