7 The Art of Metrics: Tracking Performance for Organizational Success
Metrics are standardized quantitative measures that track processes, outcomes, or activities over time, helping organizations and the public alike interpret change and make decisions. The chapter emphasizes that well-chosen metrics confer strategic advantage and should be organized across three tiers: performance metrics that indicate overall health (financial, operational, customer); organizational strategy metrics that illuminate drivers and predictors of performance (customer behavior, product usage, market context) and, where possible, establish causal links; and accountability metrics (team and individual KPIs) that align day-to-day work with broader goals. Together, these tiers enable clarity on results, insight into why results occur, and responsibility for execution, provided they are regularly revisited as conditions evolve.
Designing effective metrics hinges on the SMART framework—Specific, Measurable, Achievable, Relevant, and Time-bound. Specificity requires clear operational definitions agreed by stakeholders; measurability demands reliable, consistent, high-quality data captured at stable intervals; achievability relies on understanding trends, benchmarks, and the levers that can move a metric; relevance keeps measures tied to strategic outcomes rather than convenient but unhelpful proxies; and time-boundedness matches aggregation windows to the pace of underlying processes and initiatives. To set sound targets, the chapter advocates establishing baselines through exploration of distributions, outliers, segments, seasonality, tenure effects, and correlations; selecting context-rich benchmarks (industry, peer-reviewed, and public data); then proposing ambitious-but-realistic goals and iterating as the organization and its environment change.
The chapter also warns against common pitfalls that distort meaning or impede action. It favors incremental over purely cumulative views to reveal real fluctuations, urges careful choices about data granularity to avoid masking important segments, and cautions against composite indices that compress nuance unless rigorously researched and maintained. It recommends pairing primary metrics with counter (guardrail) metrics to balance competing objectives and prevent unintended harm (e.g., speed versus quality). For visualization, it encourages simple, familiar charts that match the analysis, and careful axis choices to avoid exaggerating or minimizing change, steering clear of confusing dual axes and unnecessary logarithmic scales. Finally, it stresses clear communication—presenting context, baselines, targets, and counter metrics—so stakeholders can interpret progress, stay accountable, and make informed, timely decisions.
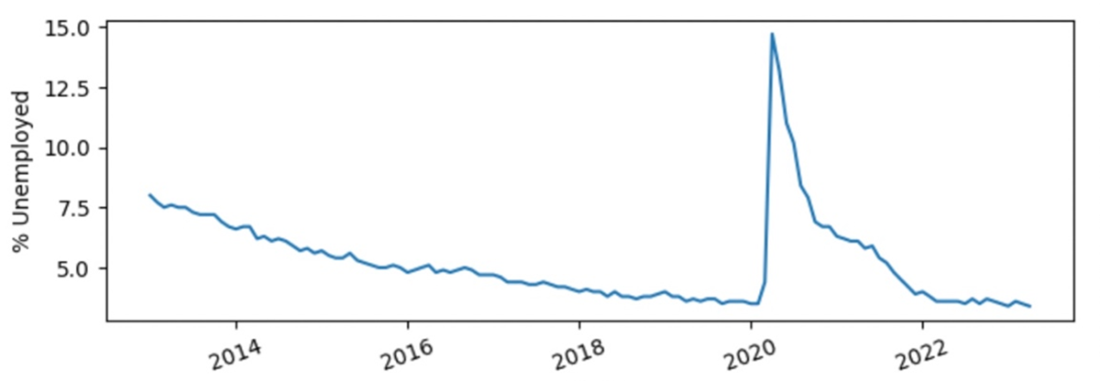
The official unemployment rate reported monthly from 2013 to 2023
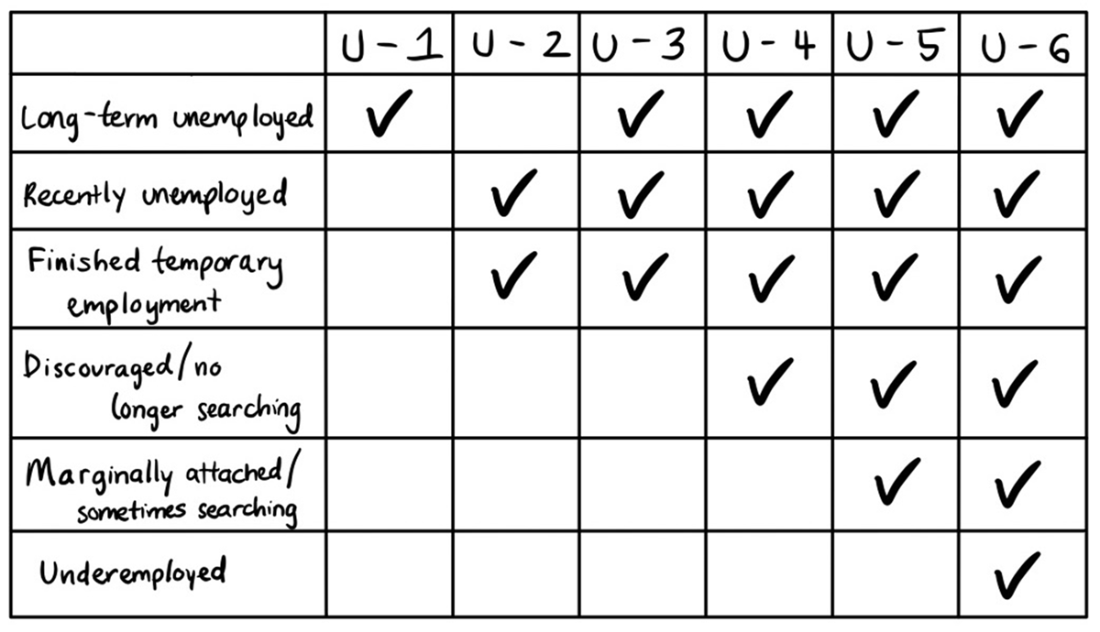
Each unemployment metric includes different types of unemployed or underemployed workers
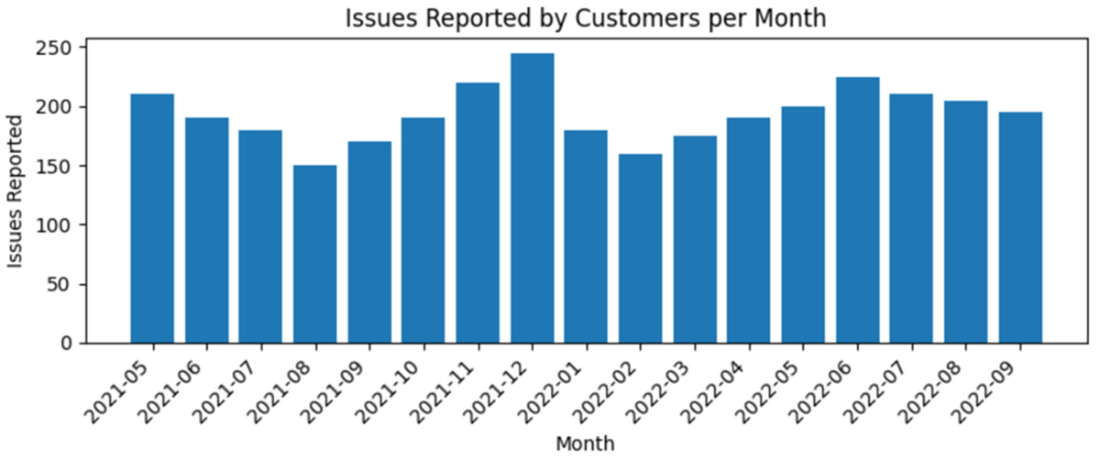
Metrics are usually depicted as an aggregate measure over time.
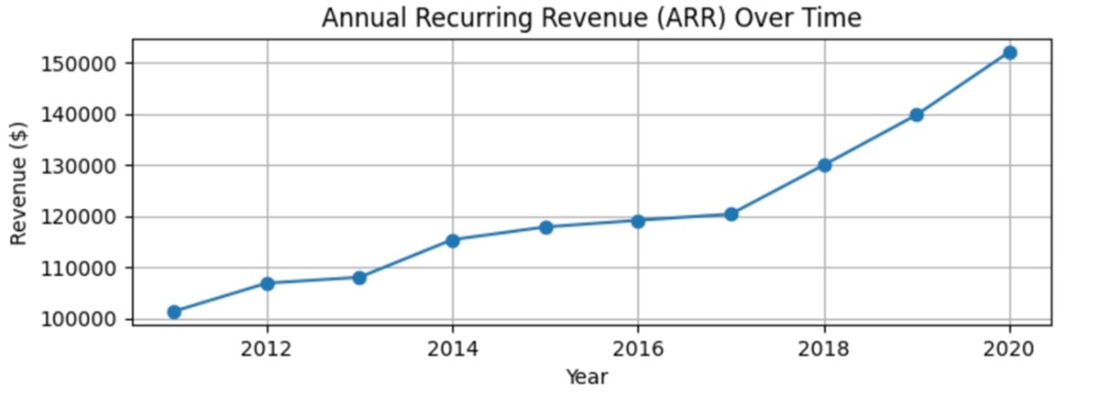
Annual recurring revenue (ARR) or monthly recurring revenue (MRR) is a standard financial metric among businesses with subscription-based models.
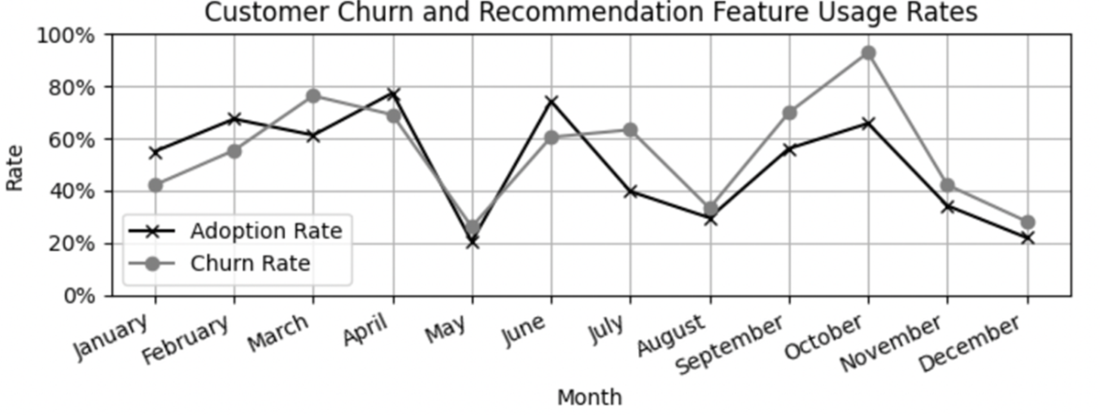
Visually representing strong relationships between strategy and performance metrics can help your stakeholders understand long-term trends and if the relationship strengthens or weakens over time.
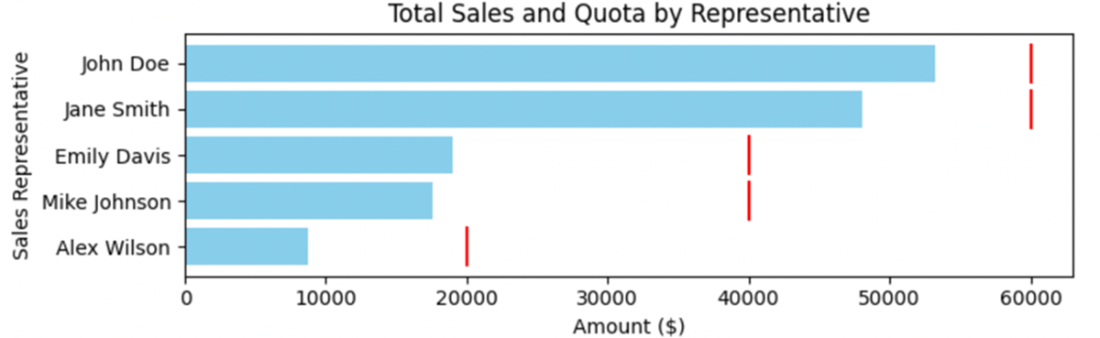
A graph showing the sales representative performance compared to their quotas, based on their seniority at the organization.
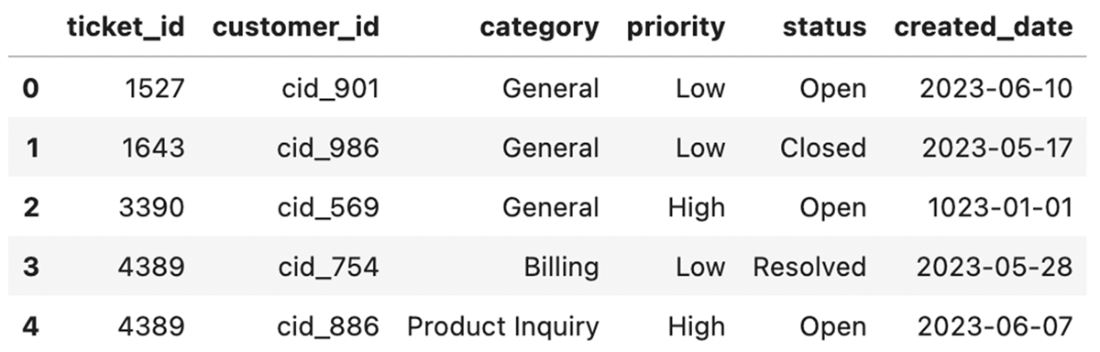
This dataset contains duplicate primary keys (ticket_id) and a bad date value that can degrade the quality of any metrics created.
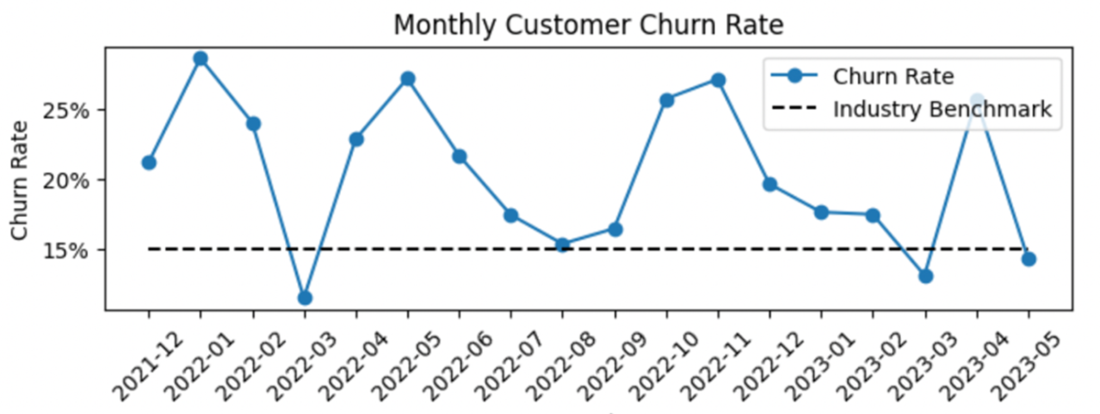
This chart shows a company's customer churn rate compared to an industry benchmark. Churn tends to be higher than the benchmark, which suggests there may be room for improvement in the customer retention rate.
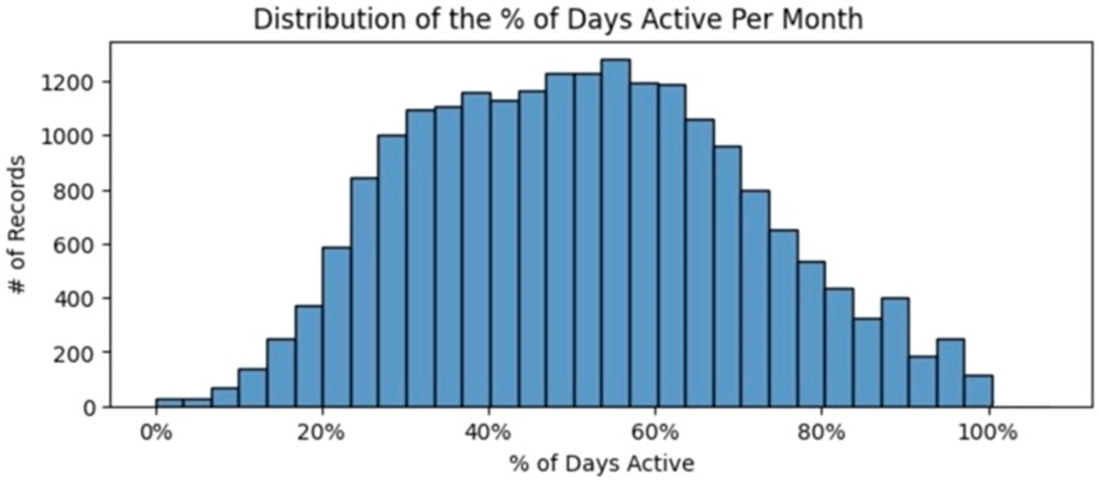
A histogram of the percent of active days in a month shows a possible bimodal distribution
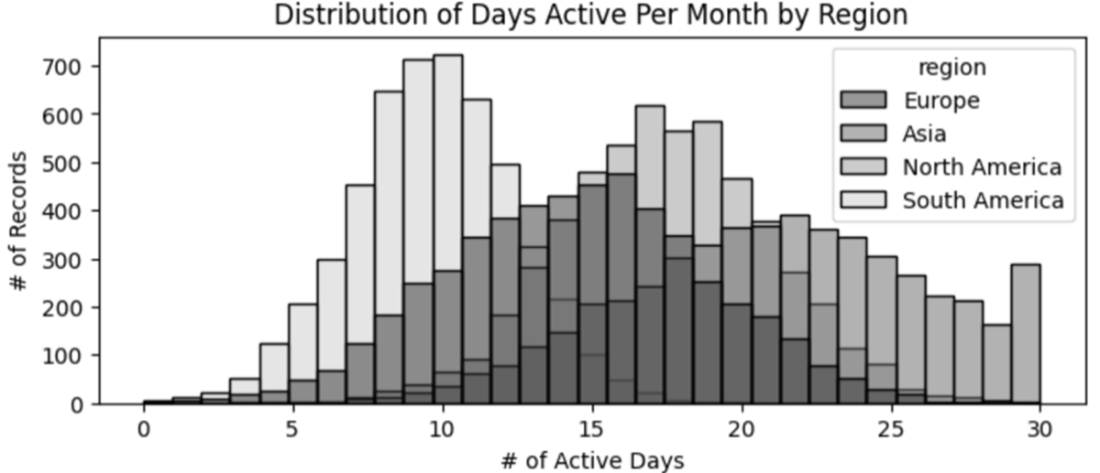
Histograms of active days broken out by region segment to better understand the data.
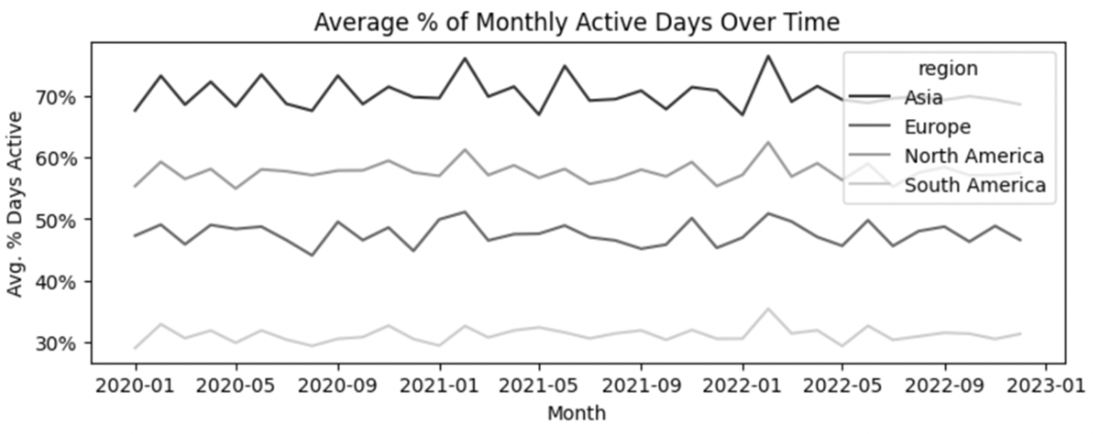
Average percentage of monthly active days, aggregated by month across three years.
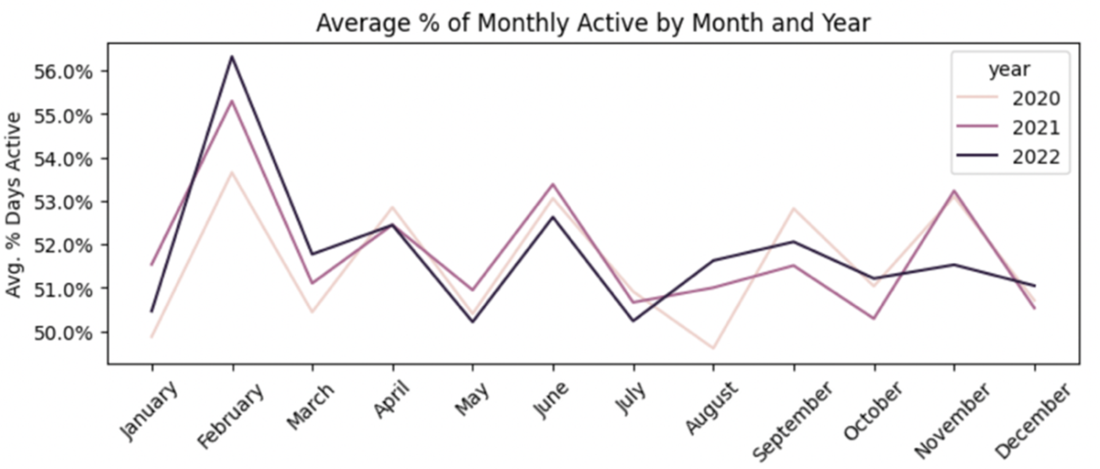
Monthly active days are shown by year and month number to investigate potential seasonality.
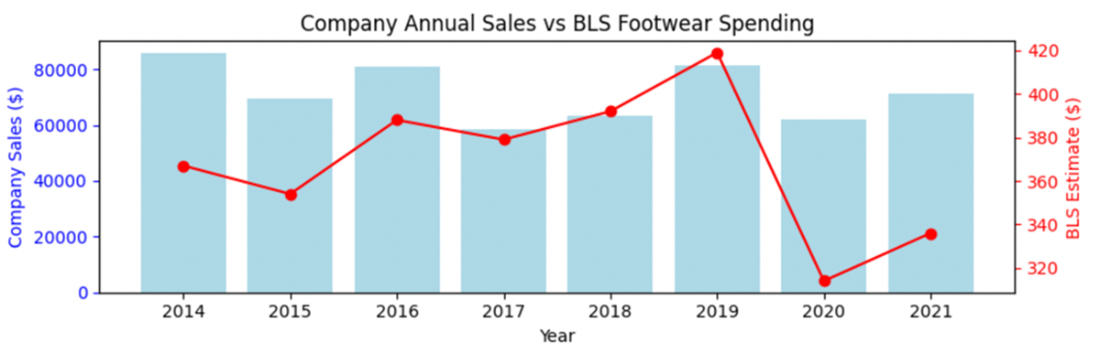
A footwear company's annual sales compared to a benchmark of estimated footwear spending from the Bureau of Labor Statistics (BLS) Consumer Expenditure Survey
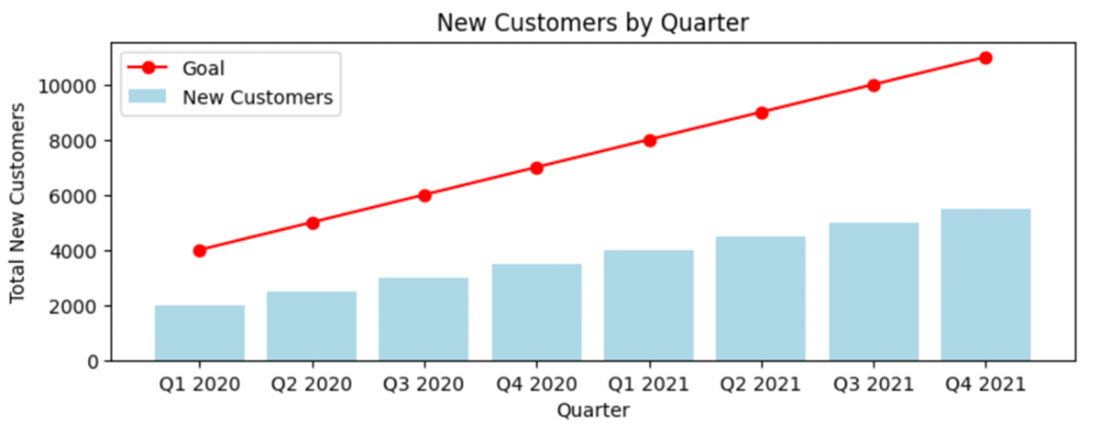
A target of achieving two times the quarterly new customer registrations per quarter is unlikely to be successful or motivating to the teams responsible for these goals.
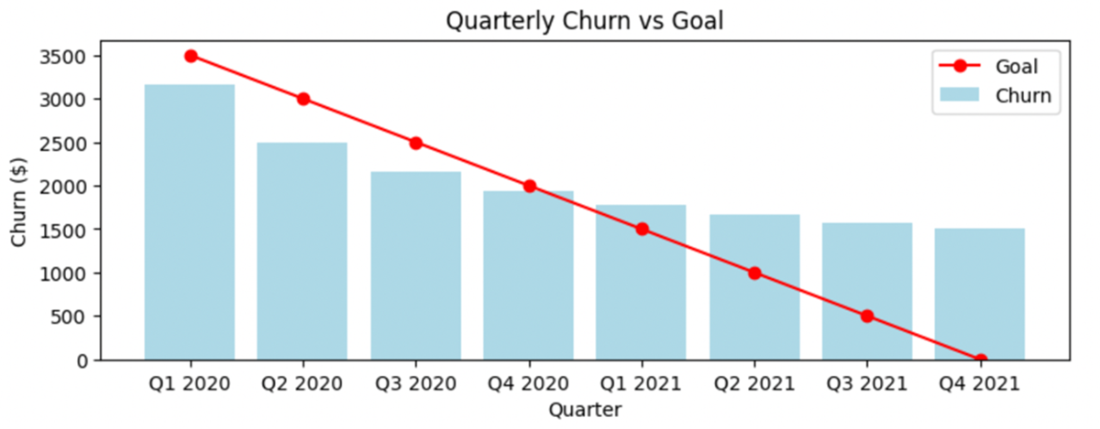
Improvement trajectories cannot be linear forever. Within four quarters, a static goal for reducing customer churn quarter over quarter has diminishing returns and eventually becomes unfeasible.
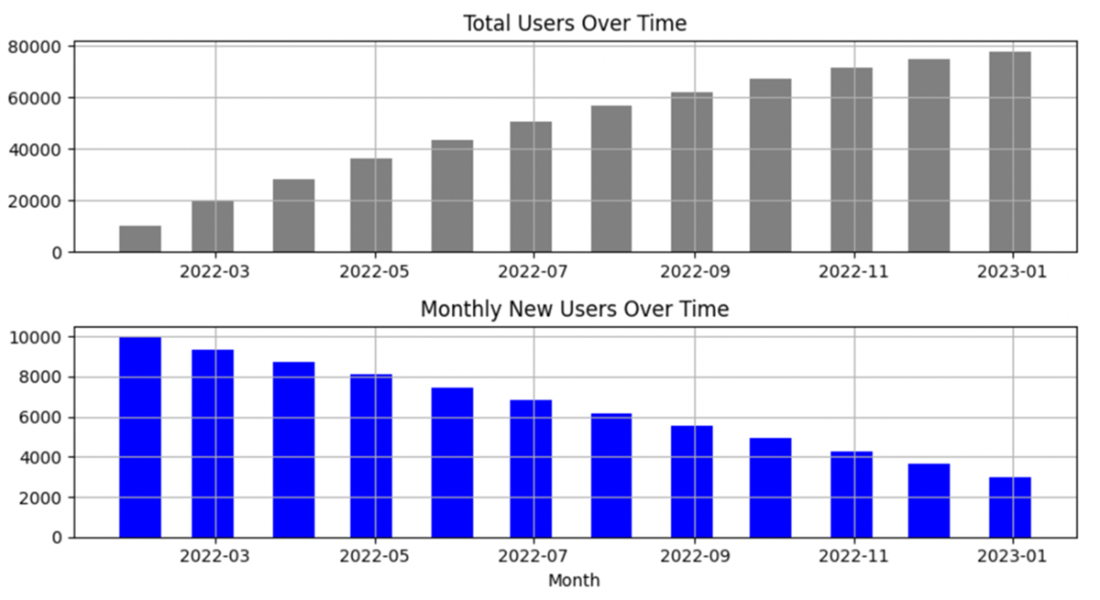
A cumulative user count shows the overall growth but may disguise a decrease in growth rate.
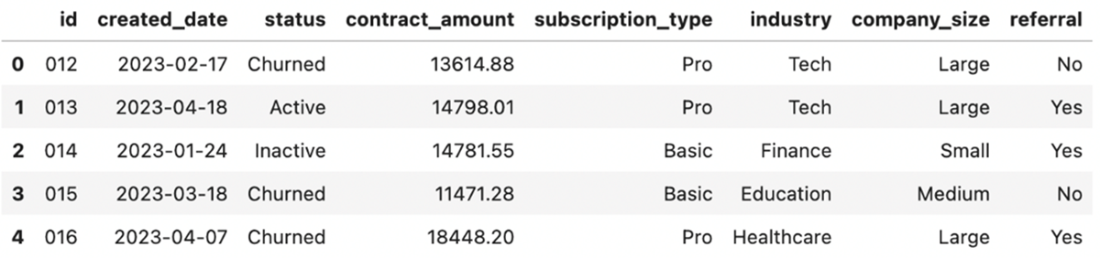
Sample data showing information about customers at a B2B company
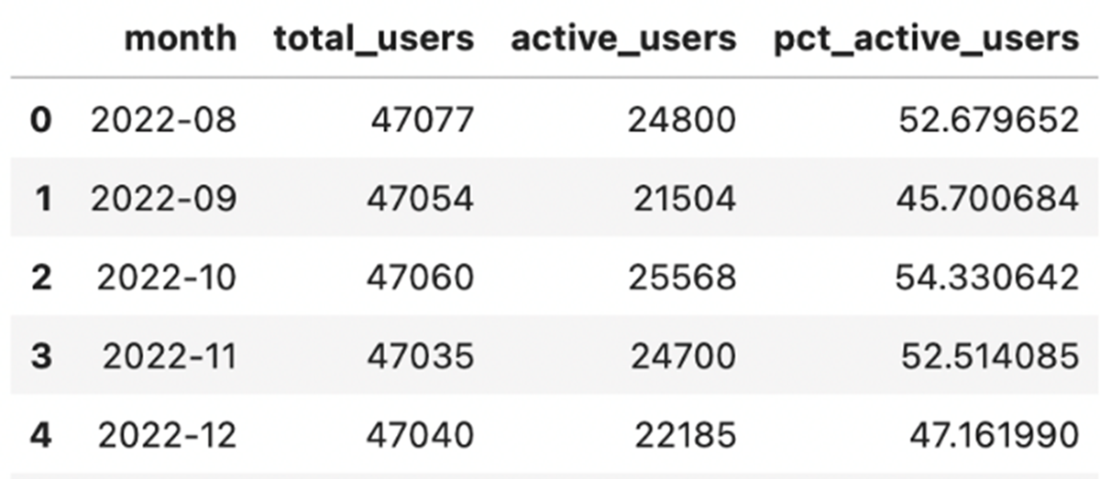
Example of a monthly active user rate aggregated across all users
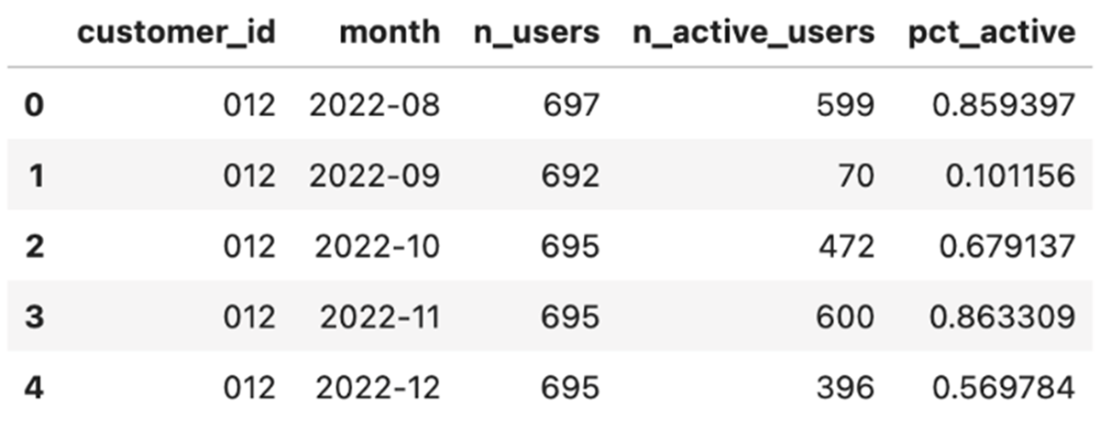
Partially aggregated user activity data by customer and month
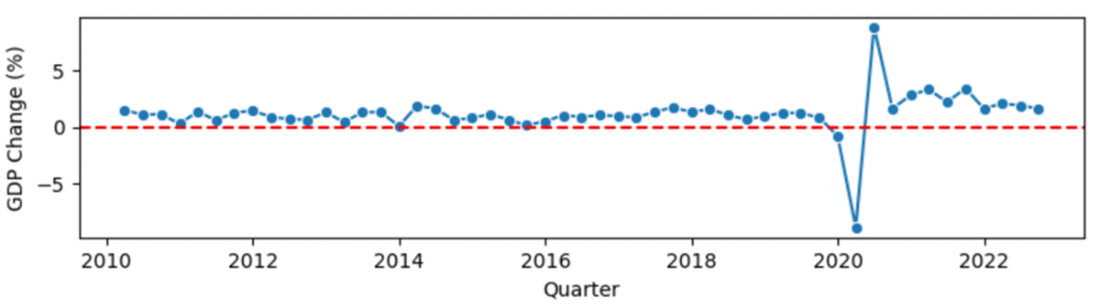
The GDP is reported as a dollar value and a percentage value, showing relative change from the previous quarter.
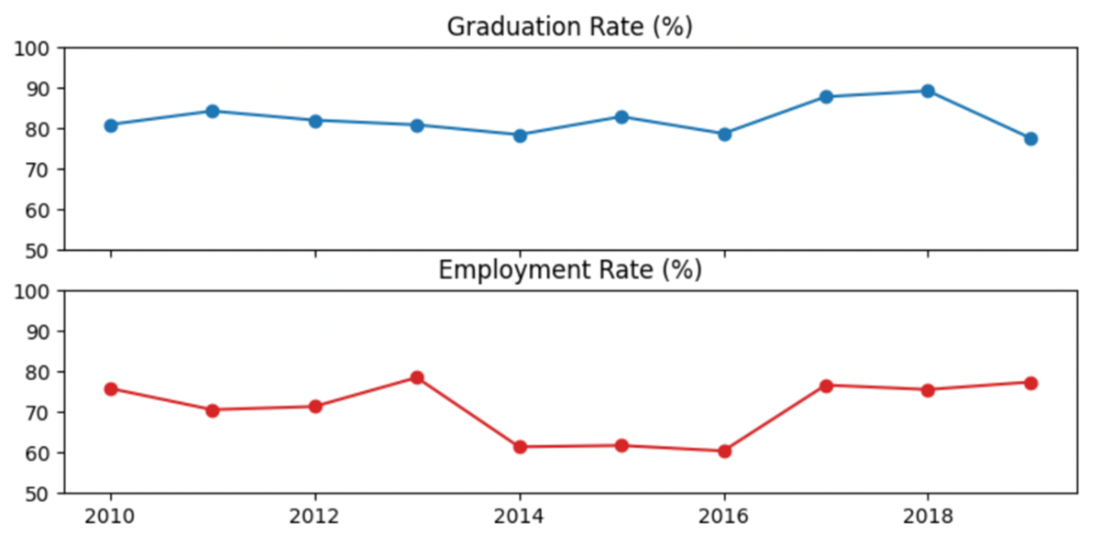
A simple visualization of the non-profit’s graduation rate and an employment counter metric.
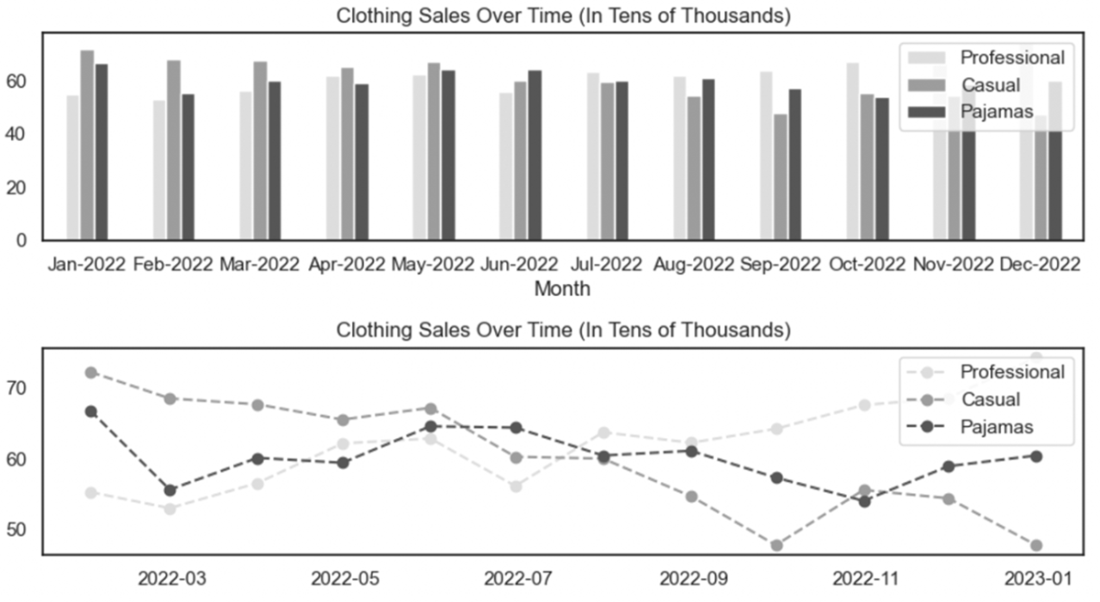
Line graphs are typically easier to interpret when visualizing trends between groups over time.
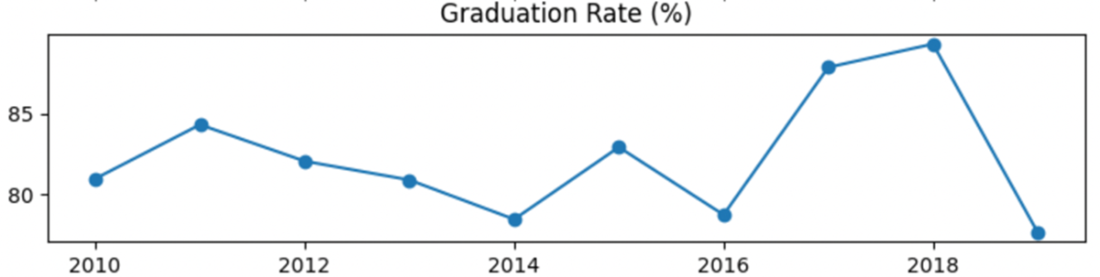
This figure shows the same data as Figure 7.21, but with the default y-axis limits set using matplotlib based on the minimum and maximum values in the dataset. These defaults exaggerate the perception of fluctuation in the data.
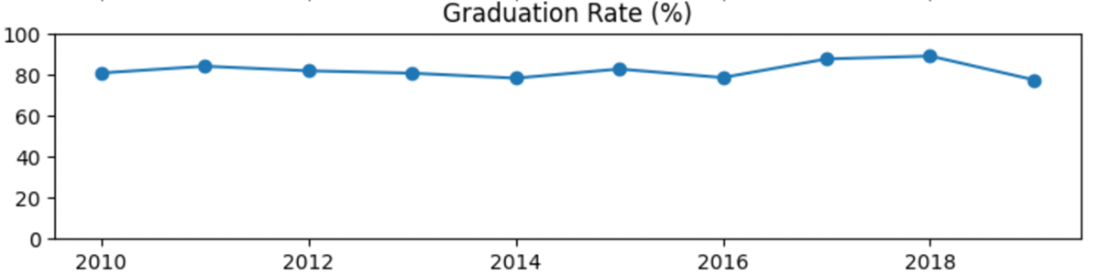
The same graduation rate metric appears to have little to no fluctuations when the y-axis limits are extended between 0% and 100%.
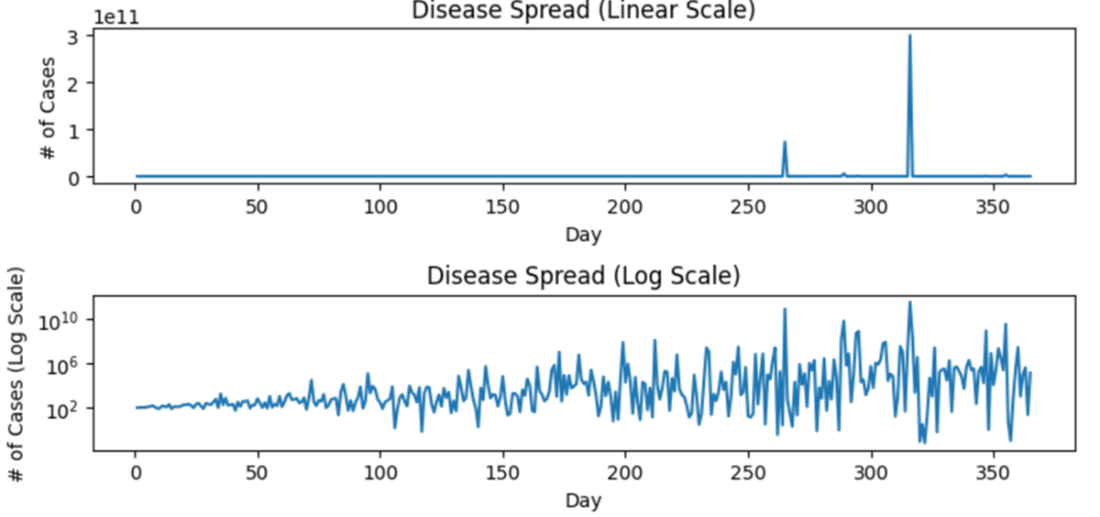
Logarithmic scales can help visualize metrics with exponential fluctuations in the data, but should be used with caution.
Summary
- Metrics are standardized quantitative measures tracked over time. They're frequently used to track progress, outcomes, and activities related to the organization's and its teams' performance.
- Metrics inform decision-making at multiple levels. Performance metrics are the broadest category an organization uses to understand its progress toward goals. Some examples include revenue, lifetime value of customers, and operational efficiency.
- Organizational strategy metrics track specific components of an organization's performance, such as product behaviors, customer sentiment, and market performance. Metrics in this category help different teams at an organization understand the landscape they operate in and make appropriate data-informed decisions.
- Accountability metrics determine the effectiveness and productivity of individuals and teams. These metrics hold individuals accountable and guide performance reviews, bonuses, or training.
- The SMART framework is an essential guide for defining effective metrics. To ensure your organization can monitor and make strategic data-informed decisions, each metric at your organization should be specific (clearly defined), measurable (quantifiable), achievable (realistic and within reach), relevant (aligned with the organization's goals), and time-bound (aggregated at an appropriate timeframe).
- Understanding how to set goals for a metric involves gathering multiple sources of information to establish a baseline or a foundational understanding of the metric and its trends. These sources include:
- Internal, historical data at the organization explored between segments, over time, and in relation to other business metrics
- Benchmarks, or comparison metrics, often gathered from public sources such as government, industry surveys, or peer-reviewed literature
- Initial targets, which allow you to test your ability to drive change in your metric and achieve goals
- How you represent your metric is as important as how you define it. There are many pitfalls in calculating and setting up a metric that can diminish the value an organization gains. Some examples include:
- Cumulative metrics can create an illusion of continuous improvement despite declining performance. Incremental views of metrics are almost always a more appropriate way to provide a clear picture of trends in performance.
- The granularity, or level of detail in your dataset, can significantly impact the interpretability and accountability of a metric. Metrics measured and grouped at a low grain (e.g., geography grouped by country) can obscure critical details, while a highly granular metric (e.g., zip code) can confuse your stakeholders with too much detail. Choosing an appropriate grain is a balancing act that requires understanding baseline information.
- A composite metric combines two or more metrics to measure complex concepts. These tend to be challenging to interpret and act on and obscure competing trends among the individual metrics. Limit efforts to develop these as much as possible.
- Counter metrics safeguard against the potential adverse effects of focusing on only one performance indicator. Each metric should include counter metrics to ensure your organization takes a balanced approach to strategic goal-setting.
- Visual representation is critical in communicating information about a metric and its performance. The wrong chart type can confuse your stakeholders and draw attention away from trends and differences. Distorting the axes on your charts can create the impression that there is a large trend where there is none, and vice versa. Your chart type and axes should be carefully selected and set to display your metric.
FAQ
What are metrics and why do they matter for organizations?
Metrics are standardized quantitative measures that track processes, outcomes, or activities over time. They help organizations understand trends, evaluate performance, and make informed decisions. Because they’re simple to interpret, metrics can be shared widely with stakeholders at all levels. Public examples include unemployment rates and air quality indexes; inside organizations, metrics guide strategy, investments, and day-to-day operations.What are the three tiers of organizational metrics?
- Performance metrics: Top-level indicators of organizational health (e.g., revenue, profit margin, churn).- Organizational strategy metrics: Drivers and correlates that explain performance (e.g., product usage, feature adoption, referral rates, market indicators).
- Accountability metrics (KPIs): Team- or individual-level measures tied to responsibilities (e.g., time-to-fill roles, quota attainment, bug resolution time). These align daily execution with strategic goals.
Which metrics should a new or small organization establish first?
Start with performance metrics that directly reflect viability:- Financial: Revenue, profit margin, CAC, ARR/MRR (subscription businesses). Tailor for non-profits/government as needed.
- Operational: Efficiency and throughput (e.g., production volume, downtime, time-to-complete workflows).
- Customer: Experience and retention (e.g., CSAT, churn, LTV). After these foundations, add strategy metrics that explain the “why.”
How do strategy metrics help explain changes in performance?
Performance metrics show what happened; strategy metrics help uncover why. Track customer behaviors (engagement, referrals), product usage (adoption, task completion time), and market context (supply, demand, prices). Explore relationships with performance via simple methods first (before/after comparisons, regressions, group contrasts). Correlation is not causation—use careful analysis and, where feasible, causal methods.How do I design SMART metrics?
- Specific: Use clear operational definitions (e.g., “% of tickets resolved in 24 hours”).- Measurable: Ensure reliable, consistent data collection with defined units, intervals, and quality controls.
- Achievable: Set attainable targets grounded in history, benchmarks, and known drivers.
- Relevant: Tie metrics directly to strategic objectives; avoid easy-but-irrelevant proxies (e.g., lines of code).
- Time-bound: Choose an appropriate reporting cadence (daily/weekly/monthly/quarterly) that reflects how the underlying process changes.
How do I establish baselines and set realistic targets?
1) Analyze historical data: distribution, outliers, segments, trends over time, tenure effects, and correlations with known metrics.2) Identify benchmarks: industry reports, peer-reviewed research, and public datasets (e.g., BLS indicators) to contextualize performance.
3) Set targets: Ambitious yet feasible; linked to actions teams can take; account for seasonality and external constraints.
4) Iterate: Revisit as conditions change; avoid assuming linear improvement forever.
When should I use cumulative vs. incremental metrics?
- Incremental (preferred for monitoring change): Shows new activity per period (e.g., new customers per month), making fluctuations visible and actionable.- Cumulative: Shows total to date (e.g., total customers). Useful for status/context, but often masks slowdowns and can become a vanity metric. Best practice: show cumulative figures alongside incremental trends.
Why are counter (guardrail) metrics important, and how do I choose them?
Focusing on one goal can unintentionally harm another. Counter metrics provide checks and balances to protect quality and broader objectives. Examples:- Speed vs. quality: Tickets resolved under 24 hours vs. CSAT.
- Productivity vs. defects: Features shipped vs. bugs introduced.
- Access vs. outcomes: Program enrollment vs. completion/employment. Pick counter metrics by asking, “What could degrade if we optimize this single number?” and report them together.
How do I pick the right granularity for metric calculations?
Choose the data grain that matches decisions you need to make:- Entity level: User vs. customer (B2B) to avoid overweighting large accounts; consider partial aggregation (per customer per month) before overall averaging.
- Geography: Zip/city/state/country depending on the scope of action.
- Product hierarchy: Category/segment needed to reveal meaningful patterns.
Balance detail (to find insights) with simplicity (to see overall trends).
What visualization practices help stakeholders interpret metrics correctly?
- Chart choice: Use line or grouped bar charts for time series; prefer lines for segmented trends over time.- Axes: Set y-axis bounds to reflect the observed range without exaggerating or minimizing change; avoid dual axes unless absolutely necessary; use log scales sparingly with clear explanations.
- Time aggregation: Align cadence with process speed, seasonality, and experiment duration.
- Clarity: Keep visuals simple, segment when useful, and place counter metrics alongside primary metrics for context.

 Effective Data Analysis ebook for free
